6 minute read
Shanghai Baoshan


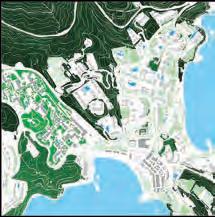
Shanghai: Hydrological transformation impacts on the natural environment
Advertisement
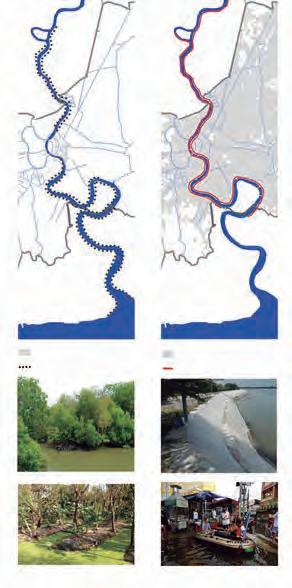
Since the construction of the Three Gorges Dam in 2003, the Yangtze subaqueous delta is experiencing overall (net) erosion leading to loss of land and submergence.
(m) -57~-40 -40~-30 -30~-20 -20~-10 -10~-5 -5~-2 -2~0 0-1 Delta recession
Yangtze River Hydrographic network
Waterbodies Man-made canals
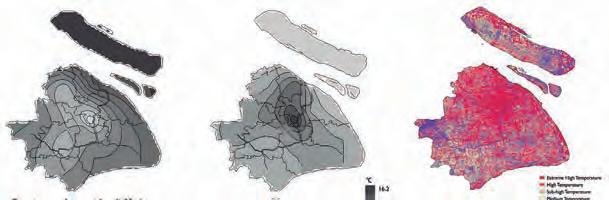
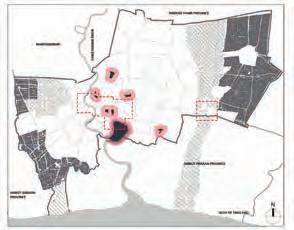
Baoshan district: Industrialisation impacts on the microclimate
CO2 emissions Air pollution
(kg CO2 · a-1) 0-749 750-1,192 1,193-1,482 1,483-1,674 1,675-1,964 1,965-2,407 2,408-3,080 3,081-4,104 4,105-5,662 5,663-8,033 SO2 NO2 NO
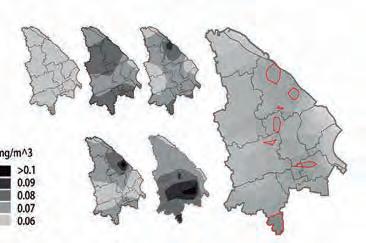
(mg/cu. m) >0.1 0.09 0.08 0.07 0.06 CO2
PM10 Baoshan district is located in northern Shanghai and is divided into two parts: the land and the islands. Developed at the intersection of the River Huangpu and the River Yangtze, Baoshan is known as the waterway of Shanghai. The East China Sea connects over four hundred ports in one hundred and sixty-four countries and regions. Taking advantage of its coastal qualities and alluvial plains, this rich and fertile natural and agricultural territory turned to transport and fishing. The district’s strategic geographical location has encouraged the development of its coast and plains excessively exploiting its potential. The industrial port is destined to become a future mega cruise port terminal. Intensive industrialisation and expansive urbanisation have damaged the territory’s geography and microclimate.
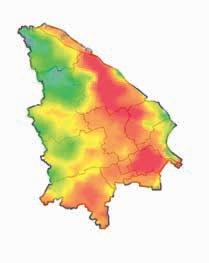
Annual mean wind speed Annual mean temperature Urban Heat Island (UHI)
The maximum annual average wind speed is 3.7 m/s in Chongming, and the minimum wind speed is 2.8 m/s in the Downtown.
Land surface temperature
Temperature in the Downtown is the highest at 16.2 ºC, and the difference from the minimum temperature is 0.8 ºC. ºC 16.2
15.3 High UHI effect directly corelated to urbanisation Extreme high temperature High temperature Sub-high temperature Medium temperature Sub-medium temperature Sub-low temperature Low temperature
Winter Summer ºC 5.5 - 10.70 10.71 - 11.40 11.41 - 12.30 12.31 - 13.50
Cities consume the natural world, either absorbing it into an expanding urban footprint or transforming it into periurban zones for industrial and agricultural use. The growing separation of human beings from nature came at a cost to natural and human capital, damaging ecological systems and the well-being of city dwellers. However, cities also offer opportunities to improve resource efficiency and reduce the environmental impact of society and urban developments. The economies of cities rely on the extraction, transportation, transformation, distribution and consumption of natural resources. They depend on their hinterlands for the supply of materials, water and energy, which are inefficiently used. Cities may be vulnerable by imposing stresses on local resource supplies affecting the natural environment during resource extraction and waste disposal. The impact of urbanisation on land use with the depletion of green and blue coverage directly affects local climate and the level of groundwater. Urban areas consume most of the global energy and entail serious environmental problems related to the degradation of ecosystems by air, water and soil pollution. The issue here is to restructure the use of natural resources in urban developments, considering cities as urban ecosystems that foster transversal relationships between the natural environment and human and economic activities.

Hydrological infrastructure

Hydraulic Infrastructure
River Lakes Major canal Minor canal Wetlands Public space 5×5 km of site Commercial nodes Boat piers
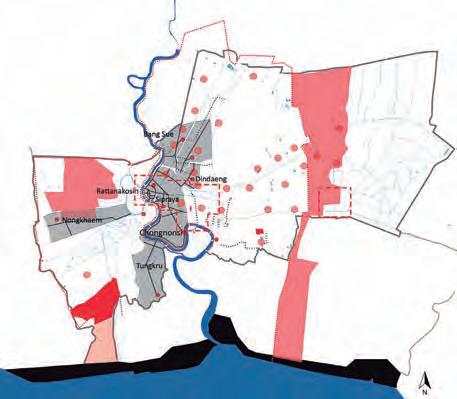
Water retention and flood prevention Natural conservation of flood paths Coastal environmental conservation and restoration Drainage tunnel Dykes Detention areas WWTP WWTP (future) Collection system In the Bangkok Metropolitan Area (BMA), green coverage and water networks that are essential to flood resilience and ecology have been dramatically reduced. In the nineteen sixties, the first national policy on economic development led to deforestation, depleting tropical rain forests to increase agricultural production. Later, under economic pressure, the transformation of farmland into semi-industrial landscapes in urban peripheries has intensified ecological damage. In the city centre, the replacement of the historical canal system with road networks has transformed an aquatic city into a land-based development. While its centre has become denser, the development of its periphery has expanded. Halfway between shrinking nature and the expanding city, Bangkok is facing chronic problems such as extreme weather conditions, poor air quality and difficult access to water and energy.
Urban nature
Biodiversity hotspot Foraging radius of 400 m Rural and agriculture conservation zone Natural flood path conservation zone
Public green Private green Accessibility of public green (10 min walking distance) Informal settlements High-rise condominium
Natural vs. man-made edges of the River Chao Phraya
1920 Present

Communities Mangroves
Mangrove edge Integration Farming community on a flood plain Floods beneficial for agricultural fields Urbanisation Dykes
Man-made edge Segregation Large-scale urbanisation Flood liability

Hong Kong region, urbanisation and natural resources
Hong Kong Protected Nature Reserves as a Condition for Dense Development
In Hong Kong, landscape and open spaces range from playing fields to highly maintained environments, relatively natural environments and protected parks. Hong Kong presents a strong urban context where density and compactness challenge liveability. Although Hong Kong is one of the densest metropolitan areas in the world, about three quarters of the island are countryside, amounting to 1,108 square kilometres and including twenty-four country parks designated for nature conservation, rural recreation and outdoor education.3 Wetlands and marine parks, along with policies for the conservation of flora and fauna, aim to preserve biodiversity. In intense urban contexts, green spaces and natural environments enhance liveability and climate change resilience while reducing urban heat islands (UHI) effect, CO2 and greenhouse gas (GHG) emissions which, in turn, affect energy demand.
1887 1975 Present
Urban sprawl Water reservoirs Existing green
Blue and green networks: 1×1 km sites
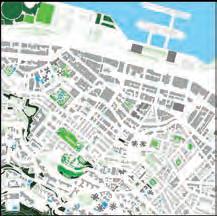
Central
Green area per person 5 sq. m/p
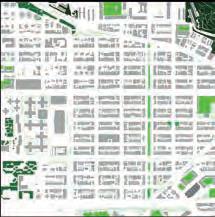
Sham Sui Po
Green area per person 1.5 sq. m/p

Green area per person 28 sq. m/p Green area per person 32 sq. m/p
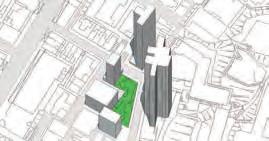
Urban green and public space

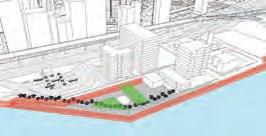
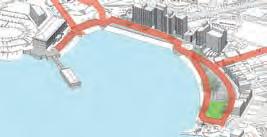
City harbour front

Neighbourhood park

Waterfront