10 minute read
DAM Hydrographic Surveying in the Waitakeres


DAM!
HYDROGRAPHIC SURVEYING IN THE WAITAKERE RANGES
Advertisement
Hayes Ballantyne (Hayes@dmlsurveys.co.nz)
For Watercare, which manages Auckland’s drinking water, understanding the volume of water contained within its reservoirs is of critical importance. Some of the dams were constructed well over 100 years ago and while the surveyors of the day surely gave it their all, technological advancements now allow us to map reservoirs in greater detail, and thus calculate volumes with a much higher degree of accuracy.
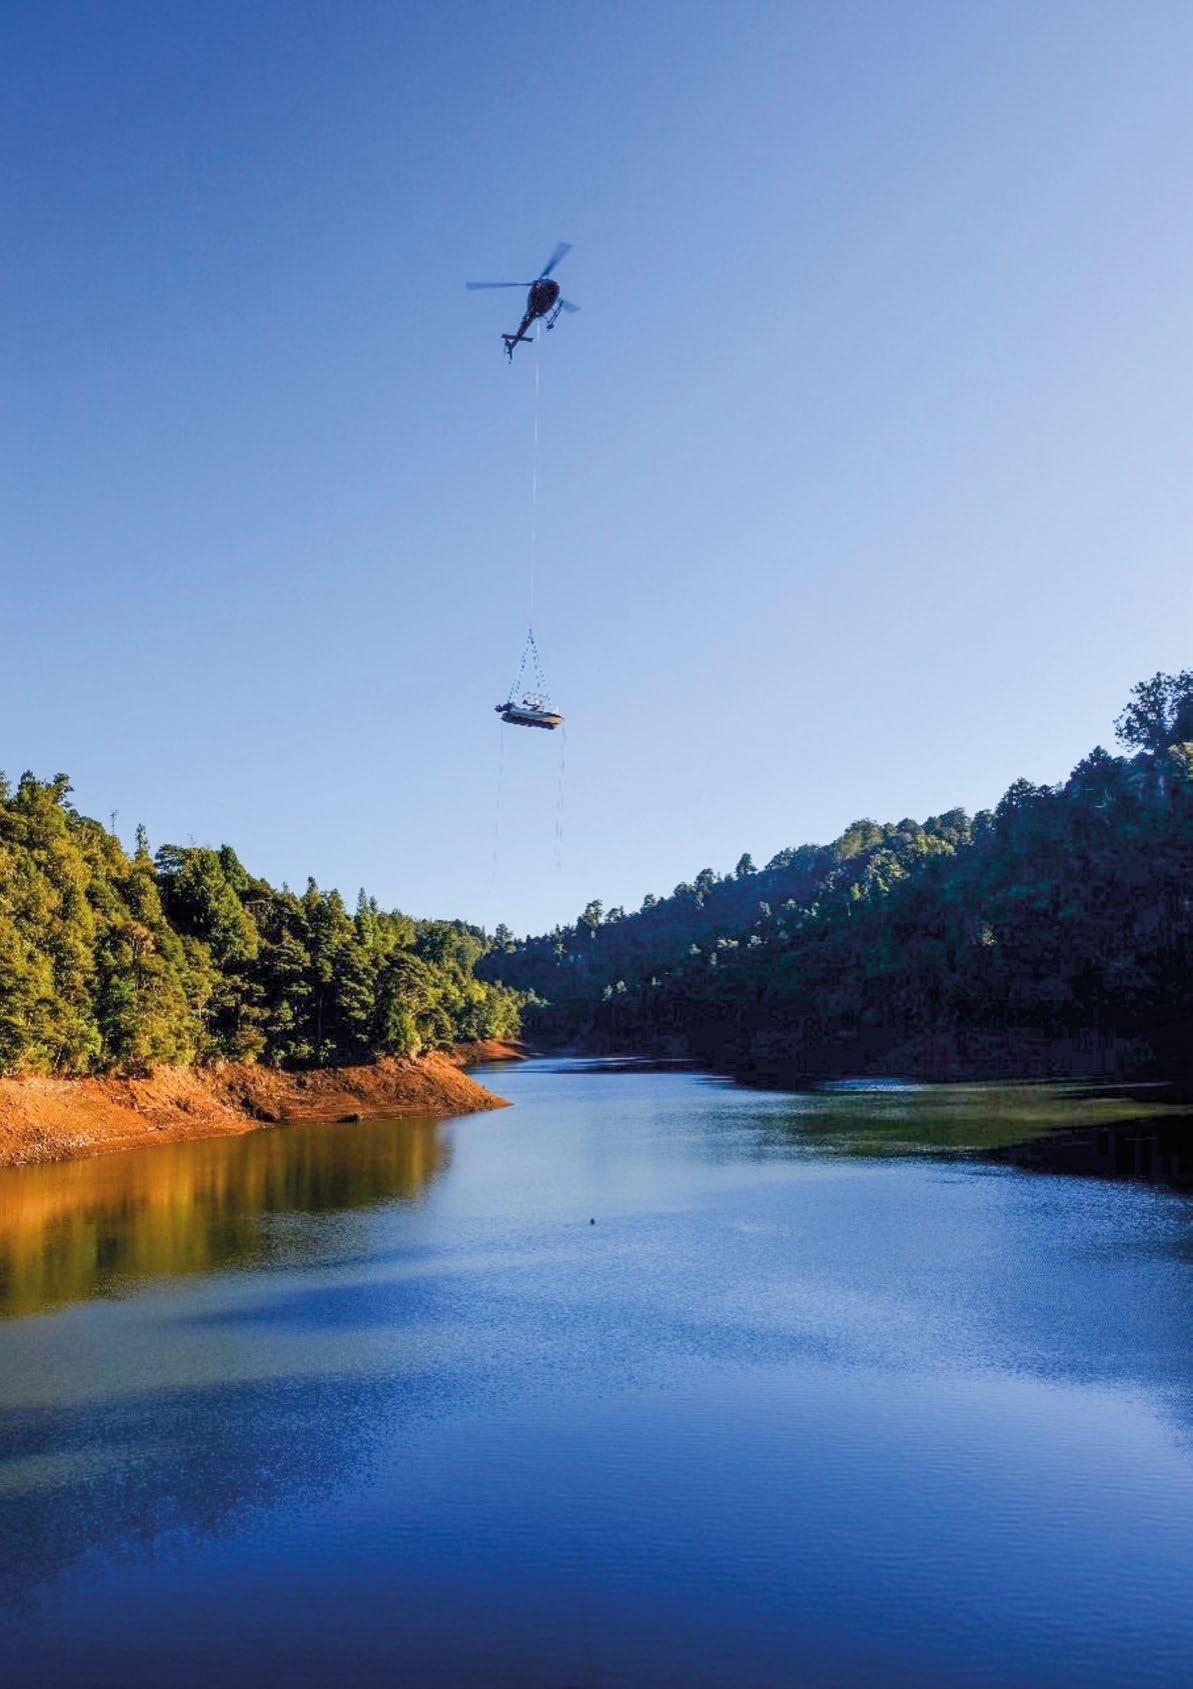
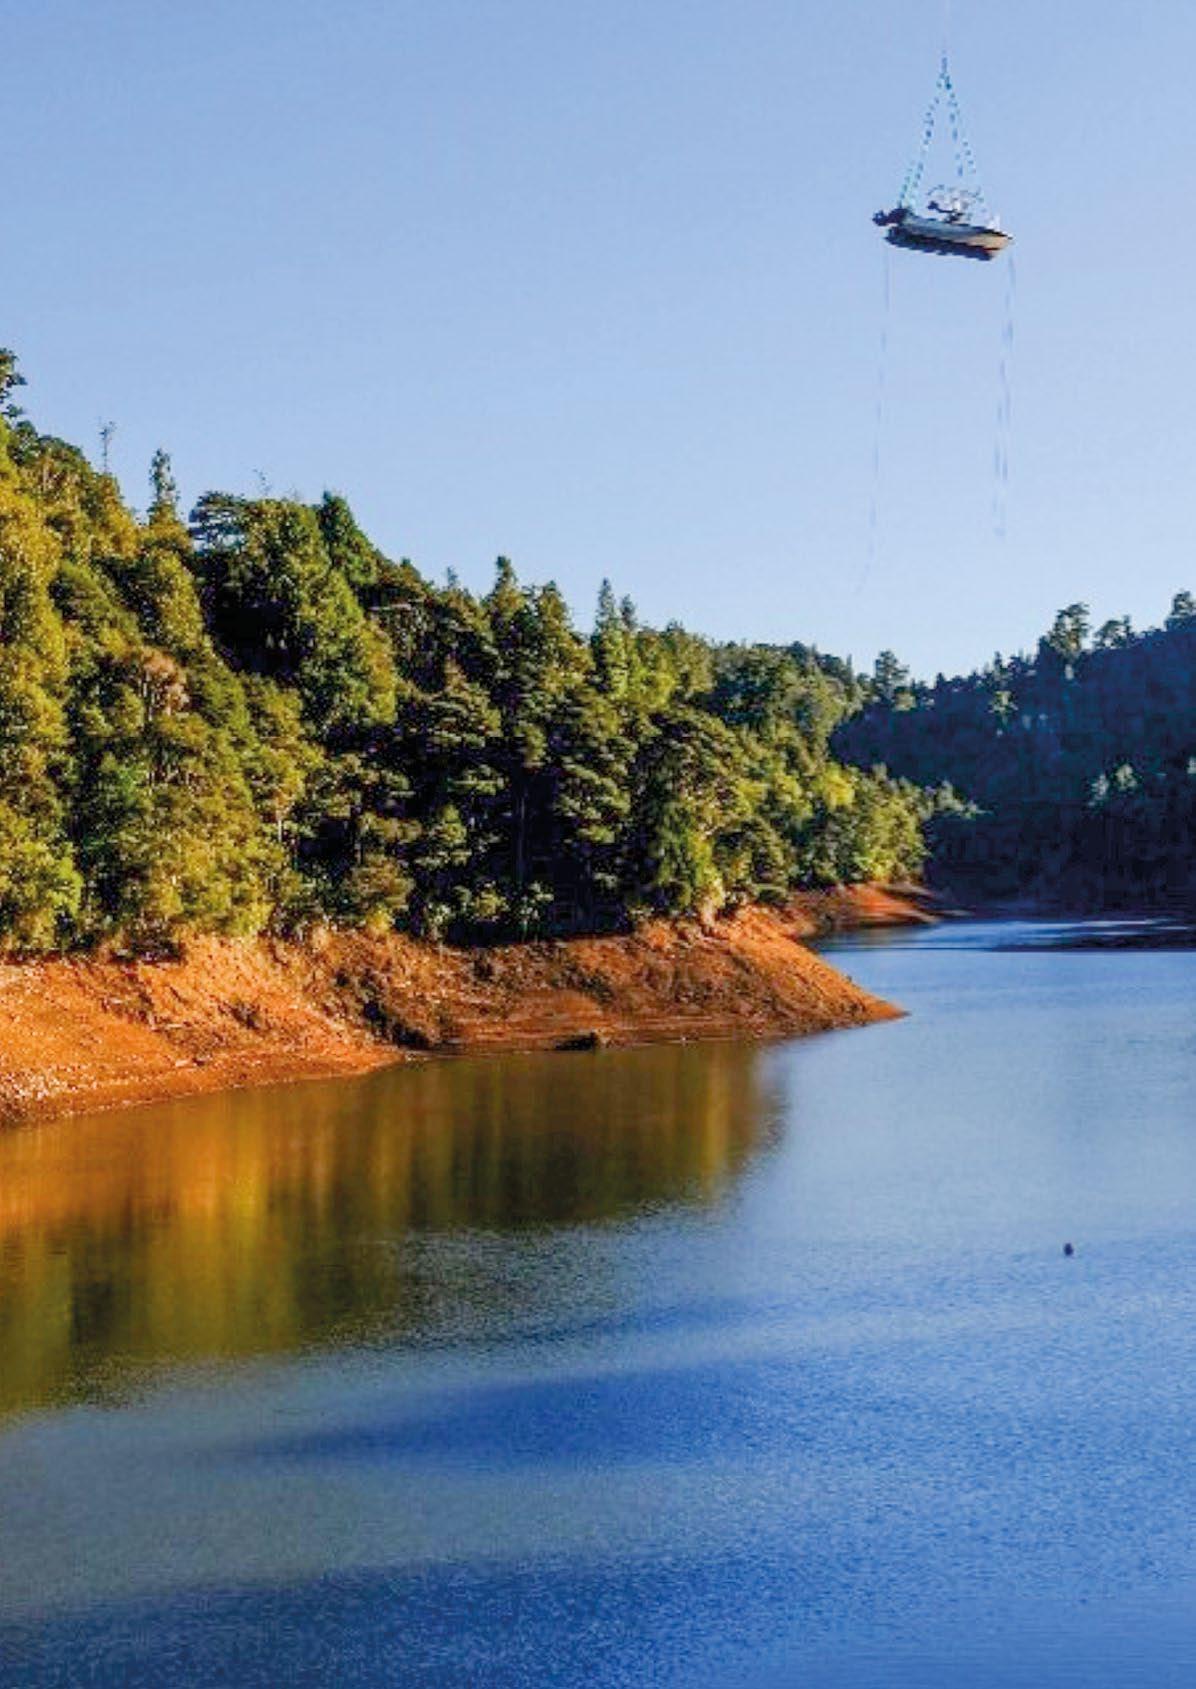
Figure 3: PIPER approaching the Upper Nihotupu Dam. Discovery Marine Ltd (DML) was contracted to complete a multibeam echosounder (MBES) and mobile laser scanner (MLS) survey of three of Watercare’s reservoirs within the Waitakere Regional Park to the west of Auckland. The outcome of the mapping was to provide
Watercare with a volume curve at 1mm intervals for each reservoir, and to provide a baseline data set from which to monitor sedimentation in the reservoirs. Early reconnaissance
Figure 1: The location of the surveyed dams in the Waitakere Regional Park.
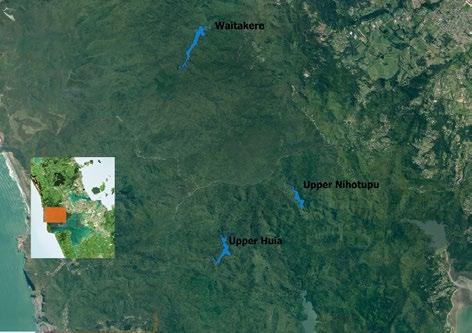
missions established that while the Waitakere Dam had a small (yet challenging) boat ramp, the Upper Huia and Upper Nihotupu dam had no practical boat ramps and limited vehicle access to the dam face. The maximum depth and clarity of the water within the dams meant that a bathymetric LiDAR system would not be effective, so the next best solution was to use a helicopter to lift our survey vessel into the dams.
Using a helicopter to transport a vessel was a first for DML and this resulted in a series of new challenges to overcome. We opted to use one of our smaller vessels, PIPER, a 4.4m Fish City alloy vessel operated under MNZ MOSS. PIPER required a visit to our local marine fabricator/engineer to have four lifting lugs installed to facilitate the lift. When queried on the strength of the lugs and his welds, the engineer confidently informed us “the vessel will break in half before the lugs come off” – this comment was not quite as comforting as I think he intended!
PIPER had not been mobilised with a full MBES system before and for the first time was equipped with a R2Sonic 2022 MBES and Velodyne Puck VLP 16 MLS. An Applanix PosMV system was used to supply position and motion information to both the MBES and MLS. A laptop running QPS Qinsy acquisition software was used to quality control all incoming data in real time and to ensure all data was being recorded correctly. Traditionally larger vessels are used for MBES surveys due to the number of sensors, equipment and computers required. A considerable amount of survey Tetris and computer cable spaghetti occurred to get everything to fit on PIPER.
The survey spread added a substantial amount of weight to the vessel, a trip to the local refuse weigh station showed that (less the weight of the trailer) we were only 50kg shy of the 800kg maximum lift of the Airbus B2 Squirrel helicopter.
Woods and Partners Consultants Ltd was subcontracted to accurately survey the dam structure and spillway level using a total station and terrestrial laser scanner. At the Upper Nihotupu Dam, Woods was able to provide additional survey data in the upper reaches where PIPER could not safely operate.
As the date of the survey approached, the weather conspired against us and the helicopter lift was pushed back a week; this did give us the opportunity to survey the Waitakere Dam using the small boat ramp. This was essentially used as a full shake-down of all the survey equipment and systems, with the fall back of simply being able to pull the boat back onto the trailer should something go wrong (a luxury we would not have at the other two dams). Fortunately, there were no survey system issues at Waitakere, however as expected, we faced some challenges launching and recovering the vessel from the steep and narrow boat ramp. A few choice words were uttered as we struggled to get PIPER back on the trailer in fading light, and all agreed we would just use the helicopter should there be a next time.
The weather cleared the following week and we prepared to survey the remaining dams. Watercare’s depot at the Lower Nihotupu dam was used as a staging post and where the initial lift would take place. PIPER would be flown from the depot to survey the Upper Huia Dam and left in the dam overnight. The next day it would be taken from Upper Huia to survey Upper Nihotupu and also left there overnight. Finally, with all surveying

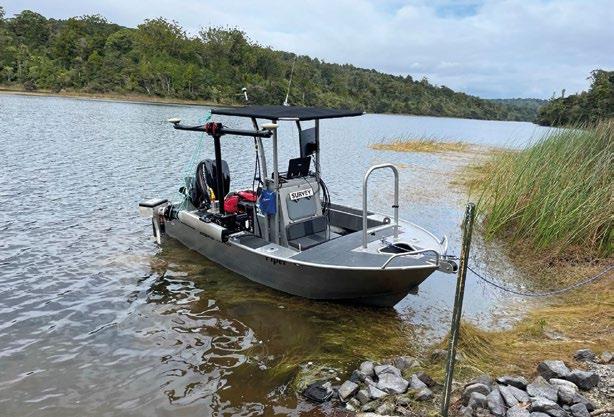
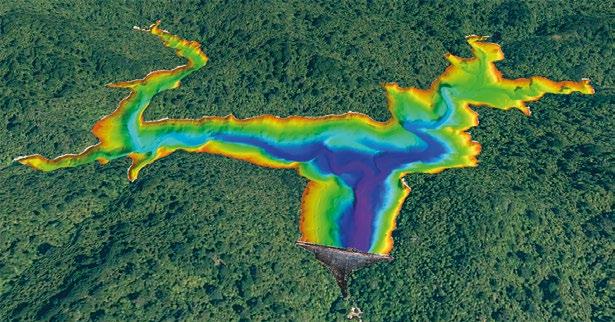
Figure 4: MBES and MLS data at the Upper Huia Dam.
and checks completed, the vessel would be lifted back to the depot. The rugged nature of the surrounding hills of the Waitakere Ranges meant that although each flight would only take around six minutes, driving the work ute full of shore-based equipment between the dams could take upwards of 50 minutes. A team of at least three people at both ends were required to ensure that PIPER was lifted and landed safely.
It was a very odd sight to see a boat flying over the Waitakere Ranges to be dunked into the dams like a giant tea bag. The team at Heletranz were incredibly professional and managed to place PIPER right next to the bank for retrieval. The Heletranz team showed great interest in the job, which was far from their usual fare of lifting spa pools, air-conditioning units or ferrying people to Waiheke Island.
With PIPER successfully deployed in the dams, the surveying could begin. An RTK base station was set up on existing dam survey control. MBES data was first acquired starting at the deeper and easier to navigate sections, gradually progressing closer to the shallower shoreline. The MBES was physically rotated 30° away from nadir to focus on covering the bank more effectively. Unfortunately, the dam levels had decreased significantly since the reconnaissance missions, exposing submerged trees and stumps that had to be avoided with care.
MLS was conducted upon completion of the MBES operations. The MBES was raised out of the water to allow the vessel to navigate safely into shore and maximise coverage and accuracy. The low water level also exposed large mud banks, which presented an excellent target for the MLS.
All lifts were conducted without a hitch and the pilot was even game to try to land the vessel directly onto the trailer when finished (we thought the risk to the survey gear was too high and opted to land it on the ground then winch it onto the trailer).
Data post-processing was conducted in QPS Qimera MBES processing software where the acquired point cloud data could be reviewed and cleaned. Sediment, weeds and even fish (eels in this case) can cause erroneous soundings that have to be removed to generate an accurate model of the dam. The MLS data was also processed and cleaned in Qimera with vegetation and unnecessary structures above the maximum water line of the dam removed. Woods supplied a ground thinned LiDAR dataset that was added where required to the final data surface. Individual datasets were then combined to create one complete surface of the dam. Watercare required volumes calculated at each millimetre level of the dam. Upper Nihotupu was the deepest with 39.7m from the dam crest to the deepest point, followed by Upper Huia (30.1m) and Waitakere (19.1m).
DML had previously conducted a survey of the Upper Nihotupu and Waitakere Dams in 1999 using a single beam echo sounder (SBES). SBES relies on a repeating single ping of sound projected at nadir to record a transect of water depths. The beam footprint of a typical SBES system is often around 10° which equates to a roughly 4.8m footprint at 20m water depth. By comparison, a single ping from a MBES system projects a wide swath of sound (in this case 3 x water depth) which is split into 1° beam footprints and digitised into hundreds


Figure 5: SBES beam width effect.
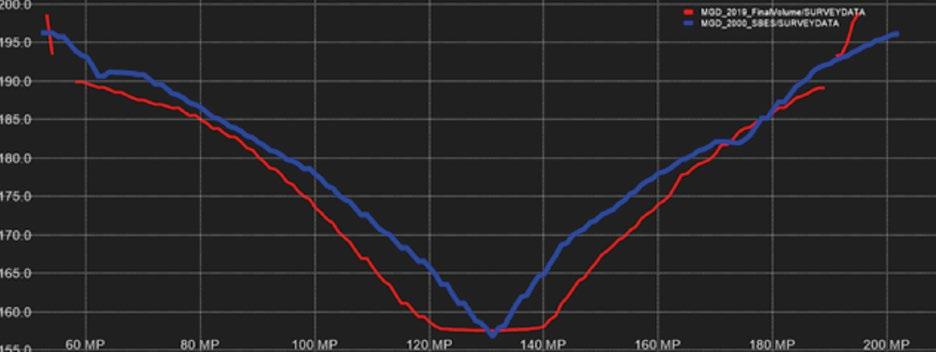
Figure 6: Cross-section showing MBES v SBES.
of water depths from a single ping to create a detailed 3d point cloud of the seabed.
A limitation of SBES in this environment is that it utilises the range (depth) of the first return from a pulse of sound, which can result in considerable horizontal positioning errors when surveying steep banks, as shown in Figure 5 . Figure 6 demonstrates how SBES (in blue) struggles to the define the steep banks of a dam while the MBES (in red) provides a much more accurate model of the dam and reservoir and shows how much valuable information was gained for Watercare by conducting the survey.
The successful completion of this project was due in no small part to excellent cooperation and coordination between all teams involved. From managing the weather, equipment, and remote survey areas, adaptivity and resourcefulness were key. It was incredibly rewarding to conduct such an exciting and unique survey and to contribute to the complex task of managing Auckland’s drinking water reservoirs. •
(continued from page 19)
where the integration of HMD glasses allow users to create immersive and interactive experiences while conduction complex spatial analyses. The user, in this case, can apply touch-less interaction to manipulate a given 3D scene.5 Other applications of VRGIS have been to understand complex data. In climate modeling, where numerous variables make understanding weather phenomena for given regions an often very complex tax, VRGIS platforms have been considered a way to more easily to visualize complex scientific data in given spatial regions. In applications, the layering of data in a 3D environment allows users to query and look at other relevant information that may indicate a clearer understanding of factors affecting climate.6
The current challenge is to make light and small technologies where VR applications can still be utilized to their full extent while access live and large amounts of data. While there has been progress in this area, bandwidth and data limitations often mean that mobile devices cannot easily display complex, 3D data visuals as easily as many desktop platforms.7 •
REFERENCES: 1. For a general background to VR in GIS, see: Peter F. Fisher & D. Unwin (eds.) (2002) Virtual reality in geography. London ; New York, Taylor & Francis. 2. For more on using and an example of VRGIS for traffic analysis, see: Li, X., Lv, Z., Wang, W., Zhang, B., et al. (2016) WebVRGIS based traffic analysis and visualization system. Advances in Engineering Software. [Online] 93, 1–8. Available from: doi:10.1016/j. advengsoft.2015.11.003. 3. For more on XEarth, see: Li, X., Lv, Z., Hu, J., Zhang, B., et al. (2015) XEarth: A 3D GIS platform for managing massive city information. In: [Online]. June 2015 IEEE. pp. 1–6. Available from: doi:10.1109/CIVEMSA.2015.7158625 [Accessed: 21 August 2017]. 4. An example spatial query approach to VRGIS is given in this paper: Wang, W., Lv, Z., Li, X., Xu, W., et al. (2017) Spatial query based virtual reality GIS analysis platform. Neurocomputing. [Online] Available from: doi:10.1016/j.neucom.2016.06.099 [Accessed: 21 August 2017]. 5. The example application of immersive and interactive VRGIS in teaching geography can be read here: Lv, Z. & Li, X. (2016) Virtual Reality Assistant Technology for Learning Primary Geography. In: Zhiguo Gong, Dickson K. W. Chiu, & Di Zou (eds.). Current Developments in Web Based Learning. [Online]. Cham, Springer International Publishing. pp. 31–40. 6. An discussion of weather and climate data with VR in application with GIS can be found here: Helbig, C., Bauer, H.-S., Rink, K., Wulfmeyer, V., et al. (2014) Concept and workflow for 3D visualization of atmospheric data in a virtual reality environment for analytical approaches. Environmental Earth Sciences. [Online] 72 (10), 3767–3780. 7. For more on the challenges of VR, see: Mekni, M., and Lemieux, A., 2014, “Augmented reality: Applications, challenges and future trends”, In Proceedings of the 13th International Conference on Applied Computer and Applied Computational Science (ACA-COS ‘14), volume 20 of Recent Advances in Computer Engineering Series, pp. 205-215.


