16 minute read
2. Literature review


2.1. A brief overview of South Africa’s contemporary social assistance system
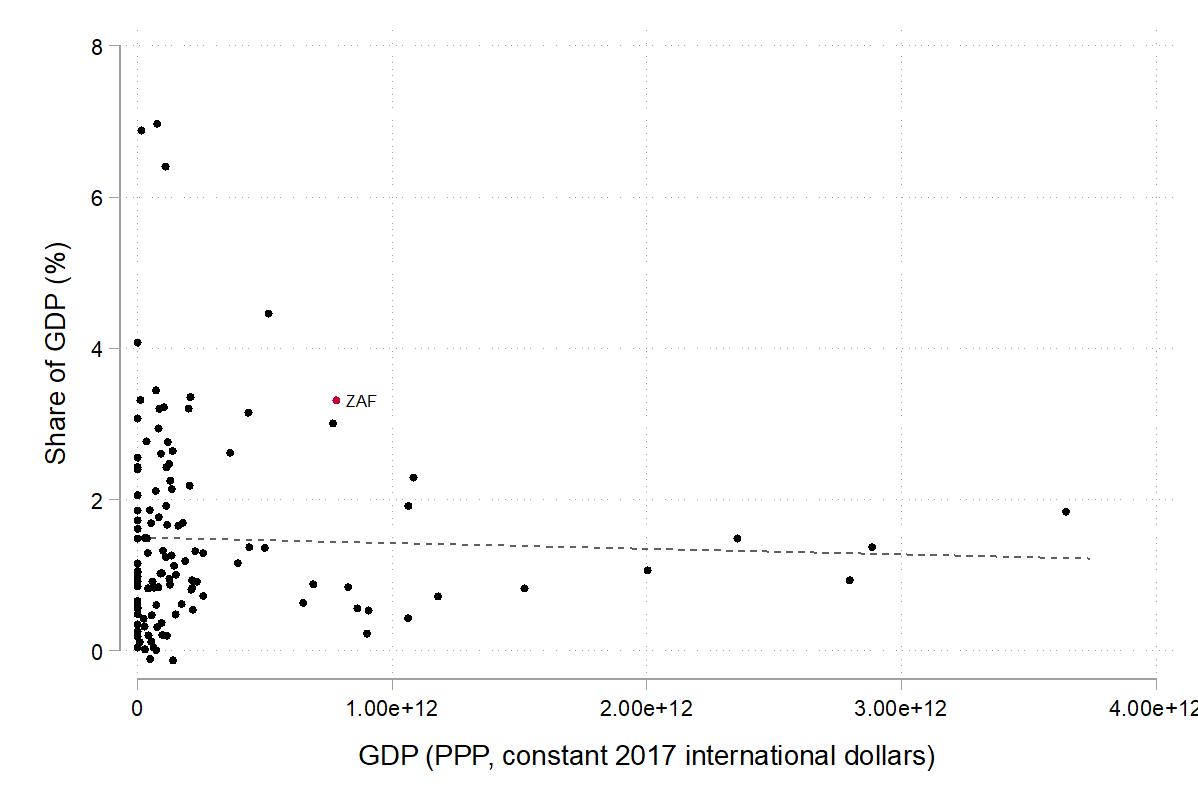
Since democratization, social assistance has expanded significantly with nearly 18 million beneficiaries (or one in every three South Africans) just prior to the COVID-19 pandemic. The country spends a relatively large amount on social assistance given its level of economic development. As shown in Figure 1, which presents an unweighted country-level scatterplot of Gross Domestic Product (GDP) against social assistance expenditure as a share of GDP on a sample of 124 countries for which data is available, South Africa’s social assistance expenditure stood at approximately 3.3% This far exceeds the median spending amount of 1.1% in the sample and 1.4% for countries of a similar level of economic development (upper middle-income countries). Indeed, as indicated by South Africa’s marker relative to the fitted regression line, the country’s level of spending exceeds the predicted level given its level of economic development. However, such spending in South Africa is widely documented to be relatively well-targeted towards the poor, which is largely attributable to the use of means testing as a targeting device (Van der Berg, 2014).The majority of the country’s social assistance spending (over 90%) are tax-financed, unconditional, and means-tested (except for the Foster Care Grant) cash transfers which primarily target vulnerable children, the elderly, and the disabled. These include seven (excluding the COVID-19 SRD grant) such transfers: the Child Support Grant (CSG), Older Person’s Grant (OPG), War Veteran’s’ Grant (WVG), Disability Grant (DG), Foster Care Grant (FCG), Care Dependency Grant (CDG), and the Grant-in-Aid (GIA).
Source: Authors’ own presentation. Reproduced with permission from World Bank (2021).
Notes: This figure presents a scatterplot of government expenditure on social assistance as a share of GDP and GDP across 124 countries for which there is data. Most recent estimates for 2009-2016 used. China and India omitted as outliers for visualisation brevity, but their inclusion does not affect the predicted relationship. Red marker = South Africa. Line represents linear relationship obtained through an unweighted bivariate linear regression. Shaded region represents confidence interval.
Prior to the pandemic, the CSG represented the largest grant in the system in terms of number of grants distributed, accounting for 71% (nearly 13 million) of total grants distributed in 2019-2020. As of the end of June 2020, more than three in every five children (64.2%) in South Africa had a caregiver receive a CSG on their behalf. The grant’s large take-up is largely attributable to gradual increases in the age eligibility threshold and a less stringent means test. The overwhelming majority of CSG recipients (and every other grant type with the exception of the WVG) are women. As of the end of June 2020, of the 7.2 million CSG recipients (not beneficiaries), just 166 000 (or 2.3%) were men (SASSA, 2020). The OPG and the DG – the only grant intended for working-age adults until the introduction of the COVID-19 SRD grant – represent the second and third largest grants collectively accounting for more than one in every four recipients. More than one in every two South Africans live in a household that receives income from either the CSG or OPG (Bassier et al., 2021). Although both the OPG and DG are means-tested, the benefits are more than four times larger than the CSG.
Despite the relatively comprehensive reach of South Africa’s social safety net through social grants, prior to the pandemic the working-age population were not covered by any social grant with the exception of the DG as stated above. In this light, the introduction of the COVID-19 SRD grant played an important role in filling this gap through targeting the working-aged unemployed population.
2.2. The introduction and evolution of the COVID-19 Social Relief of Distress grant
Following the onset of the pandemic, the South African government quickly implemented a national lockdown on 27 March 2020. This initial lockdown lasted approximately five weeks and prohibited all non-essential activity outside the home. It entailed the closure of all schools, a curfew, domestic and international travel restrictions, a prohibition of the sale of alcohol and tobacco products, and only workers in occupations deemed essential for economic function and pandemic response were permitted to work at their usual workplace. Given these characteristics, Gustaffson (2020) shows that this initial lockdown was relatively stringent by international standards. Thereafter, the government adopted a five-level risk-adjusted lockdown strategy which implemented regulations according to the severity of contagion. In May 2020 the country moved to the less stringent ‘lockdown level 4’ which permitted a limited amount of social and economic activity to resume and thereafter lockdown stringency varied as the pandemic progressed. After being in place for approximately two years, this strategy was repealed in April 2022 along with most remaining pandemic-related policy restrictions.
As in many other countries, in response to the pandemic the government introduced a package of targeted economic relief measures to support firms, workers, and households partially by using a combination of existing and new social protection programmes. In particular, the social assistance system was expanded at both the intensive (or vertical) and extensive (or horizontal) margins through a largely cash-based approach. Announced on 21 April 2020, from May to October 2020 the value of every 1 existing cash transfer (or social grant) was increased and a new grant was introduced: the COVID-19 SRD grant. This latter grant, equivalent to ZAR350 per month (approximately US$50 in Purchasing Power Parity (PPP) terms), targeted support to a large group of individuals previously unreached by the system: the unemployed adult population (equivalent to about 10 million people as of the beginning of 2020 2). Specifically, individuals were eligible for the grant if they were between 18 and 59 years old, unemployed, and were neither receiving (nor eligible to receive) any other social grant, unemployment insurance benefits, or other forms of government support or income, and were not residing in a government-funded or subsidised institution. The COVID-19 SRD grant is distinct in South Africa’s cash transfer system given that it was the first to provide support to unemployed adults for their own benefit. Initially, the grant was conceptualised to target informally employed adults not receiving any social grants, which was not followed through due to concerns surrounding inclusion errors (Bassier et al., 2021)
1 Except for the GIA, which is a supplementary cash transfer offered to recipients of other cash transfers (either a disability grant, war veteran’s grant, or older person’s grant) who cannot care for themselves to pay the person who takes care of them.
All applications for the grant were done electronically through one of multiple platforms 3 , and payments were made into recipient bank accounts or, for the unbanked, through either mobile money transfers or physically at the South African Post Office and later at certain retail outlets.
In Figure 2 we plot the absolute and relative distribution of cash transfers in South Africa by grant type from just prior to than pandemic in 2020 to May 2022. Despite initial payment delays owing to the setting up of relevant processes and systems and issues which SASSA experienced in gaining access to the correct databases from other state organisations for verification purposes (Auditor-General, 2020), the introduction of the COVID-19 SRD grant resulted in an initial expansion of the system by over 4 million previously unreached recipients – exceeding the growth of the system in the prior decade (Baskaran et al., 2020). Later in 2020 the grant was extended to April 2021 during which the reach of the grant exceed 6 million, representing approximately a quarter of all social grants distributed. During this period, it is believed that the eligibility criterion that the grant could not be held concurrently with any other social grant resulted in an unfair exclusion of many women, considering that women represent the majority of social grant recipients (85 percent as of December 2020) and the minority of employed (43 percent as of the last quarter of 2020 4) (Casale and Shepherd, 2022). Indeed, only approximately 30 percent of COVID-19 SRD recipients during this period were women (Gronbach et al., 2022).
2 Own calculations using microdata from Statistics South Africa’s Quarterly Labour Force Survey for the first quarter of 2020.
3 This includes a dedicated website, a messaging application (WhatsApp), USSD (Unstructured Supplementary Service Data, or text messaging), a call centre, or email.
4 Own calculations using microdata from Statistics South Africa’s Quarterly Labour Force Survey for the fourth quarter of 2020.
Source: Authors’ own calculations. SASSA (2021; 2022).
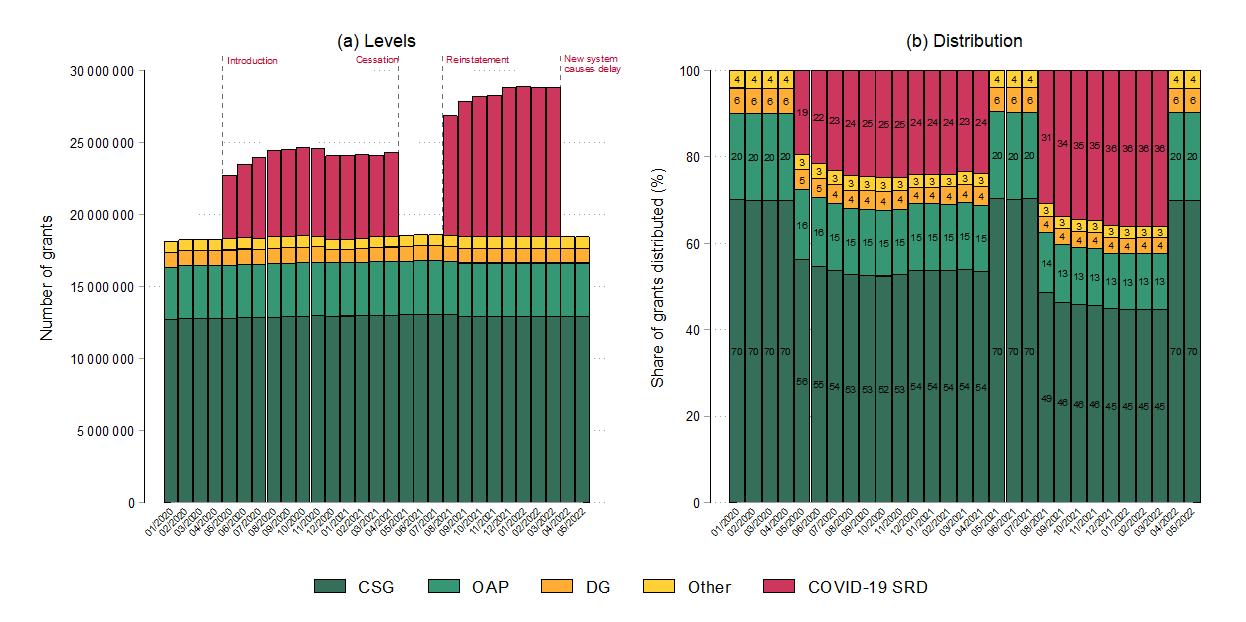
Notes: This figure shows the number of social grants distributed per month by grant type, not the number of recipients given that eligible individuals could receive multiple grants at once. Number of COVID-19 Social Relief of Distress (SRD) grants paid for, but not in, a given month shown – there are discrepancies between the two given payment delays. CSG = Child Support Grant; OAP = Old Age Pension; DG = Disability Grant; Other includes Foster Care Grant, Care Dependency Grant, Grant-in-Aid, and War Veteran’s Grant.
Three months after the first cycle of the grant ended, in July 2021 the President announced that the grant would be re-instated until March 2022 in response to a resurgence of COVID19 infections and corresponding lockdown measures as well as a wave of social unrest in parts of the country. Additionally, the grant was expanded to allow unemployed adults who receive the CSG on behalf of their eligible child(ren) to apply. This change in eligibly criteria had a considerable effect on both the level and gender composition of the grant’s recipients. As shown in Figure 2, by the end of 2021 the grant reached over 10 million people, and the majority of applicants were now women (57 percent) (SASSA, 2022)
In February 2022, the President announced a further extension of the grant to March 2023, but emphasized that any support beyond this date would need to be assessed (Ramaphosa, 2022). This extension was however characterised by payment delays and low approval rates, primarily due to the necessary administrative systems not being in place in time 5 as well as a new eligibility condition: a means test threshold of ZAR350 6 - equivalent to 56 percent of the country’s national statistics office’s extreme poverty line (ZAR624). 7However, in July 2022 the government issued proposed amendments which, among others, included raising the means test threshold to this poverty line. At the time of writing, the grant had been further extended to March 2024 with no clear decision on whether it would be integrated permanently into the system. Finally, it should be noted that since its inception in 2020, the grant amount has remained unchanged in nominal terms at ZAR350, which adjusted for inflation is equivalent to approximately ZAR310 in June 2022 Rands. 8
2.3. Existing empirical literature on the COVID-19 Social Relief of Distress grant
In this section we summarise the existing empirical literature on the COVID-19 SRD grant Specifically, we consider studies which have sought to analyse the coverage and distribution of the grant, as well as its (simulated) effects on welfare; namely household incomes and poverty.
Several studies have made use of representative, longitudinal survey data collected during the first year of the pandemic in South Africa – the NIDS-CRAM – to analyse how the grant has been distributed across different groups of individuals and over time. Köhler and Bhorat (2020) show that application for and receipt of the grant was relatively pro-poor. For instance for every individual who lived in quintile 5 households and received the grant in June 2020, nearly four who lived in quintile 1 households received it. Close to 90% of individuals in the former group have never applied. In line with this suggestive progressivity, Visagie and Turok (2022) show that households in typically poorer areas (townships, shack dwellers, and peri-urban areas) were more significantly likely to receive the grant relative to their more affluent counterparts (suburbs), and van der Berg et al. (2022) highlight a link between the temporary cessation of the grant in 2021 and household hunger. Other studies have also considered the notably uneven distribution of receipt by gender, and how such differences persisted over time, largely due to the aforementioned eligibility criteria in the grant’s initial phase (Köhler and Bhorat, 2020; Casale and Shepherd, 2022). Regarding targeting, Bhorat and Köhler (2021) show that the grant was relatively well-targeted with most recipients being non-employed, and specifically, holding a range of observable characteristics constant, they find that the chronically non-employed were 51 percent more likely to receive the grant relative to other groups.
5 Specifically, because the grant was initially promulgated under the Disaster Management Act which were repealed in April 2022, it became necessary to make provisions to the existing Social Assistance Act for the grant to remain available. All existing recipients then needed to re-apply for the grant, and new conditions for application were only announced at the end of April 2022.
6 A means test did previously exist for the grant from August 2020, but only for appeal cases for rejected applications (Gronbach et al., 2022).
7 As set out by Statistics South Africa (2021a), the latest at the time of writing (2021) national poverty lines (per person per month) are as follows in April 2021 prices: Food Poverty Line (also referred to as the “extreme poverty line”) (ZAR624); the lower-bound poverty line (ZAR890); and the upper-bound poverty line (ZAR1 335).
8 Own calculations using Statistics South Africa’s Consumer Price Index data (Statistics South Africa, 2022).
Several studies consider the grant’s effects on welfare. Bassier et al. (2021) use prepandemic nationally representative South African household survey data from 2017 to simulate how the negative economic shock of the pandemic, through a 75 percent 9 reduction in earnings, can be mitigated by different social grant interventions, with a particular focus on informal workers and their households. These interventions include a grant like the COVID-19 SRD grant, except the eligibility criteria is slightly different 10 and the grant value is over 50 percent higher (ZAR526 per month) than the realized policy. 11 They find that the simulated lockdown effect reduces per capita household incomes of informal sector workers by about 30 percent across most of the household income distribution in the absence of any grant intervention. However, after incorporating COVID-19 SRD grant income, they find that this 30 percent reduction is decreased to a reduction between 3 - 20 percent across most of the distribution. Considering poverty effects, their simulated pandemic effect increases extreme poverty 12 from 12.8 to 28.4 percent for informal worker households, but the COVID-19 SRD grant income mitigates this increase to just 16.6 percent. Given that the value of the grant used in this study is substantially higher than that realized, these simulated effects are likely overestimated to some extent.
Bhorat et al. (2021) conduct a similar empirical exercise using the same data, however they compare outcomes using the realized policy (the top-up’s to existing grants as well as the introduction of the COVID-19 SRD grant) to alternative policy scenarios such as a simple ZAR500 top-up of the CSG. The authors simulate that, while the chosen policy package leads to a similar degree of poverty reduction compared to the CSG top-up, and the COVID-19 SRD grant is less progressive than the CSG top-up, the grant’s key advantage is its ability to provide support to a large group of vulnerable individuals and households who otherwise would not be covered and may be amongst the most negatively affected by South Africa’s lockdown. This is in line with Bassier et al.’s (2021) analysis which also simulates that a CSG top-up results in more progressive poverty-alleviating effects but at the expense of an expansion of the system’s reach.
9 The choice of 75 percent in this study was based on conjecture rather than an actual estimate.
10 The authors define a recipient as some aged 18 – 59 years who is not formally employed and not receiving any other social grant.
11 The reason why this study employed different characteristics to the COVID-19 grant compared to reality was presumably because at the time of this analysis, the COVID-19 grant was yet to be introduced.
12 Using Statistics South Africa’s 2017 extreme poverty line (also known as the food poverty line).
Both Bassier et al. (2021) and Bhorat et al. (2021) make use of pre-pandemic data to arrive at their results, but the results pertaining to poverty reduction hold when data collected during the pandemic is alternatively used. Using a tax–benefit microsimulation model and both pre-pandemic data and the NIDS-CRAM, Barnes et al. (2021) examine the effects of the pandemic on household incomes, poverty, and inequality in South Africa during the first wave of infections from April to June 2020. Their simulation suggests that a decline in earnings would have caused a 25 percent decline in disposable income on average, however the overall reduction was much smaller at 11 percent primarily due to the realized policy package, including the COVID-19 SRD grant. In a recent study, Bassier et al. (2022) update pre-pandemic household income data using pandemic-era labour market data (which lacks income data) to provide contemporary estimates of poverty during 2020 and 2021 in South Africa, while also simulating the poverty-reducing effect of the COVID-19 SRD grant. 13 They find that in the absence of the grant, the headcount poverty ratio 14 increased by 3 – 5.2 percentage points between the first quarter of 2020 and the last quarter of 2021, but after incorporating receipt of the COVID-19 SRD grant, this increase is reduced to 1.1 –3.4 percentage points. This is in line with Bhorat and Köhler’s (2021) simulation which uses the NIDS-CRAM data and suggests that in the absence of the COVID-19 SRD grant extreme poverty would have been at least 5 percent higher. Overall, although their results should be interpreted as purely descriptive and approximate, these studies together provide suggestive evidence on the positive welfare effects of the COVID-19 SRD grant.
13 The main idea of the authors’ approach is the changing of individual employment statuses in pre-pandemic data to match employment effects evident in the pandemic-era data, and then applying the relevant changes in incomes. The assumptions and limitations of this approach are discussed extensively in the paper.
14 Using Statistics South Africa’s upper-bound poverty line.
3. Data
Our analysis here makes use of nationally representative, longitudinal, individual-level household survey data from Statistics South Africa’s (StatsSA) Quarterly Labour Force Survey (QLFS) collected in 2020 and 2021. Specifically, we use data for all four quarters of 2020 and the first quarter of 2021 (henceforth 2021Q1) for reasons outlined in Section 4 below. Conducted since 2008, the QLFS contains detailed information on a wide array of demographic and socioeconomic characteristics and labour market activities for individuals aged 15 years and older and serves as South Africa’s official source of labour market statistics. More information on the survey’s design is available via Statistics South Africa (2008).
Prior to the onset of the COVID-19 pandemic, data was collected via face-to-face interviews from a sample of nearly 70 000 individuals in approximately 30 000 dwelling units per wave. However, following its onset, StatsSA suspended face-to-face data collection and changed the survey mode to computer-assisted telephone interviewing (CATI). To facilitate this transition, the sample that was surveyed in 2020Q1 for which StatsSA had contact numbers for were surveyed again for the remaining quarters of 2020 as well as 2021Q1 Thereafter, the easing of COVID-19-related restrictions resulted in sample rotation to resume. Because only households with valid contact numbers could be surveyed during this period, this sampling decision resulted in a reduction in the sample to approximately 70 percent of its prepandemic size. Given concerns of unrepresentative population estimates stemming from potential sample selection bias, StatsSA adjusted the calibrated survey weights using a bias-adjustment procedure which relied on a vector of observable characteristics (Statistics South Africa, 2020e). Although respondents may still be unobservably different from non-respondents, the weighted population estimates for the pandemic period do appear plausible (Köhler et al., forthcoming). 15 Throughout our analysis, we employ these sampling weights which account for original selection probabilities and non-response and are benchmarked to known population estimates of the entire civilian population of South Africa. Additionally, the above sampling decision resulted in the survey changing from being cross-sectional with a rotational panel element to an (unbalanced) longitudinal survey – a unique scenario in the survey’s history. This panel aspect of the data is key to our identification strategy outlined in more detail below in Section 4.
15 At the time of writing, an explicit review of this adjustment procedure of the sampling weights had yet to be conducted and would require more information than is available in the public documentation.
Our analysis is based on the unbalanced panel of individuals observed across the five waves of data. To identify the panel sample, we make use of household and person identifiers in the data as well as information on age, gender, and self-reported racial population group to ensure that we observe the same individual over time. 16 We allow for a one-year difference in age in either direction to account for ageing or possible measurement error. We omit all observations that exhibit an inconsistency in any of these characteristics. Furthermore, for identification reasons outlined in Section 4 below, we restrict the sample to adults aged 18 to 59 years who did not receive any unemployment benefits or other social grants (apart from the COVID-19 SRD grant). This procedure results in an unbalanced panel sample of over 52 000 observations
Source: QLFS 2020Q1 - 2020Q4 and 2021Q1 (StatsSA, 2020a; 2020b; 2020c; 2020d; 2021b). Authors’ own calculations.
Notes: This table presents sample sizes before and after the primary and secondary sample restrictions UI = unemployment insurance.
Despite the magnitude of the sample size reduction, we find that these sample restrictions do not significantly affect the composition of our sample In Table 2 we present weighted mean estimates of several observable covariates at baseline (2020Q1) for our treatment and control groups described below in Section 4 before and after the sample restrictions. Before the restrictions, COVID-19 SRD grant recipients were slightly more likely to be older and African/Black and less likely to be women, married, live in an urban area, and have a tertiary education level relative to non-recipients. After the restrictions, the signs of all covariate-specific differences remain, and their magnitudes are largely similar with few exceptions. Relative to before the restrictions, recipients in the restricted sample are now even less likely to be female and married, while non-recipients are even more likely to be African/Black and live in urban areas. Both recipients and non-recipients now exhibit statistically similar mean ages of approximately 31 years. These differences in baseline levels, however, are not a concern to the validity of our identification strategy given that, in a DiD design, groups are not required to have similar baseline means in outcomes or covariates, but rather these differences should be stable from before to after treatment (Daw and Hatfield, 2018; Wing et al., 2018). We investigate whether this parallel trends assumption holds, later in the paper.
16 The anonymity of the data prohibits us from accessing other identifying variables of respondents such as names and surnames.
Table 2. Covariate balance before and after sample adjustments at baseline
Source: QLFS 2020Q1 - 2020Q4 and 2021Q1 (StatsSA, 2020a; 2020b; 2020c; 2020d; 2021b). Authors’ own calculations.
Notes: This table presents estimates of mean values for observable covariates in the baseline period (2020Q1) for the treatment and control groups accompanied by difference estimates, separately for two samples: the sample before any sample restrictions are made and the sample thereafter. Treatment defined as receipt of the COVID-19 SRD grant (as identified by the ‘other’ grant in the data) in the post-treatment period. All estimates are weighted using sampling weights. Standard errors presented in parentheses and are clustered at the individual level. The magnitude and statistical significance of a given difference are estimated using t-tests. *** p < 0.01, ** p < 0.05, * p < 0.10. At baseline, the treatment subsample consists of 2 627 and 1 488 observations before and after sample restrictions, respectively, while the control subsample consists of 64 030 and 11 823 before and after sample restrictions, respectively.

