
Credits
Authors: Dr. Heidi Guille, Caitlin Gilmour, Dr. Edward Willsteed
Suggested citation: Guille, H., Gilmour, C., Willsteed, E. 2021. UK Fisheries Audit. Report produced by Macalister Elliott and Partners Ltd. for Oceana. Lymington, UK. 116 pp.
DOI number: 10.5281/zenodo.4384177
Review and editorial: Oceana
Design: TASON
Photos and illustrations: All photos are © OCEANA unless otherwise specified in the caption. Cover photo: © OCEANA / Juan Cuetos. Species illustrations on page 46 and 47 are © Scandinavian Fishing Year Book
The information contained in this report may be reproduced as far as authors and title of the report are mentioned as source.
UK Fisheries Audit

Table of Contents Executive Summary 6 1. Introduction to the UK Fisheries Audit 10 1.1 Objectives of the report 12 1.2 Report structure 12 2. Management of fisheries in UK waters 14 2.1 Key observations 15 2.2 Legal framework for fisheries management decisions 16 2.2.1 EU fisheries management framework under the CFP 16 2.2.2 UK fisheries management framework 18 2.3 Decision making process 20 2.4 Allocation of fishing opportunities in the UK 22 2.5 Where the UK fleet catches fish 24 3. Status of UK fish stocks and UK fishing industry as the UK left the EU 26 3.1 Key observations 27 3.2 Methodology 28 3.2.1 Health of the stocks and exploitation status 28 3.2.2 Socio-economic statistics 29 3.3 Results 30 3.3.1 Stock status overview 30 3.3.2 Composition and distribution of UK landings 33 3.3.3 Overview of socio-economic characteristics of the UK fishing industry 37 4. Focus stocks 42 4.1 Key observations 42 4.2 Methodology 43 4.3 Results 45 4.3.1 The UK’s Top 10 45 4.3.2 Best performers 55 4.3.3 Worst performers 58 4.3.4 Concerned about cod? 61
5. Environmental impact case studies 70 5.1 Case study: Advised versus prescribed TACs 70 5.2 Case study: Trade-offs in mixed fisheries 73 5.3 Case study: Competition between predators – sandeels in the North Sea 78 5.4 Case study: Caught in the net - cetacean bycatch 80 5.5 Case study: Ploughing the seafloor for scallops 84 6. Audit conclusions 88 7. Oceana’s Policy Recommendations 91 7.1 Management of UK domestic fisheries 92 7.2 Management of stocks shared with third countries 94 Appendices 96 Appendix 1 – List of stocks and corresponding management units included in the UK fisheries audit 97 Appendix 2 – Stock and Exploitation status indicator methodology 105 Appendix 3 – Focus stock analysis methodology 107 Appendix 4 – Glossary 108 References 110
Executive Summary
The UK’s decision to leave the EU and to regain control of its waters has considerable implications for the management of North East Atlantic Fisheries. The results derived from the implementation of new UK domestic regulations and international fisheries agreements will have a direct impact on the status of fish stocks and the socio-economic performance of fishing fleets. There is an opportunity and a responsibility for the UK, as an independent coastal state for the first time in over 40 years, to lead the way in achieving sustainable fisheries.
The key objective of this report is to provide an evidence-based snapshot of the status of UK fish stocks and the UK fishing sector’s recent exploitation history of those stocks, by the time the UK abandons the EU fisheries policies. In doing so, the report provides a baseline for future evaluations of the UK’s progress and/or setbacks in sustainable fisheries management.
The turnover of UK fisheries in 2019 was about £1 billion with the majority derived from over 24 metres vessels operating from Scotland. Most of the UK fisheries landings from the North East Atlantic in 2019 (618,000 t) came from UK waters (81% by
6 UK FISHERIES AUDIT 2021
live weight or around 500,000t and 87% by value). Around 27% of EU catches in the North East Atlantic were also typically taken from UK waters between 2012 and 2016, amounting to approximately 700,000 tonnesa
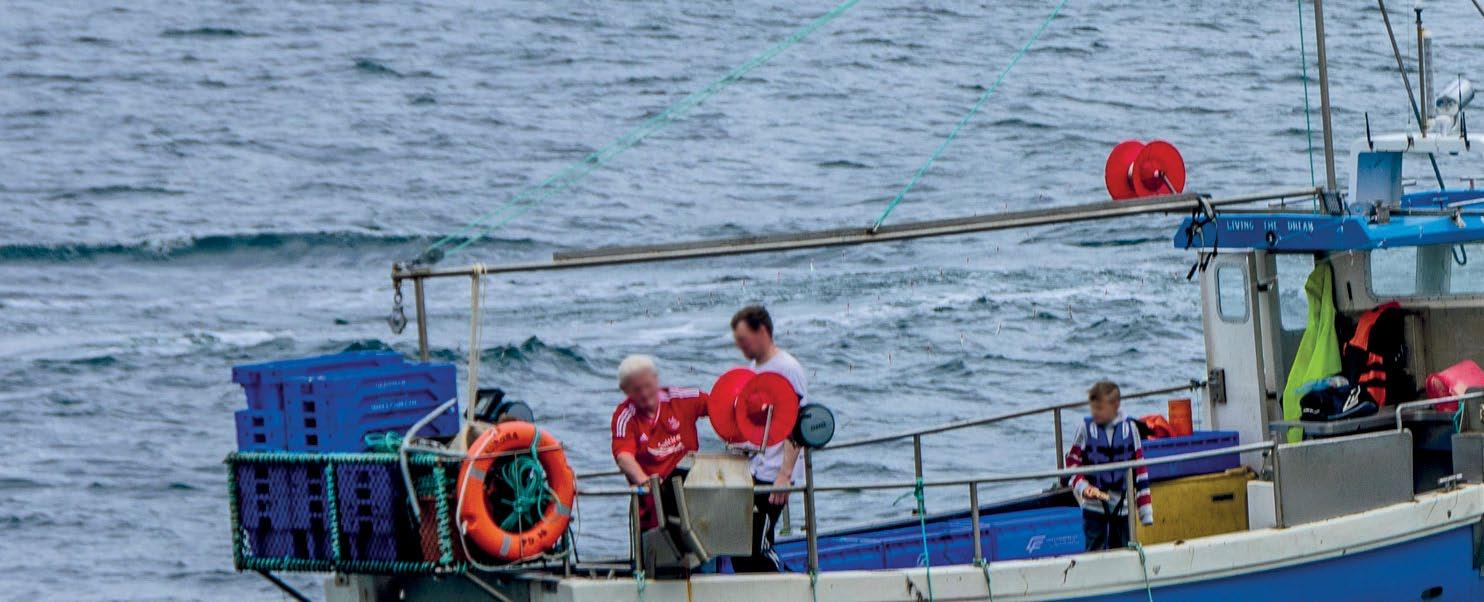
Stocks critical to UK fisheries include quota and nonquota species, with the latter not subject to EU Total Allowable Catches (TACs) – the primary management mechanism for North East Atlantic fisheries. Pelagic quota species such as mackerel and herring caught by over 10 m vessels dominate UK landings by volume (54%). Non-quota shellfish such as scallops and crab are also key contributors (21%), with the remaining 25% comprised of demersal species. Smaller inshore vessels (10 m and under) which dominate the UK fleet by number (74%), rely on non-quota species (shellfish comprise >80% of landings by volume and value).
Of the 104 UK stocks audited, 82 of which are quota stocks shared mainly with the EU, 35.6% were healthy in terms of stock size (43.9% of shared stocks) relative to the MSY reference point Btrigger, whereas 20.2% were in a critical condition (15.9% of shared stocks). Data limitations mean the status of the remaining 44.2% (40.2% of shared stocks) cannot be determined, leaving them at greater risk of unsuitable management decisions.
Analysis of the exploitation status revealed that 37.5% of the audited stocks were sustainably exploited prior to the UK leaving the EU (42.7% of the 82 shared stocks). However, 28.8% were being overfished (25.6% of the shared stocks) (F>FMSY), whilst another 33.6% were data limited and so cannot be adequately assessed (31.7% of shared stocks).
7 UK FISHERIES AUDIT 2021
© OCEANA / Yuri Smishkewych
a Data for the non-UK fleet in UK waters are not available for the period since 2016.
In order that the implications of any management actions or policy decisions by the UK government following Brexit can be considered in greater depth, more detailed benchmarks for a selection of stocks are provided. Those stocks were selected according to their economic status (the ‘top 10’) or their performance: the 5 most sustainably and 5 most unsustainably fished in terms of stock size and fishing mortality rate. Separately, a more detailed examination of the recent exploitation and management history of all the cod stocks fished by the UK is provided given ongoing concerns over the status of this iconic fish species.
Only 3 of the ‘top 10’ were healthy and sustainably exploited (North East Atlantic mackerel, North Sea haddock and West of Scotland Nephrops). Two of the stocks are overexploited and their biomass is below safe biological reference points as a result (North Sea cod, Southern North Sea edible crab). For the remaining stocks there is a mixed picture, including data limitations for North Sea anglerfish (monkfish) and scallops in the English Channel.
The 5 best performing stocks are typically caught in relatively small quantities and are of relatively low value to the UK fishing industry, except for Western English Channel common sole which attracted the highest price per tonne of all the focus stocks. Zero catches have been advised for 3 of the 5 worst performing stocks – Irish Sea whiting and cod in the Celtic Sea and West of Scotland.
The challenges of rebuilding depleted stocks are highlighted by a focus on the cod stocks. North Sea cod is once again subject to emergency management measures. With climate change also likely to be affecting cod’s resilience to fishing mortality, effective recovery plans are needed more urgently than ever. However, because the majority of the cod stocks are primarily caught as bycatch in valuable mixed fisheries, such measures will require a shift in fisheries management priorities.
Lagging full policy implementation and persistent political decisions to set TACs above scientifically advised catch levels are still pending issues for fisheries management, and key contributing factors to the ongoing overfishing of North East Atlantic fish stocks, including Atlantic cod. For the ‘top 10’ and 5 worst performing stocks, the majority of TACs for the period 2016-2020 were set above levels advised by ICES. Conversely, the TACs for the top performing stocks were mainly set at, or commonly below, scientifically advised levels.
The report investigates a number of other specific issues associated with UK fisheries and their management which have negative implications for the environment and sustainable fishing. Potential opportunities for improvements following the UK’s departure from the EU, as well as further risks, are highlighted. For example, the UK has the opportunity to demonstrate better practice by accommodating the
8 UK FISHERIES AUDIT 2021
ecological importance of species when implementing or influencing future management strategies, as highlighted by the implications of overfishing of sandeels for the North Sea fish, cetacean and seabird populations.
In response to the findings of the UK fisheries audit, Oceana sets out policy recommendations for the UK Government. Overarching to these is ensuring sustainable fisheries is the primary goal of the UK’s fisheries policies and plans, in order to fulfil the objectives of the UK Fisheries Act and achieve the
UK government’s aspiration to set ‘a gold standard for sustainable fishing around the world’, as well as meeting UK international biodiversity and sustainability commitments.
© OCEANA / Juan Cuetos
1.Introduction to the UK Fisheries Audit
This report by Macalister Elliott and Partners was commissioned by Oceana as part of its ongoing campaign for sustainable fisheries in Europe, to set a benchmark of the state of UK fisheries as the UK leaves the EU.
The UK left the European Union on 31 January 2020, when it entered a transition period that ended on 31 December and during which the EU fisheries rules still applied. The UK is now developing its own legal framework for fisheries management, including domestic regulations (e.g. UK Fisheries Act¹) and international agreements (like the ones with the EU² or Norway³). The adoption of this new governance system, still ongoing, and the decisions derived from its implementation could have a considerable impact on the status of fish stocks and the marine environment in the North East Atlantic, as most of the commercially important fish stocks in this region are shared between the UK and other third parties.
The UK Government stated its commitment to become a world leader in fisheries management by ‘setting a gold standard’ following its departure from the EU4 as well as continuing to uphold the vision of ‘clean, healthy, safe, productive and biologically diverse seas’ set out in the UK’s Marine Strategy5. It is vital the government deliver on these objectives in order to achieve sustainable fisheries and healthy marine ecosystems– the key components of Good Environmental Status (GES)b,5. Such achievements
are also essential if the UK is to support prosperous domestic fishing fleets and coastal communities, as well as meet its commitments and obligations under international law such as the United Nations Convention on the Law of the Sea (UNCLOS), the Convention on Biodiversity (CBD) and the United Nations Sustainable Development Goal (SDG) 14.
Within the last decade, the overfishing rate for fish populations in European Atlantic waters has dropped from roughly 66% to 38%, while biomass has continued to increase6. This progress, while insufficient given the UN and EU commitment to completely end overfishing by 2020, is a positive trend that has come about due to the strong EU fisheries regulatory framework, including the CFP. This encouraging trend has not only had a positive effect on the recovery of stocks but also on the socioeconomic performance of the European fleet7. It is essential that this trend continues and accelerates so that overfishing finally becomes a thing of the past, and so that marine ecosystems are given the chance to rebound and build resilience to large-scale threats such as climate change.
10 UK FISHERIES AUDIT 2021
b GES is defined as the environmental status of marine waters where these provide ecologically diverse and dynamic ocean and seas which are clean, healthy and productive within their intrinsic conditions, and the use of the marine environment is at a level that is sustainable, thus safeguarding the potential for uses and activities by current and future generations.
There is an opportunity for the UK, as a fully independent coastal state for the first time in over 40 years, to lead the way in sustainable fisheries. In doing so, the UK can demonstrate the importance and value of implementing the best management standards, collaboration across national and international borders, and long-term holistic environmental management. Failing in doing so will rapidly compromise the progress made during past years.
 © OCEANA / Juan Cuetos
1.1 Objectives of the report
The key objective of this report is to provide an evidence-based snapshot of the status of UK fish stocks, shared stocks included, and the UK fishing sector’s recent exploitation history of those stocks, by the time the UK abandons the EU fisheries policies. In doing so, the report will provide a baseline for evaluating the UK’s progress and/or setbacks in the sustainable management of fish stocks and the objective to bring an end to overfishing.
1.2 Report structure
The report is structured in seven sections. After this first introductory section the report continues with a brief overview of the EU and UK fisheries management system to set the scene for the following analyses (Section 2).
In Section 3 an overview of the current exploitation and stock size status of 104 stocks (corresponding to 70 management units) is provided, including a geographical breakdown by sea basin. Alongside the stock status, there is a snapshot of the recent landings by the UK fleet in UK waters of each species by
The report collates and presents the range of biological and socio-economic evidence that should underpin management decisions, like the setting of TACs or the proposal of fisheries management plans, and fisheries management frameworks. The breadth of the study helps contextualise decisions for individual stocks, while the case studies provide evidence of the implications of those decisions. In addition, evidence gaps are highlighted, which the UK government will need to prioritise in order to achieve sustainable management.
volume and value. Within this broader overview, key socio-economic information is also presented.
Section 4 takes a closer look at a selection of stocks. Firstly we look at the environmental, management and economic data for the ‘top 10’ stocks for the UK fishing sector – selected primarily based on landings statistics (volume and value), but with additional factors such as the UK’s quota share and scientific data availability also taken into account. A similar review is undertaken for the five most sustainably and five most unsustainably fished stocks (based
12 UK FISHERIES AUDIT 2021
on recent indicators of their exploitation and population status) – the ‘best’ and ‘worst’ performers. Finally, we further consider some of the stocks of greatest concern, focusing on the exploitation and management history of the cod (Gadus morhua) stocks.
Section 5 delves into some specific issues associated with the UK fishing industry and its management
through five environmental impact case studies. For each, some opportunities and risks posed by EU Exit are considered.
Finally, Section 6 summarises the report’s overall conclusions and in Section 7 Oceana provides its associated policy recommendations.
© OCEANA / Ester Casado
2. Management of fisheries in UK waters
This section provides a brief overview of key components of the UK fisheries management system as was under the CFP, as context to the snapshot of the status of UK fish stocks, shared stocks included, by the time EU fisheries rules stop applying to the UK. It then goes on to provide a brief introduction to the UK fisheries management framework from 2021, as far as it is understood to date.
14 UK FISHERIES AUDIT 2021
2.1 Key observations
• On average, around 27% of EU catches in the North East Atlantic were also taken from UK waters between 2012 and 2016. In fact, EU vessels landed more fish from UK waters than the UK fleet, although the UK fleet’s landings had higher value.
• When the UK was part of the EU, TACs for stocks under exclusive EU competence were set by the EU Agriculture and Fisheries Council (AGRIFISH), which included the UK’s Fisheries Minister. Bilateral and multilateral negotiations also took place annually between third parties and the European Commission. The allocation of the agreed TACs among EU member states was subject to a fixed percentage of each TAC known as the relative stability key.
• The fundamental objective of the reformed CFP is to restore and maintain fish stocks above biomass levels that can produce their MSY by 2020. Progress towards that MSY objective has been made but it is yet to be met for all stocks, many of which the UK shares with the EU fleet and other third parties.
• Negotiations for North East Atlantic TACs cover over 50 commercial species with 200 different stocks distributed across the various fishing areas within Atlantic coastal states’ 200nm EEZs as well as on the high seas. The UK fishing fleet shares many of these stocks with the EU and other third party nations.
• The majority of UK fisheries landings from the North East Atlantic in 2019 (618,000 t, valued at £979 million) came from UK waters (81% by live weight and 87% by value). The second most important waters for the UK fleet were those of the EU, accounting for an additional 15% of landings (8% by value).
• The UK’s departure from the EU means it no longer has to adhere to the CFP objectives and rules. For the shared stocks the UK will now directly negotiate bilateral and multilateral agreements, like those recently adopted with the EU and with Norway.
• The new domestic Fisheries Act is the main framework regulation for the devolved management of the UK’s fish and shellfish resources and fisheries.
• The 2020 Fisheries Act contains the principles and basis for setting exploitation rates for UK
15 UK FISHERIES AUDIT 2021
© OCEANA / Andrzej Białas
fish stocks, negotiating management measures for shared stocks and permitting access of nonUK fishing vessels to UK waters, etc. There are concerns that the sustainability objectives are more flexible than those required by the CFP.
• The UK must now meet its duties within the Act to develop Fisheries Management Plans which maintain stocks at or above MSY or restore them to levels capable of producing MSY, as well as plans for data deficient stocks.
• The system of quota allocation between the four UK fisheries administrations and
their respective fleets based on Fixed Quota Allocation (FQA) units, and separate management of the under 10 m quota pools, will largely continue. This means the historical quota limitations for the 10 m and under fleet, despite their dominance by number, is likely to continue.
• Any additional quota gained through the new negotiations process may be subject to an amended, yet to be decided, system. NGOs are advocating for preference to be given to lowimpact fishers.
framework for fisheries management decisions
2.2 Legal
2.2.1 EU fisheries management framework under the CFP
The basis and principles upon which the UK negotiated annual fishing opportunities and managed the UK fleet’s activities for three decades were primarily those set out in the CFP and the multiannual management plans developed under the CFP.
The fundamental objective of the reformed CFP (2013)8, which is the set of rules through which the EU fisheries will continue to be managed, is to restore and maintain fish stocks above biomass levels that can produce their MSYc. To achieve this, the MSY exploitation rate (FMSY) should have been achieved by 2015 where possible and by 2020 at the latest for all stocks.
c For details, see: https://www.documents.clientearth.org/wp-content/uploads/library/2015-09-08-maximum-sustainable-yield-in-the-commonfisheries-policy-ce-en1.pdf
16 UK FISHERIES AUDIT 2021
As such, the scientific advice on fishing opportunities provided by ICES, upon which the Commission’s proposals are based, has the objective of achieving MSY9.
Progress towards the MSY objective has been made but it is yet to be met for all stocks10,11. In 2019, the Landing Obligationd which in Atlantic waters affects
MSY as the key CFP objective
stocks subject to catch limits, was introduced in full after a phased introduction from 2015. Discarding of unwanted catch is now only permitted under certain conditions, and instead all catches must be landed and counted against quota allocations (where applicable)12 .
Article 2(2) of the CFP Basic Regulation13 reads as follows:
"The CFP shall apply the precautionary approach to fisheries management, and shall aim to ensure that exploitation of living marine biological resources restores and maintains populations of harvested species above levels which can produce the maximum sustainable yield.
In order to reach this objective of progressively restoring and maintaining populations of fish stocks above biomass levels capable of producing maximum sustainable yield, the maximum sustainable yield exploitation rate shall be achieved by 2015 where possible and on a progressive, incremental basis at the latest by 2020 for all stocks."
MSY is a theoretical maximum yield (catch) that can be taken from a stock in the long term under constant environmental conditions when that stock is at the biomass reference point BMSY (in theory, the stock size at maximum population growth rate). The fishing mortality rate that should lead to BMSY, on average (all other things being equal), is called FMSY.
17 UK FISHERIES AUDIT 2021
d The Landing Obligation means that all EU vessels must now land all of their catch which is subject to quota limits, including for example nontarget species and below minimum size target species (termed ‘unwanted catch’). There are some exemptions for certain fisheries and species, for example where there is scientific evidence of high discard survival.
For some fisheries, additional management measures are specified though regulations under the umbrella of the CFP. In recent years, the most important EU fisheries and stocks have been managed through regional multiannual plans (MAPs). Of particular relevance for the UK were the North Sea MAP14 and the Western Waters MAP15 which cover demersal fish stocks and their fisheries around UK waters.
Each plan contains goals for fish stock management, including an MSY objective, and in some cases specific conservation rules. For select fisheries, such as scallop dredging, EU management measures take the form of ‘input control’ by restricting effort through fleet capacity and/or time spent at sea (see Case Study 5 in Section 5).
2.2.2 UK fisheries management framework
As an EU Member State, alongside conforming to the requirements of the CFP, additional management measures for UK fisheries catching stocks shared with the EU fleet are specified by the UK and devolved administrations (Scotland, Wales, Northern Ireland). All UK registered vessels that fish commercially in UK waters require a licence which varies depending on factors such as vessel length, area and species fished. The purpose of the UK licencing system is to limit fishing effort by restricting the size of the UK fleet.
Management of inshore fisheries (0-6nm) is also devolved within the UK. In England, inshore fisheries are managed by ten Inshore Fisheries and Conservation Authorities (IFCAs) and regulated by IFCA bylawse. In devolved nations, national fisheries authorities manage the inshore waters. Non-quota
species (predominantly shellfish, except for Nephrops norvegicus) are only regulated through national legislation and policies (on a devolved basis).
The new Fisheries Act1 is the main framework regulation for the management of the UK’s fish and shellfish resources and fisheries now the UK has left the EU. This regulation contains for example the principles and basis for setting exploitation rates for UK fish stocks, negotiating management measures for shared stocks and permitting access of non-UK fishing vessels to UK waters. There are Fisheries Objectivesf which cover various sustainability objectives, including a commitment to best management standards such as MSY. However, as these are not firm duties there are concerns that they are more flexible than those required by the
e Which for example specify effort limitations through fishing permits, gear requirements, minimum landing sizes and temporal and/or spatial closures, including to protect the features of Marine Protected Areas. http://www.association-ifca.org.uk/
f The fisheries objectives are: (a) the sustainability objective, (b) the precautionary objective, (c) the ecosystem objective, (d) the scientific evidence objective, (e) the bycatch objective, (f) the equal access objective, (g) the national benefit objective, and (h) the climate change objective.
18 UK FISHERIES AUDIT 2021
CFP. This has the potential to undermine the UK Government’s previous assurances of commitment to gold standards of fisheries management as well as the UK’s international obligations on sustainability and biodiversity. Implementation of the legislation is now in progress such as the development of the UK Fisheries Statement and the Secretary of State Fisheries Statement, and it is hoped that further commitments to MSY are made there. There are also
duties to develop Fisheries Management Plans to maintain stocks at or above MSY or restore them to levels capable of producing MSY, as well as plans for data deficient stocks.
The Fisheries Management Plan process (Clauses 6(3-4) of the UK´s Fisheries Act)
(3) The plan must specify whether the available scientific evidence is sufficient to enable the relevant authority or authorities to make an assessment of the stock’s maximum sustainable yield and -
(a) if it is, must specify policies of the relevant authority or authorities for restoring the stock to, or maintaining it at, sustainable levels or for contributing to its restoration to, or maintenance at, sustainable levels;
(b) if it is not, must -
(i) specify policies of the relevant authority or authorities for maintaining or increasing levels of the stock,
(ii) specify the steps (if any) that the relevant authority or authorities propose to take to obtain the scientific evidence necessary to enable an assessment of the stock’s maximum sustainable yield to be made, and
(iii) where no such steps are proposed, state the reasons for that.
(4) In determining the policies to be specified under subsection (3)(b)(i), the relevant authority or authorities must adopt the precautionary approach to fisheries management (within the meaning of section 1 [of the Act]).
19 UK FISHERIES AUDIT 2021
2.3 Decision making process
The primary management mechanism for North East Atlantic fisheries targeting commercial species are ‘output controls’ in the form of TACs, while fisheries for non-quota species are typically controlled through ‘input controls’ in the form of fishing effort management (Figure 1). Both management systems are intended to restrict fishing mortality to levels that are consistent with the requirements of the regulations and agreements in place.
During the time the UK was part of the EU those TACs for stocks under exclusive EU competence were set by the EU Agriculture and Fisheries Council (AGRIFISH), which included the UK’s Fisheries Minister, and were specified within the annual TAC and Quota Regulationsg. Those decisions are based on the European Commission’s fishing opportunities proposals and subsequent Member State negotiations during AGRIFISH Council meetings. The allocation of the agreed TACs among EU member states, commonly known as quota, was subject to a fixed percentage of each TAC known as the relative stability key.
In the case of stocks shared between the EU and other third parties, bilateral and multilateral agreements, including agreements on TACs and quotas, are typically made annually. In these cases, the European Commission represented the interests of the EU in the negotiations with the third parties through a mandate adopted by the AGRIFISH Council, UK included. Examples of these agreements include the fisheries agreement with Norway for the shared demersal and pelagic stocks or the North East Atlantic Fisheries Commission (NEAFC) agreements
Out control
Total allowable Catch (TAC)
Selectivity criteria (age/sex/minimum size)
Bycatch limits
Input control
Fishing capacity (size, number of vessels, power)
Gear requirements (size/number of fishing nets/number of hooks/number of traps/pots)
Time spent fishing (number of days)
with coastal states (e.g. Norway, Faroe Islands, Greenland, Iceland and Russian Federation) for widely distributed stocks.
Negotiations for North East Atlantic TACs cover over 50 commercial species with 200 different stocks distributed across the various fishing areas within
g For example: Council Regulation (EU) 2020/123 of 27 January 2020 fixing for 2020 the fishing opportunities for certain fish stocks and groups of fish stocks, applicable in Union waters and, for Union fishing vessels, in certain non-Union waters. Available at: https://eur-lex.europa.eu/legalcontent/EN/TXT/PDF/?uri=CELEX:32020R0123&from=EN
20 UK FISHERIES AUDIT 2021
Figure 1: Input and output control examples
Atlantic coastal states’ 200nm Exclusive Economic Zones (EEZs) as well as on the high seas.
Since January 2021 when the transition period ended the UK has full autonomy to decide on the management measures to apply to its fisheries within its EEZ. For the shared stocks, which represent most of the stocks managed through catch limits, the UK will directly negotiate bilateral and multilateral agreements, like those recently adopted with the EU and with Norway. As before leaving the EU, the UK will continue having full discretion in the distribution of fishing opportunities among its fishing fleet.
TAC allocation and application
Relative Stability is an allocation key used to share out fishing opportunities among EU Member States. It was agreed in the early 1980s and has remained mostly unchanged since then. EU countries can exchange allocated quotas with other EU Member States.
Figure 2 shows the distribution of management units associated with quota stocks (only those included in this report – see Section 3.2) fished by the UK across different relative stability bands, illustrating the shared nature of those stocks.
For certain stocks, such as North Sea haddock (Melanogrammus aeglefinus) and whiting (Merlangius merlangus), an additional allocation adjustment can be applied to the relative stability quota shares – the Hague Preference. Hague Preference can be invoked by the UK and/or the Republic of Ireland when those stocks fall below a threshold level. The purpose of this CFP mechanism is to adjust national relative stability shares to account for the needs of certain fisheries-dependent areas in northern parts of the UK and the Republic of Ireland16. Those adjustments come at the expense of other Member States17.
Many TACs are associated with specific conditions. For example, they can only be used for bycatches and not for directed fisheries, and/or a proportion of the quota can be used flexibly across different TAC areas, and/or they can only be used within certain geographical limits.
In-year adjustments can, and often are, made to the TACs as a result of amended scientific advice, for example. Once a Member States’ quota share has been used, that Member State is responsible for closing the fishery.
21 UK FISHERIES AUDIT 2021
0 5 10 15 20 25 30 76-100% 51-75% 26-50% 5-25% 8 12 21 29 UK relative stability share (%) Number of TAC / management units
Figure 2: Distribution of UK relative stability share by management
2.4 Allocation of fishing opportunities in the UK
Member States set their own rules for how to allocate quotas amongst their nationally registered vessels (although they must meet certain EU criteria).
For the UK the process is more complicated as like fisheries management, quota distribution is a devolved matter undertaken by each of the four fisheries administrations:
• UK Government – England (Marine Management Organisation)h
• Scottish Government (Marine Scotland)
• Welsh Government
• Northern Ireland Executive (Department of Agriculture, Environment and Rural Affairs)
The UK system, set out in the UK ‘quota management rules’17, is based on Fixed Quota Allocation (FQA) units, allowing for any national adjustments or application of special conditions, including ‘underpinning’ for the non-sector and under 10 m pools, where, for some stocks, there is a guaranteed minimum level allocated to those fleet segments.
FQAs represent a fixed percentage of the available quota attached to a fishing licence, based on historical average landings. Licenced vessels with a quota entitlement are divided into 3 groups, with each group associated with a number of FQA units (Figure 3).
Vessels that are members of a producer organisation (PO). Typically over 10 m vessels, but not exclusively
h The Isle of Man and Channel Islands are treated as part of England for the purposes of apportioning UK quota amongst the fisheries administrations
22 UK FISHERIES AUDIT 2021
Over 10 m vessels not part of a PO
Smaller vessels not part of a PO
Sector pool
Non-sector pool 10 m and under pool
Figure 3: Breakdown of FQA allocation
Each fisheries administration receives a quota allocation (in tonnes, t) from the UK government for each stock based on their proportional share of the 3 groups (Figure 3)i. Penalties can be applied to unauthorised overfishing of quota allocations by a producer organisation (PO) or fisheries administration.
The 10 m and under pool is managed centrally by each fisheries administration, rather than quota allocations being associated with individual vessel licences. There are concerns over the limited availability of quota for 10 m and under vessels (they hold <2% of UK quota), despite their dominance by number (almost 80% of the UK fleet)18,19, the impacts of which have the potential to be exacerbated by the UK’s departure from the EU20. The UK government have said they do not intend to change the existing quota allocation methodology following Brexit4 , much to the disappointment of the ‘under 10’ sector and eNGOs who want to see a fairer and more sustainable distribution of fishing quota. However, the outcomes of UK Government consultations on the allocation of any additional quota between fisheries administrations, the crown dependencies and within England are pendingj. NGOs are advocating for preference to be given to low-impact fishers.
Once allocated, quota does not remain static.
Fisheries administrations and POs can undertake domestic and, currently, international (with other Member States) quota swaps and transfers21. Under the CFP, the UK could also ‘bank’ up to 10% of its quota or remaining uncaught quota (the lesser amount) for use the following year and could ‘borrow’ up to 10% of their end of year quota from next year’s TAC. These quota movement flexibilities were important for the UK fishing industry, particularly as mitigation against chokek risks posed by the Landing Obligation22
However, the permitted permanent transfer of FQAs has led to the concentration of quota ownership by a limited number of both UK and foreign companies which needs to be redressed23,24. For example, 5 families own or control around 30% of UK fishing quotas and in England, around 50% of fishing quota is held by Dutch, Icelandic and Spanish companies25 .
i For example, https://www.gov.uk/government/publications/these-are-the-fishing-quota-allocations-for-2020-for-england-and-the-uk j Consultations closed on 10 November 2020: https://www.gov.uk/government/news/government-consults-on-new-measures-to-boost-thefishing-industry-and-coastal-communities?utm_source=4fd7789e-4244-4280-a22e-fa64327a1a46&utm_medium=email&utm_campaign=govuknotifications&utm_content=daily
k Choke risks – Occur in mixed fisheries where a fishing vessel has low quota for one or more species (typically bycatch species) but quota still available for another (typically the target species). There is therefore a risk that if the vessel were to continue fishing for the stock(s) with available quota, catches of the stock(s) for which quota is no longer available would continue, therefore exceeding the catch limit(s). To avoid this, the (target) fishery would have to close prematurely.
23 UK FISHERIES AUDIT 2021
2.5 Where the UK fleet catches fish
The majority of UK fisheries landings from the North East Atlantic in 2019 (618,000 t, valued at £979 million) came from UK waters (81% by live weight and 87% by value), and more specifically Scottish and English waters (61% and 16% of UK North East Atlantic landings, respectively). Around 27% of EU catches in the North East Atlantic were also taken from UK waters26 .
The second most important waters for the UK fleet were those of the EU, accounting for 15% of landings (8% by value) from North East Atlantic waters. The Irish EEZ provides the most important non-UK fishing grounds for the UK fleet (representing 11% by weight and 4% by value of landings originating from outside UK waters in 2019), followed by French, Danish and German EEZs.
Third non-EU country waters (primarily Norwegian, including Svalbard) accounted for 4% of landings and 5% of the value in 2019. These figures were similar for the period 2012-201626
24 UK FISHERIES AUDIT 2021
Non-UK fishing activity in UK waters
Under the CFPl there are historical arrangements for some Member States to fish quotas in each other’s coastal (6-12nm) waters, as well as equal access rights to the EU’s EEZ. For example, French vessels had the right to fish within multiple locations in the UK’s coastal waters and conversely the UK had access to coastal waters of France, Germany and the Netherlands. From January 2021 the UK will control who has access to UK waters.
Based on an average of 2012-2016, EU vessels landed more fish from UK waters than the UK fleet (the EU fleet landed 56% of the 1.25 million tonnes of fish caught around the UK), although the UK fleet’s landings had higher value (representing 57% of the total value of £1,156 million), mainly because the non-UK fleet’s landings feature high volumes of lower value pelagic fish. The most important species caught by EU vessels in UK waters, by weight, were herring (247,000 t), mackerel (136,000 t) and sandeel (82,000 t)26 .
Around 27% of EU catches in the North East Atlantic are taken from UK waters. The EU Member State fleets that landed the largest quantities of fish from UK waters were Danish (235,000 t; £91 million), Dutch (157,000 t; £86 million) and French (111,000 t; £156 million). Danish and Dutch vessels landed a higher share of tonnage from UK waters than English vessels (19%, 13% and 11% respectively; compared to 28% for Scottish vessels). Overall, the EU fleet’s activity in UK waters has historically been far higher than UK activity in European waters outside the UK EEZ26 .
Along with EU Member State fishing activity, Norwegian vessels landed on average 231,000 t (£145 million value) from UK waters each year between 2013 and 2016, which was roughly equal to France by value26 .
l Detailed in Annex 1 of the Basic regulation (https://eur-lex.europa.eu/legal-content/EN/TXT/PDF/?uri=CELEX:32013R1380&from=EN)
25 UK FISHERIES AUDIT 2021
© OCEANA / Juan Cuetos
3. Status of UK fish stocks and UK fishing industry as the UK left the EU
The objective of this section is to provide a snapshot of the status of UK, including shared, fish stocks in 2020 (or the most recent assessment year prior to that) based on indicators of exploitation and stock size. The broader context to this audit is presented through an overview of socio-economic characteristics of the UK fishing fleet, including recent import and export patterns.
The fishing fleet is supported by and connected to ancillary industries ranging from boat building and gear supply before vessels head to sea, to the post-
harvest sector that processes and brings product to markets. Here, however, the focus is on the catching sector and the section draws on data compiled by the
26 UK FISHERIES AUDIT 2021
© OCEANA / Juan Cuetos
UK Government, on Parliamentary briefing papers, and on data collected by Seafishm, a non-departmental public body that supports the UK seafood sector.
The data are presented in aggregated form, at the most applicable stock, management unit or species
3.1 Key observations
• Stocks critical to UK fisheries include quota and non-quota species, with the latter not subject to EU TACs or ICES advice.
• Of the 104 stocks audited (82 of which are quota stocks shared with the EU), 35.6% were healthy in terms of stock size (43.9% of shared stocks), whereas 20.2% were in a critical condition (15.9% of shared stocks). Data limitations mean the status of the remaining 44.2% (40.2% of shared stocks) cannot be determined, leaving them at greater risk of unsuitable management decisions.
• 37.5% of the 104 audited stocks were sustainably exploited prior to the UK leaving the EU (42.7% of the 82 shared stocks), while 28.8% were being overfished (25.6% of the shared stocks) and the exploitation status of another 33.6% (31.7% of shared stocks) cannot be assessed against MSY reference points to guide management decisions.
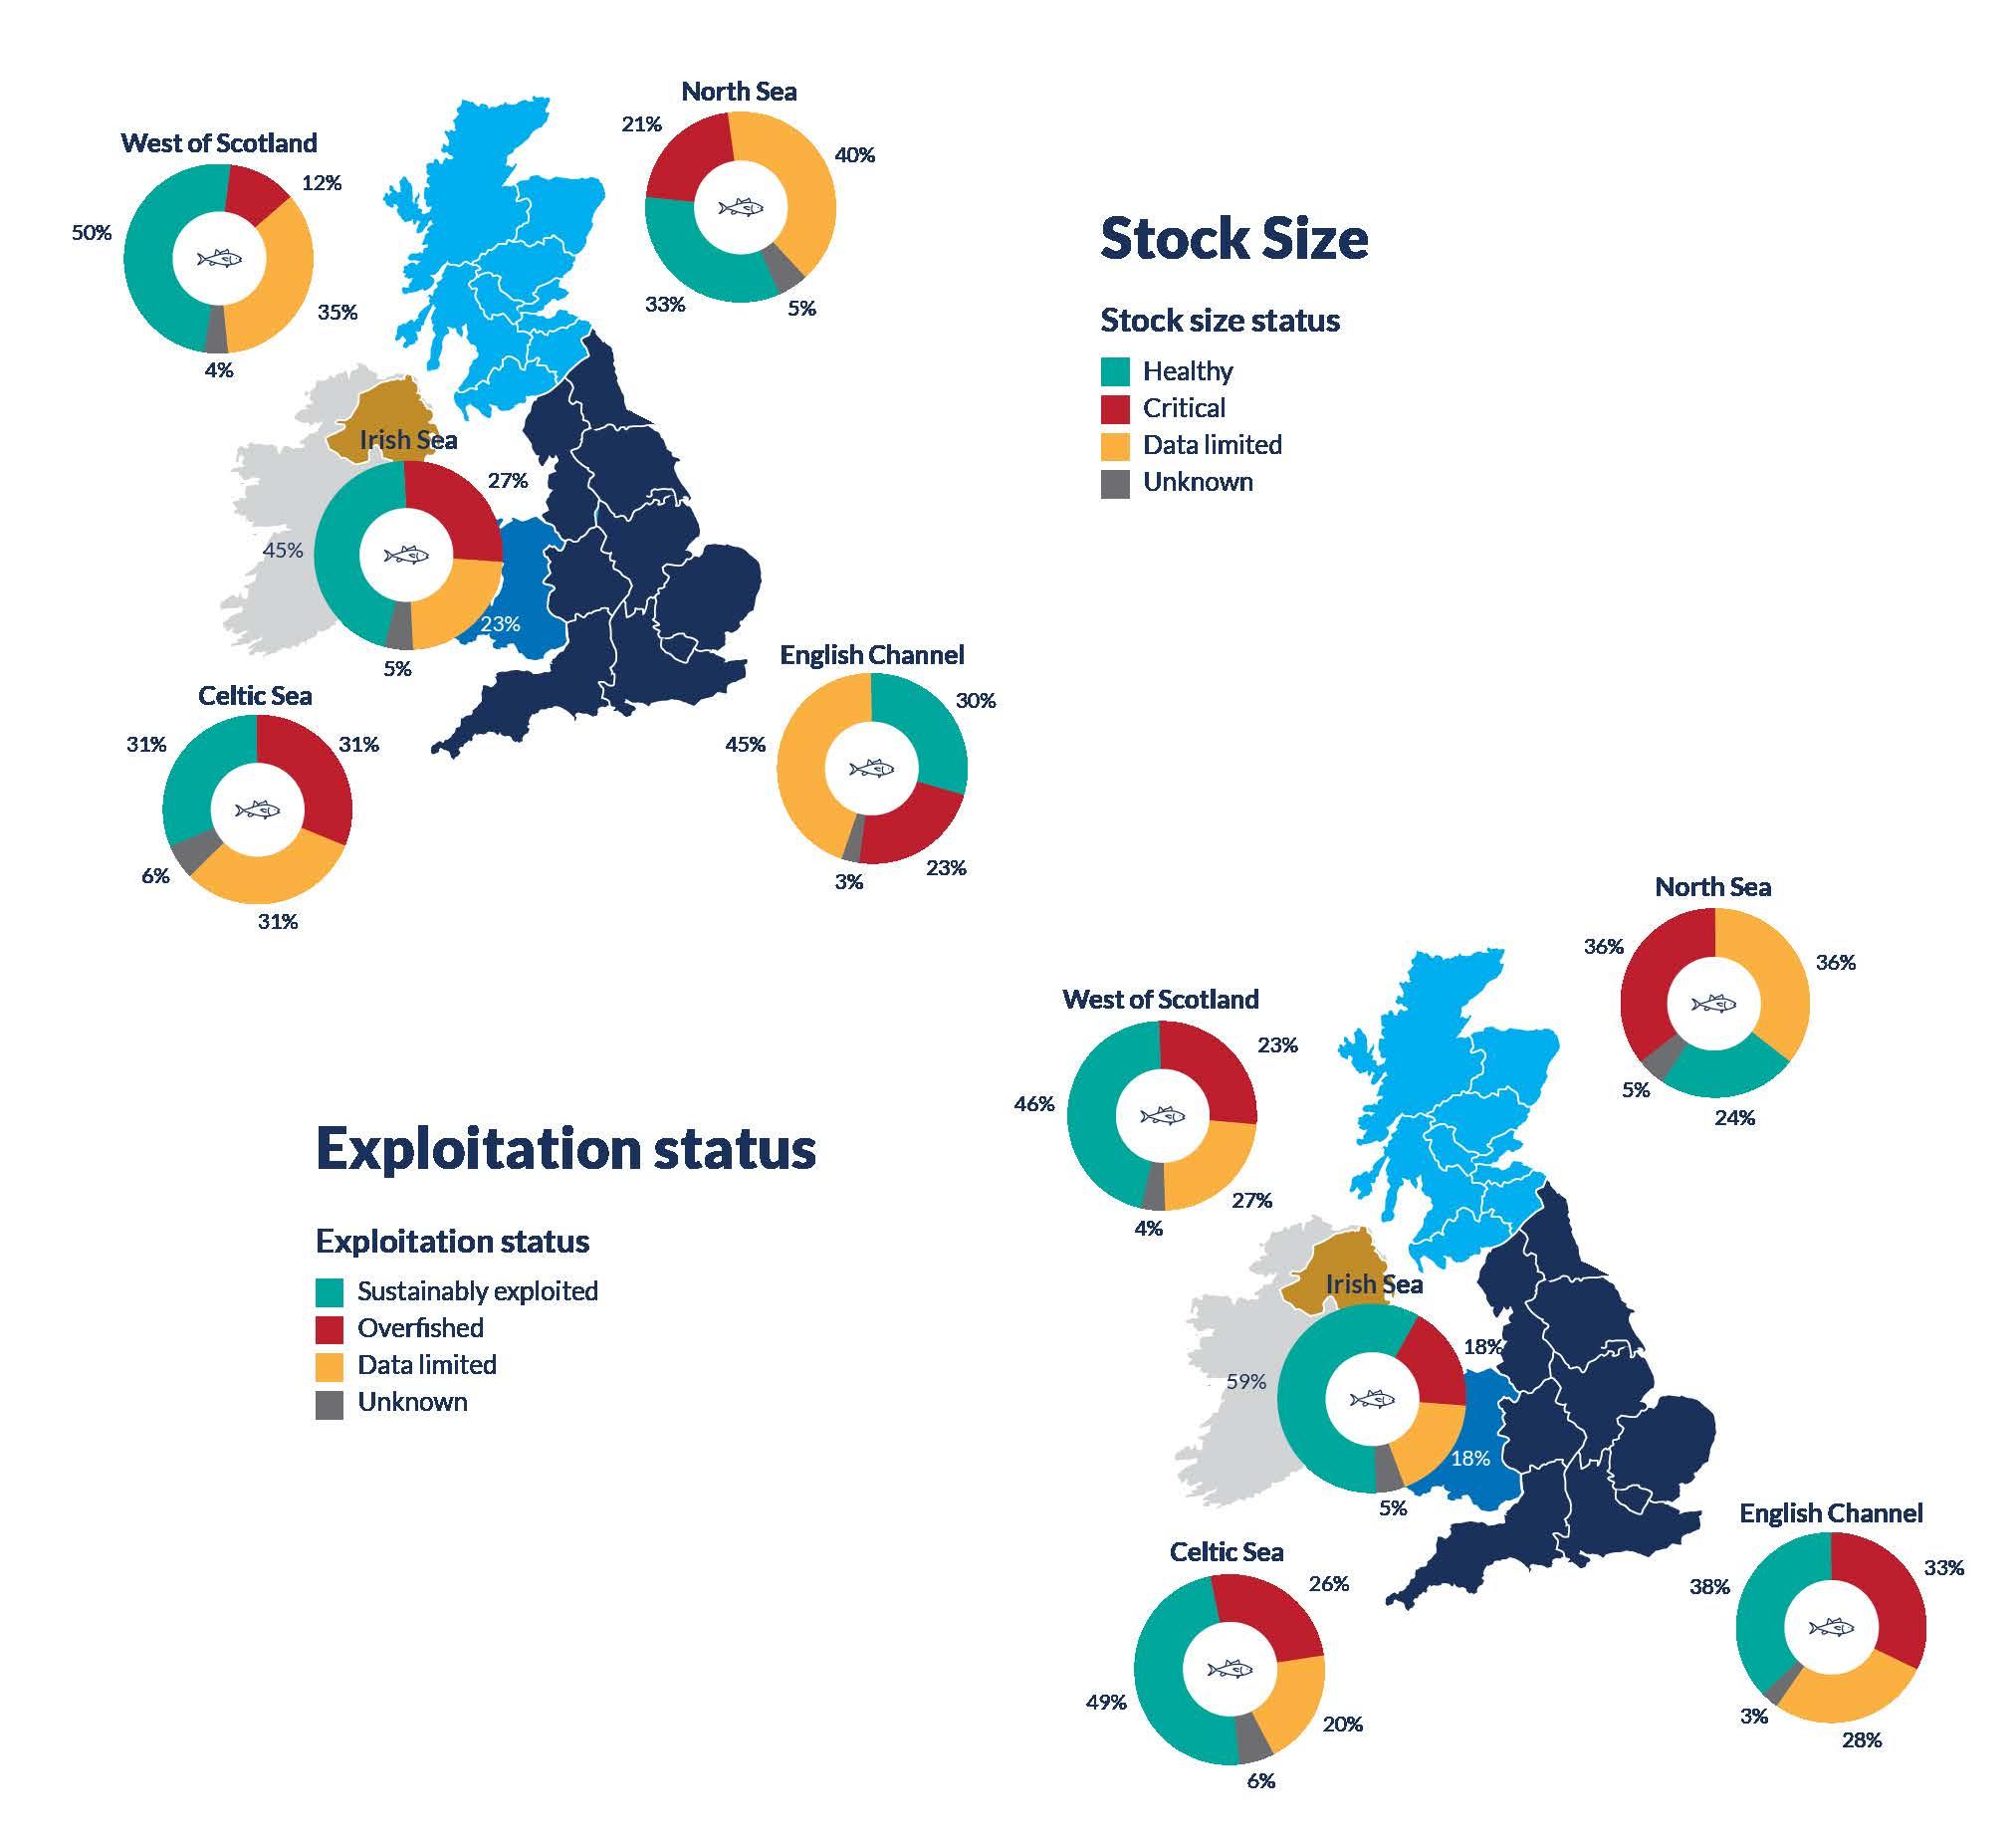
• Looking at stock size and exploitation status by sea basin, no region proved a bastion of sustainability. The West of Scotland fared best with 50% of stocks in a healthy state, compared to 24% in the North Sea - also the region with the highest proportion of overexploited stocks (36%).
level. Where possible and relevant, the analysis is broken down spatially (sea basin), politically (devolved fisheries administration) or by type of fishery (fish guild, vessel size).
m https://www.seafish.org/about-us/who-we-are-and-what-we-do/
• UK fisheries turnover about £1 billion per year with the majority derived from over 24 m vessels operating from Scotland.
• Pelagic quota species caught by the over 10 m vessels dominate UK landings by volume (54%). Non-quota shellfish such as scallops and crab are also key contributors (21%).
• Smaller inshore vessels (10 m and under) which dominate the UK fleet by number (74%) and have a far more limited geographical range than the over 10 m fleet, rely on non-quota species.
• Shellfish dominate 10 m and under vessel landings by volume and value (>80%).
• The geographic distribution of UK catch volume and catch value follow similar patterns.
• The UK is a net importer of seafood and the majority of UK catch is sold overseas, notably to markets within the EU (>720,000 t imported and >450,000 t exported).
27 UK FISHERIES AUDIT 2021
3.2 Methodology 3.2.1 Health of the stocks and exploitation status
The UK typically received a share of over 90 TACs for shared stocks when in the European Unionn. A subselection of those management units is considered in this report, based on a UK relative stability share of ≥5%. ICES provide scientific advice on stock status and fishing opportunities for most stocks subject to EU TACs (quota stocks)27. That advice is based on stock assessments tailored to the level of data available for each stock (for which 6 categories are defined), leading to different approaches being applied to enable advice to be produced. These include the ICES MSY advice rule or management plan/strategy approacho, or where data requirements are not fulfilled, the precautionary approach9
The following species have also been included in the analyses in this report due to their importance to UK fisheries, but they are not subject to EU TACs (nonquota stocks) and / or ICES advice:
•Cockles (Cerastoderma edule)
•King scallops (Pecten maximus)
•Edible crab (Cancer pagurus)
•Lobster (Homarus gammarus)
•Whelks (Buccinum undatum)
•Seabass (Dicentrarchus labrax)
Instead, where available, scientific assessments for specific stocks undertaken by IFCAs or Centre for Environment, Fisheries and Aquaculture Science (Cefas) were used.
For many quota stocks, the ICES stock unit and EU management unit (TAC area) do not fully align (a management unit can encompass multiple stocks, or a single stock can occur in multiple management units). Whereas biological monitoring and scientific assessment are based on the stock’s geographical distribution, TAC areas or management units are aligned with ICES Divisionsp .
As a result of this mismatch, and the additional non-quota stocks, the report presents data for the following number of stock and management units (details provided in Appendix 1):
•Number of stock units: 104, which includes:
-Number of non-quota stock / management units: 22
•Corresponding number of management units (TACs): 70
n Plus additional TAC shares for deep sea species and stocks fished in Norwegian and other international waters.
o Where the plan/strategy has been agreed by all relevant management parties and it has been evaluated by ICES to be consistent with the precautionary approach.
p For a detailed evaluation of this issue, see https://www.documents.clientearth.org/wp-content/uploads/library/2016-12-02-mismatch-betweentacs-and-ices-advice-ce-en.pdf
28 UK FISHERIES AUDIT 2021
The analyses of exploitation and stock size status are based on stock unit. Information relating to landings and TAC are necessarily based on the management unit or for some data sources, are only available at the species level.
Indicators of stock exploitation and stock size status are derived from the most recent ICES advice or alternative (‘Other’) stock assessments. These indicators are based on assessments of the stock size and fishing rates against MSY reference points or proxy reference points, where available. Such reference points provide benchmarks against which the effectiveness of the management approach can be evaluated. The proportion of stocks for which the indicators are based on proxy reference points is stated to show the relative distribution of lower and higher confidence assessments. Further details on the indicator methodology are provided in Appendix 2.
The corresponding year of advice, and so reference period for the audit, varies between stocks due to the frequency and timing of advice provision. For 54% of stocks, the reference year for stock status is 2020, whereas it is 2019 for 25%, 2018 for 11% and 2017 for 11%. For most stocks assessed by ICES, the reference point for exploitation status is one year earlier than stock statusq whereas for non-quota stocks the reference period is the same for both indicators.
The stock and exploitation status results (% of stocks assessed as each of the four categories for each indicator) are also provided on a regional basis, by sea basin: North Sea, English Channel, Celtic Sea, Irish Sea and West of Scotland, as these represent the broad TAC areas (ICES Subareas/Divisions). Many stocks (and some management units) overlap with more than one sea basin and therefore their indicator status is duplicated spatially.
3.2.2 Socio-economic statistics
The analyses of UK vessels landings (weight, tonnes (t) and value, GBP (£)) by species and vessel size category, were derived from the MMO’s latest landings dataset based on catches in the UK EEZ only26. Mapped landings (by weight, value and vessel
size category) were instead based on the MMO’s UK sea fisheries annual statistics report for 201919 . The same data source provided imports and exports, employment and fleet size statistics, supplemented by additional data from Seafish.
29 UK FISHERIES AUDIT 2021
q Because ICES advice estimates the spawning stock biomass at the beginning of the year to which the advice applies (advice year) (or at spawning time the year before the advice year for some stocks), based on the fishing mortality in the previous year
3.3 Results
3.3.1 Stock status overview
From the 104 stocks assessed as part of this analysis, 37 (35.6%) were deemed to have a ‘healthy’ stock size, whilst 21 (20.2%) were considered to be a in a critical condition (Figure 4).
Of these stocks classified as healthy or critical, 43 (74.1%) were based on a full quantitative or analytical ICES assessment, and 15 (25.9%) were based on proxies for MSY reference points.
Similarly, when looking at exploitation status, 39 stocks (37.5%) were identified as being sustainably exploited, while 30 stocks (28.8%) were classed as being overfished in the most recent year of assessment (Figure 4). A higher proportion (33.3%,
Stock status indicators
n=23) of exploitation indicator assessments were based on proxy reference points and therefore were associated with lower confidence.
Indicators for stock biomass and fishing mortality
were unavailable for 39.4% and 28.8% of stocks for the respective assessment types. Therefore, a large proportion of fisheries management decisions are being made with incomplete data. A number of those stocks with data too limited to appoint reference points were the non-quota shellfish species. However, a variety of catch-controlled species were also data limited, including several stocks of Nephrops, anglerfish (Lophiidae), and more recently cod (Gadus morhua) in the Irish Sea.
Stock status indicators are based on the most recent assessments of stock size and fishing mortality rate (exploitation status) relative to MSY reference points (Btrigger and FMSY, respectively). Further details are provided in Appendix 2.
30 UK FISHERIES AUDIT 2021
Stock size status 20.2% 35.6% 39.4% 4.8% Exploitation status 28.8% 37.5% 28.8% 4.8% Healthy / Sustainably exploited Critical / Overfished Data limited Unknown
Figure 4. Stock size and Exploitation status of 104 stocks fished by the UK
The stock size and exploitation status of the remaining 4.8% of stocks is completely unknown due to lack of scientific assessment. Surprisingly, these were not just non-quota stocks (whelks, Buccinum undatum) but one stock each of herring (Clupea
Status of the shared stocks
harengus), plaice (Pleuronectes platessa) and saithe (Pollachius virens), although all are relatively minor stocks for the EU.
For the 82 shared (quota) stocks considered in the audit, 43.9% (n=36) were assessed as having a healthy stock size, whilst 15.9% (n=13) were in a critical condition with stock biomass below MSY reference points.
Compared to the full list of audited UK stocks, a slightly higher proportion (42.7%, n=35) of the shared stocks were being fished at a sustainable rate as the UK left the EU, although 25.6% (n=21) were still being overfished (Figure 5).
The majority of these stock size and exploitation status assessments (85.7% and 80.4%, respectively) were based on a full quantitative or analytical ICES assessment, rather than proxy reference points.
However, MSY-based indicators for stock size and fishing mortality rate were unavailable for 30 (36.6%) and 23 (28%) of the shared stocks, respectively due to data limitations. These included several stocks of Nephrops, anglerfish and more recently cod in the Irish Sea. For a further 3 stocks (3.7%) (of herring, saithe and plaice), no scientific assessment was available at all to inform sustainable fishery management decisions.
31 UK FISHERIES AUDIT 2021
Stock size status - shared stocks 43.9% 3.7% 15.9% 36.6% Exploitation status - shared stocks 42.7% 3.7% 25.6% 28.0% Healthy / Sustainably exploited Critical / Overfished Data limited Unknown
Figure 5. Stock size and Exploitation status of 82 shared stocks fished by the UK
When aggregating the data by sea basinr, no region proved a bastion of sustainability though the West of Scotland fared best with the highest proportion of stocks in a healthy condition (50%), followed by the Irish Sea (45%). The English Channel, North Sea and Celtic Sea all had between 30% and 37% of their stocks assessed as healthy (Figure 6). The West of Scotland had the fewest stocks in a critical condition (12%), whilst the size of 31% of stocks in the Celtic Sea was assessed as critical. Stocks with limited data, which prevented associated reference
points being appointed, was highest in the North Sea and English Channel where 40-45% of stocks assessed had incomplete data, compared to 23% in the Irish Sea.
Nearly 60% of the stocks fished by the UK in the Irish Sea are considered to be sustainably exploited (Figure 6). The number of stocks being overfished was greatest in the English Channel and North Sea (33-36%), whilst the West of Scotland and the Irish Sea had the lowest proportion of stocks categorised as overfished (18-23%).
r Whilst the total number of stocks represented here remains 104 some of those are duplicated across sea basins because the indicator assessments are based on ICES biological stock units rather than TAC areas, which tend to be restricted to an ICES Subarea or Division (and therefore sea basin). The following number of stocks are included in each sea basin: West of Scotland - 26, North Sea - 42 English Channel - 40, Celtic Sea - 35 , Irish Sea - 22.
32 UK FISHERIES AUDIT 2021
3.3.2 Composition and distribution of UK landings
Mackerel (Scomber scombrus) accounted for the largest volume of landings in weight from UK waters in 2019 and was predominantly caught by vessels of over 10 m in length. Herring (Clupea harengus) followed with landings of 71,000 t whilst Nephrops, haddock, and King scallops (Pecten
maximus) also made a substantial contribution to the UK’s annual landings by weight (20-30,000 t per stock) (Figure 7)s.
For smaller vessels (10 m and under), shellfish dominated their landings, highlighting the smaller
s The values presented here are for UK vessels fishing in the UK EEZ only; for species such as mackerel and blue whiting, total UK landings are significantly higher when catches from outside the UK EEZ are included.
33 UK FISHERIES AUDIT 2021
Shellfish Pelagic Demersal 10 m and under vessels 85% 6% 9% Over 10 m vessels 54% 21% 25% Cod Crab Scallops Haddock Nephrops Herring Mackerel Cockles Hake Blue whiting Whelks Whiting Saithe Anglerfish Squid Megrim Plaice Cuttlefish Ling Sardines Horse mackerel Sandeels Pollack Witch European lobster Common sole Lemon sole Gurnard Bream Mussels Halibut Brill Shrimps and prawns Turbot Blue ling Oysters Mullet Seabass Species
1,725 142 3,229 70 2,314 238 9,948 230 35 260 9,327 0 7 1,513 11 241 28 518 685 29 414 92 120 442 2,274 2 455 9 81 35 38 3 2 40 375 66 5 147,658 71,000 29,468 29,162 20,872 17,852 15,589 13,680 13,276 11,910 10,157 9,808 8,131 7,713 6,872 6,764 5,675 4,289 3,977 3,187 2,755 1,984 1,521 1,135 1,048 902 782 758 723 418 334 293 200 69 53 32 5 40,00020,000
Under 10 m weight Over 10 m weight
Figure 7: Weight of UK vessel landings (tonnes) from UK waters by vessel length in 2019
Weight (tonnes)
020,00040,00060,00080,000100,000120,000140,000160,000180,000
100,000,00050,000,000 50,000,000100,000,000150,000,000200,000,000250,000,000
Value
inshore vessels’ current reliance on non-quota species. The significant landings of mackerel and herring for the over 10 m fleet is reflected by pelagic stocks comprising 54% of landings overall. The remaining 56% of landings for the over 10 m fleet was split almost equally between shellfish and demersal species such as cod, haddock and anglerfish (21% and 25% respectively).
34 UK FISHERIES AUDIT 2021
Species
Anglerfish Haddock Crab Cod Scallops Nephrops Mackerel Whelks Saithe Common sole European lobster Whiting Hake Herring Lemon sole Plaice Cockles Megrim Ling Cuttlefish Squid Gurnard Pollack Brill Sardine Blue whiting Turbot Horse Mackerel Sandeels Seabass Blue ling Shrimps and prawns Mussels Witch Halibut Oysters Mullet Bream 2,453,514 17,851,021 5,573,954 565,381 22,989,859 737,692 118,779 74,381 17,214 196,587 31,218,721 4,624,161 35,751 12,683,982 1,185,882 1,378,850 45,902 50,894 1,041,931 1,204,553 493,890 6,354 819,773 12 89,205 249,643 1,401,797 112,936 22,766 2,169 1,457 319,613 3,858,635 12,395 134,466 172,914 13,784 177,000,000 91,240,630 44,705,059 43,674,726 43,425,792 43,033,816 41,908,323 37,532,373 20,517,871 15,266,456 14,953,963 13,985,625 13,133,516 12,323,457 12,086,846 11,019,384 8,872,348 8,620,115 8,344,705 7,394,434 6,427,951 5,277,662 4,307,327 3,549,536 2,306,907 2,029,075 1,944,669 1,640,476 1,528,083 1,201,362 825,898 709,909 700,716 315,982 196,228 105,472 15,815 10 m and under vessels 84% 13% 2% Over 10 m vessels 34% 32% 34% 10 m and under Over 10 m Shellfish Pelagic Demersal
(£)
Figure 8: Value of UK vessel landings (£) from UK waters by vessel length in 2019
There are obvious similarities between the ranked list of species by landings weight (Figure 7) and by landings value (Figure 8). For example, the substantial contribution of mackerel to the UK fishing industry remains evident. Nephrops ranks higher based on value than weight however, reflecting its status as one of the most valuable species caught by the UK fishing industry. There are also differences for key species such as herring, whereby landings by value are not as significant as by weight, which in 0
turn affects the proportional contribution of pelagic species to the over 10 m vessel category. Conversely, scallops, cod and crab all place higher in terms of landings value.
Oysters, mullet, bream and seabass are low ranking for landed weight and landed value. These are aggregate figures for the UK and a low ranking should not be associated with low importance, particularly for localised fisheries.
Hotspots of UK fishing activity in 2019 are evident in terms of weight (tonnes) and value (£ million) of landings (mapped by their origin). The largest volume of fish was caught in the northern North Sea, specifically areas off north-east Scotland near Shetland and in the Celtic Sea west of Ireland (Figure 9). This is largely driven by the presence of large volumes of pelagic species such as mackerel, herring and blue whiting (Micromesistius poutassou), and aggregations of demersal species such as cod, anglerfish and haddock. Smaller hotspots are present in the English Channel, reflecting important demersal and shellfish fisheries.
Landings value follows a similar geographic distribution with visible hotspots in the northern North Sea, the English Channel and Irish Sea (latter more pronounced than trends by weight), although not to the west of Ireland (Figure 10). The value of landings in the English Channel appear distinctly higher than corresponding areas for landed weight, in part explained by the valuable English Channel common sole (Solea solea) fishery, and highly
35 UK FISHERIES AUDIT 2021
Figure 9: Geographic distribution of total UK vessel landings origin by weight (tonnes) in 2019
0-250 251-500 501-1,000 1,001-2,000 2,001-4,000 4,001-8,000 8,001-16,000 16,001-32,000 Weight (tonnes) 0-0.12 0.13-0.24 0.25-0.48 0.49-0.96 0.97-1.92 1.93-3.84 3.85-7.69 7.69-15.3 15.4-30.7 30.8-61.4 Value (£ million)
Figure 10: Geographic distribution of total UK vessel landings origin by value (£ million) in 2019
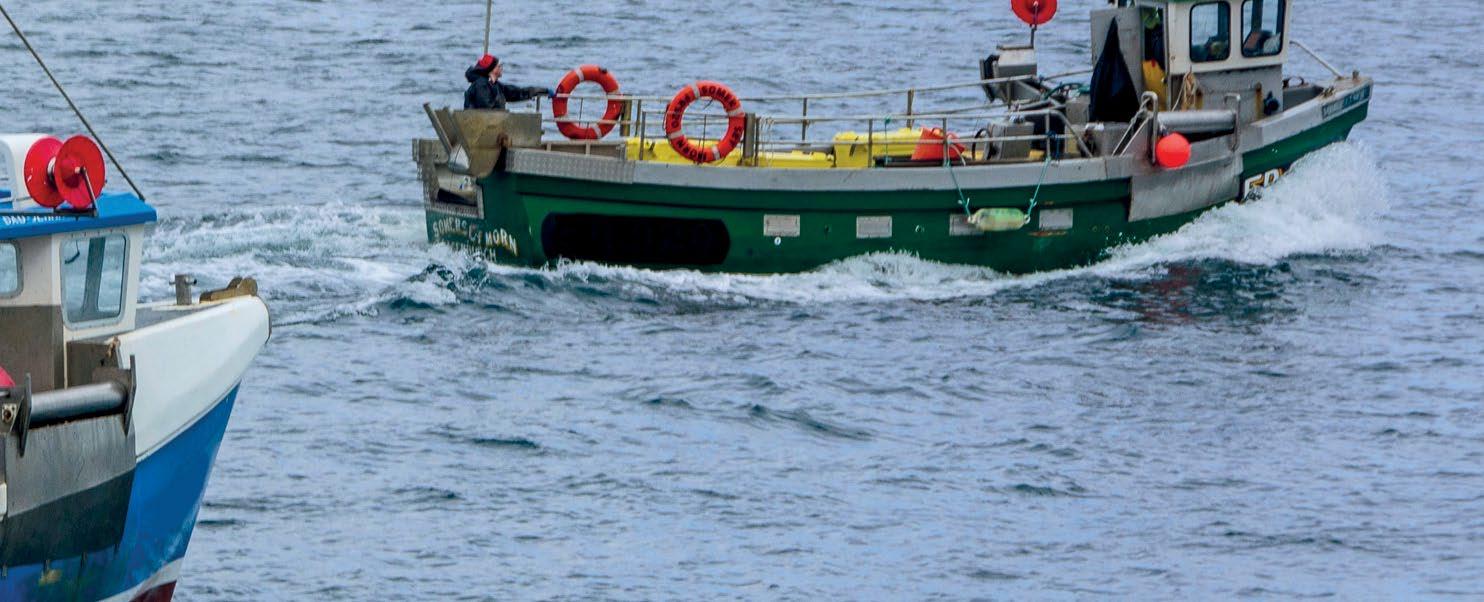
priced shellfish fisheries. High value spots in the Irish Sea are likely due to the high value Nephrops fisheries and the scallop fisheries around the Isle of Man. Clear geographic differences are visible when mapping the distribution of landings by the 10 m and under and over 10 m vessel categories (Figures 11 and 12). The capacity of larger vessels to exploit offshore waters is evident relative to the smaller vessel category for which fishing grounds are typically coastal. The over 10 m vessels comprise about 25% of the total fleet by number of vessels, yet the extent of the over 10 m fishing grounds is noticeably greater than the grounds fished by the 10 m and under vessels.
Over 10 m vessels
10 m and under vessels
36 UK FISHERIES AUDIT 2021 0-250 250-500 500-1,000 1,000-2,000 2,000-4,000 4,000-8,000 8,000-16,000 16,000-32,000 Weight (tonnes) 0-200 200-400 400-1,200 1,200-2,400 2,400-4,800 Weight (tonnes)
Figure 11: Geographic distribution of landings origin in 2019 by weight (tonnes) for UK vessels over 10 m in length
Figure 12: Geographic distribution of landings origin in 2019 by weight (tonnes) for UK vessels 10 m and under in length
3.3.3 Overview of socio-economic characteristics of the UK fishing industry
In 2019, the UK Government recorded 5,668 licensed fishing vessels19. Seafish provides a more detailed analysis of fishing vessels that are active and reported 4,491 vessels, of which about 1,500 (33%) are low activity vessels earning less than £10,000 per year28 .
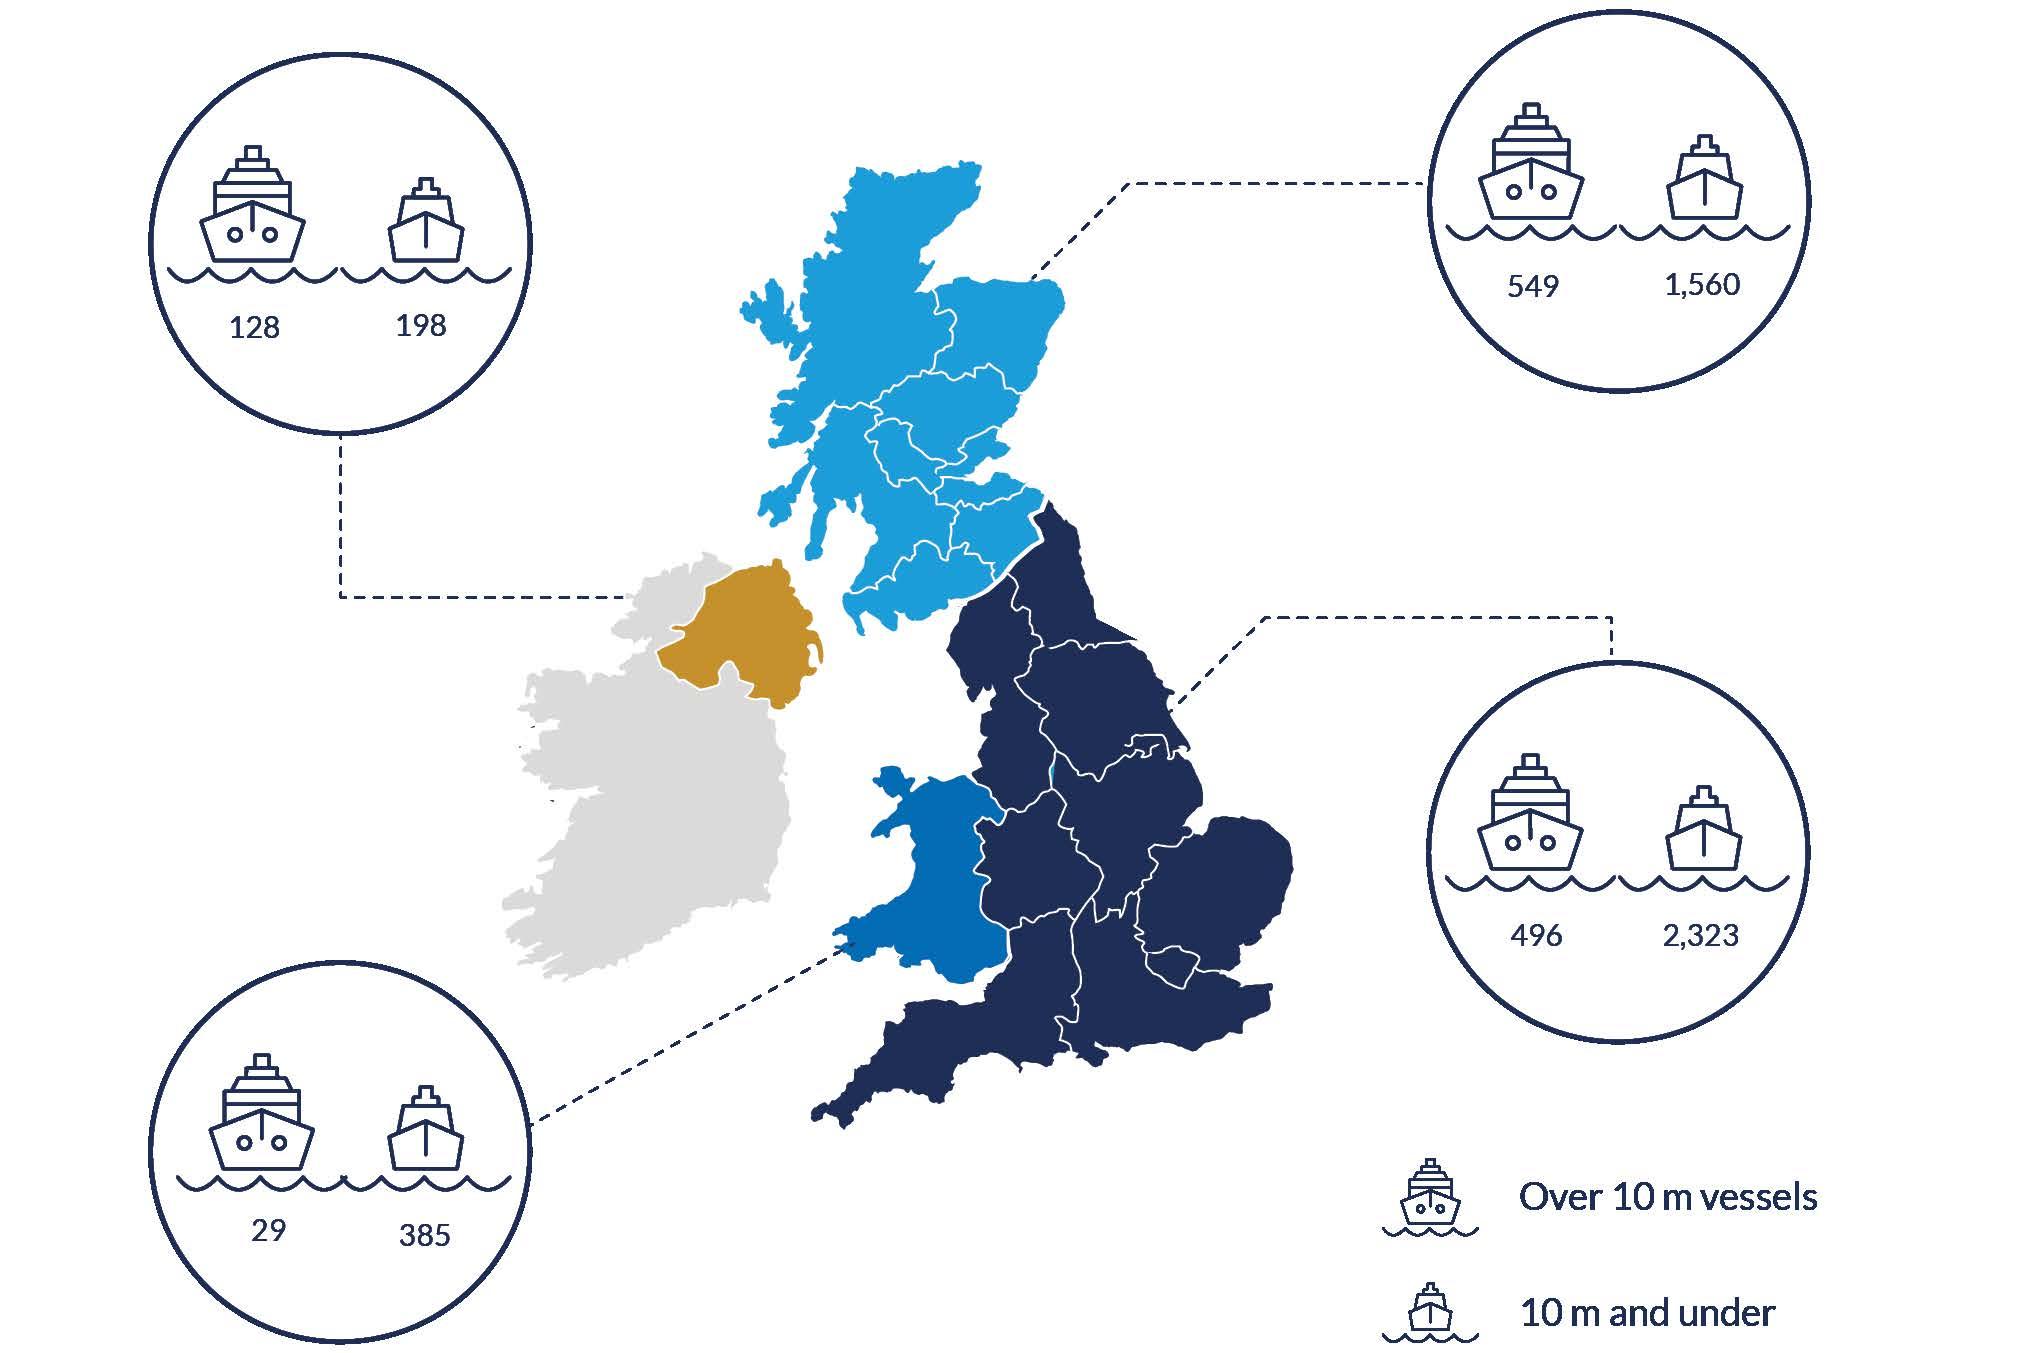
The 10 m and under vessel size category comprises 74% of the UK’s fleet. The distribution of the fleet by nation in 2019 is shown in Figure 13. Approximately 51% of the active fishing vessels use static or passive fishing gear28. The importance of particular stocks varies between the over and under 10 m fleets, with
the latter largely reliant on stocks that are present in or migrating through coastal waters.
Masked within the two size categories is a diversity of vessel types, capacities, and fishing gears. Seafish categorises the UK fleet based on a combination of vessel power, gear type, target species and region. This results in characterisations and economic profiles for 30 fleet segments, which range from trawlers (demersal, pelagic, beamers, Nephrops, dredges) to seine vessels (demersal, pair-trawl seiners), potting and trap vessels, netting vessels
37 UK FISHERIES AUDIT 2021
Figure 13: Distribution of the UK fishing fleet by devolved nation in 2019
(gill nets, drift net, fixed nets), longliners, and hook and line vessels. The need for greater granularity in fleet statistics is recognised by the UK Government, which, as of September 2019, was in the process of commissioning advice about how to better classify small-scale or low impact fishing29,30
The number of active fishing vessels is greatest in England (47% of the UK fleet), followed by Scotland (38%). In terms of days spent at sea, vessels registered in Scotland are most active. Scottish registered vessels also contribute the majority of landings by weight and value, and the importance of the over 10 m fleets becomes apparent. For example, vessels over 24 m in length landed about 80% of the total weight landed by Scottish vessels28. Most landings are made into UK ports, with the Scottish ports of Peterhead, Lerwick and Fraserburgh being particularly important in terms of volume. In 2019 the UK reported the second largest volume of landings of all EU Member States31.
As with most EU Member States, there has been a reduction in UK fleet capacity over recent decades. The fleet has decreased by about one third since the mid-1990s32. Meanwhile there has been an increase in vessels equipped to target non-quota species (e.g. crabs (typically Cancer pagurus), lobster (Homarus gammarus), cuttlefish (Sepia officinalis), whelks). These are supported by strong markets in the EU and also by relatively novel high demand markets in China.
The impact of the COVID-19 pandemic on these markets is working through the system now. As of October 2020, research teams, such as the Scottish Association for Marine Science, were in the process of understanding how ‘COVID-shock’ has impacted the seafood sector. The other major factor related to export markets is of course Brexit and the end of the transition period.
The GDP for fishing in 2019 was £747 million, down 7% from 2018 and representing 5.5% of the total for agriculture, forestry and fishing combined19 . Estimates of the UK fleet, based on samples of fishing costs and earnings, indicate a turnover of £1 billion, with an operating profit of £240 million28 Marine fisheries produced gross value added (GVA) of £483 million in 2018, or about 0.04% of the UK’s non-financial sector GVA32. The majority of GVA is associated with the over 24 m length fleet segment based in Scotland, contributing 67% of the more than £300 million created in 2019. In 2019, net profit margins ranged from -22% to +33% across fleet segments, with an average of 10% across the UK fleet28. Masked within these figures are the social contribution of fisheries, particularly of the 10 m and under fleet to remote coastal communities. There is a paucity of social studies focused on how fisheries contribute to, for example, remote coastal communities.
38 UK FISHERIES AUDIT 2021
7,000 6,000 5,000 4,000 3,000 2,000 1,000 England and Wales Scotland Northern Ireland 0 Number of workers Regular workers Part-time 1,550 4,824 906 3,941 168 654
Figure 14: Breakdown of catching sector employment by devolved nation in 2019
Factors affecting economic performance vary between fleet segments, ranging from biological (e.g. local changes in stock abundance/availability), environmental (e.g. weather conditions), competition (more or fewer competing vessels and gear in the same area, and competition with other maritime industries for space and access), market prices, regulatory (e.g. quota or effort access, gear requirements), changes to operating costs (e.g. harbour dues, vessel and gear repairs, fuel prices). These factors combine to influence overall profit and economic performance. Catches (affected by multiple ecological and anthropogenic factors), market prices and fuel costs are key drivers.
In terms of employment, the UK Government records 12,043 fishers employed in the UK in 201919, split among the four devolved nations as shown in Figure 14. Seafish provide alternative employment statistics based on the number of Full Time Equivalent (FTE) jobs aboard UK vessels, using MMO employment data combined with data obtained from the fishing industry.
The distribution of jobs as measured in FTE differs slightly from UK Government statistics and the FTE estimate is 8,012 in 202028. The majority of FTE jobs are aboard Scottish vessels (3,829), followed by English vessels (3,230), Northern Irish vessels (705) and Welsh vessels (140). Seafish also provide gender-disaggregated data for employment in the catching sector. There is, however, a lack of gender consideration for the post-harvest value chain, where women are significant contributors to the processing sector.
In terms of imports and exports, the UK has been noted to ‘import what is eaten and export what is caught’33. The UK is a net importer of seafood due to the faster growth of the import market over time in comparison with the export market32. In 2019, 721,000 t of seafood valued at £3.5 billion was imported, and 452,100 t of seafood was exported, valued at £1.8 billion19 .
39 UK FISHERIES AUDIT 2021
Figure
0 to 15,000 15,000 to 30,000 30,000 to 45,000 45,000 to 60,000 60,000 to 75,000 Imports (tonnes)
15: Global distribution of UK seafood imports in 2019
Disentangling the import/export figures is problematic; greater detail would be beneficial, for example about where product has been caught, whether the exporting country is the catching nation or a processor, and whether product is derived from aquaculture or capture fisheries. Nevertheless, plotting the available data provides a clear picture of the range and extent of imports and exports, and the global nature of the seafood sector (Figures 15 - 20)19
EU Member States are important sources of seafood consumed in the UK and are critical markets for fish and seafood caught by UK vessels. Asia is also an important source of seafood, although currently less important in terms of volume as an export market. However, the blunt volume figures should not diminish the importance of, for example, the Korean market for shellfish that is otherwise of relatively low value. The relevant EFTA States (Iceland and Norway) are important sources of imported seafood but are minor export destinations.
40 UK FISHERIES AUDIT 2021 Species 150,000 200,000 250,000 100,000 50,000 Other Fish Tuna Cod
Sardines Haddock Other Shellfish Mackerel
0 Weight (tonnes) EU EFTA Other
Shrimps & Prawns
Mussels
80,000 60,000 40,000 20,000 China Germany Iceland Vietnam Denmark Norway Spain Netherlands India Faroe Islands 0 Weight (tonnes) 73,603 55,883 54,481 37,923 35,688 35,215 31,801 26,021 17,256 17,049 Country
Figure 16: Top ten countries of UK seafood imports by weight (tonnes) in 2019
Figure 17: Volume of seafood imports by species and country in 2019 (EFTA = European Free Trade Association states, includes Norway and Iceland)
41 UK FISHERIES AUDIT 2021 0 to 10,000 10,000 to 20,000 20,000 to 30,000 30,000 to 40,000 40,000 to 50,000 50,000 to 60,000 Exports (tonnes) 150,000 100,000 50,000 Other Fish Mackerel Other Shellfish Herring Crab Cod Shrimps
0 Weight (tonnes) Species EU EFTA Other
& Prawns Saithe Sardines Mussels
40,000 50,000 60,000 30,000 20,000 10,000 France Ireland Spain China Italy Denmark Germany United States South Korea Romania 0 Weight (tonnes) 54,748 44,571 36,431 15,777 15,000 14,357 13,970 7,994 6,676 4,714 Country
Figure 18: Global distribution of UK seafood exports in 2019
Figure 19: Top ten countries of UK seafood exports by weight (tonnes) in 2019
Figure 20: Volume of seafood exports by species and country in 2019 (EFTA = European Free Trade Association states, includes Norway and Iceland)
4.Focus stocks
This section investigates in greater depth the current biological and management status of a subset of the UK’s fish stocks, selected according to their economic status (the ‘top 10’) or their performance: the 5 most sustainably and 5 most unsustainably fishedt, with the latter including three cod stocks. Separately, a more detailed examination of the recent exploitation and management history of all the cod stocks included in this report is provided, given ongoing concerns over the status of this iconic fish species. In doing so, the implications of any management actions or policy decisions by the UK government following Brexit can be considered against the more detailed benchmarks for these stocks.
4.1 Key observations
• Six of the ‘top ten’ stocks identified as economically most important to UK fisheries are overfished or their stock biomass is at a critical level. This includes two stocks which are overexploited and their biomass is below MSY biological reference points. Only 3 are healthy and sustainably exploited.
• 80% of the ‘top ten’ stocks are shared with other third parties, mainly with the EU, and subject to TACs. The remaining two are high value shellfish fisheries (scallops and edible crab).
• The prescribed TAC still exceeded the scientifically advised TAC for 4 of the relevant (eight) ‘top ten’ stocks in 2019 and 3 in 2020.
42 UK FISHERIES AUDIT 2021
t Sustainably fished or exploited’ refers to the stocks’ biomass and fishing mortality rate relative to MSY reference points, and is not a judgement on other criteria typically associated with sustainable fishing, such as environmental impacts resulting from catching method, gear type, etc.
© OCEANA / Carlos Minguell
• UK quota uptake exceeds UK catch allocations for many of the applicable ‘top ten’, for which the UK receives between 20% and 98% of the EU TAC.
• About 70-90% of the landings of the ‘top ten’ come from Scottish vessels.
• ‘Top ten’ landings (both by volume and volume) are dominated by mackerel, although North Sea cod and West of Scotland Nephrops are also valuable resources for the UK fishing industry.
• With a few exceptions, the ‘top ten’ stocks are also targeted by non-UK vessels.
• The five best performing (sustainably exploited and healthy) stocks have TACs set at or below advised TACs, unlike the ‘top ten’.
• The five best performing stocks are typically caught in relatively small quantities and are
4.2 Methodology
The ‘top 10’ stocks (management units) for the UK fishing sector were selected primarily on 2019 landings statistics (volume and value) from the MMO, but with additional factors such as the UK’s share of the TAC (greater relative stability share = higher
•North Sea herring (Clupea harengus) (HER/4AB)
•North Sea cod (Gadus morhua) (COD/2A3AX4)
•North Sea anglerfish (Lophiidae) (ANF/2AC4-C)
of relatively low value to the UK fishing industry, except for Western English Channel common sole which attracted the highest price per tonne of all the focus stocks.
• Zero catches have been advised for 3 of the five worst performing (overfished and stock size at critical status) stocks, which are key bycatch species for commercially important mixed fisheries in the Celtic Sea, Irish Sea and West of Scotland.
• North Sea cod, which features in the ‘top 10’ and five worst performers, is once again subject to recovery management measures, but the TAC has exceeded scientific advice for the last two years.
• A focus on all of the cod stocks, an iconic species for the UK, highlights the challenges of rebuilding depleted stocks.
score) and scientific data availability (ICES category 1 or 2 stocks = higher score) also taken into account for stocks with comparative landings rankings. The resulting listu was:
•North Sea haddock (Melanogrammus aeglefinus) (HAD/2AC4)
•North Sea whiting (Merlangius merlangus) (WHG/2AC4)
•North East Atlantic blue whiting (Micromesistius poutassou) (WHB/1X14)
•West of Scotland Nephrops (Nephrops norvegicus) (NEP/5BC6)
•North East Atlantic mackerel (Scomber scombrus) (MAC/2CX14)
•Eastern English Channel scallops (Pecten maximus) (non-quota)
•Southern North Sea crab (Cancer pagurus) (non-quota)
u Detailed as EU management unit common name, species and EU management unit code
43 UK FISHERIES AUDIT 2021
Landings values for blue whiting presented in the report appear relatively low as they are based on UK catches in UK waters (UK EEZ). However, catches of blue whiting by the UK fleet from outside the UK EEZ are significant, hence its inclusion in the ‘top 10’. For example, the UK fleet landed 60,000 t of blue whiting in 2019 but less than 10,000 t of that was caught in UK waters (Figure 7).
A similar review is undertaken for the five most sustainably fished stockst (‘best performers’), selected based on the indicators of their stock size status (categorised ‘Healthy’ for the 2020 ICES advice year) and exploitation status (categorised ‘Sustainably exploited’ for the previous year [2019]). In addition, there was high confidence in these assessments as they were all based on the ICES MSY or Management Plan approach (category 1 stocks; data sufficient):
• Irish Sea herring (Clupea harengus) (HER/07A/ MM)
• Irish Sea haddock (Melanogrammus aeglefinus) (HAD/07A)
• North Sea megrims (Lepidorhombus spp.) (LEZ/2AC4-C)
• North Sea plaice (Pleuronectes platessa) (PLE/2A3AX4)
• Western English Channel common sole (Solea solea) (SOL/07E)
The five most unsustainably fished stocks (‘worst performers’) were also selected on the basis of high confidence in the most recent assessment of their stock size status (categorised as ‘Critical’) and exploitation status (categorised ‘Overfished’). Those assessments were again derived from the 2020 ICES advice year, with the exception of Irish Sea whiting for which only 2019 advice was available. The resulting list was:
• North Sea and Eastern English Channel cod (Gadus morhua) (COD/2A3AX4, COD/07D) v
• West of Scotland cod (Gadus morhua) (COD/5BE6A)
• Celtic Sea and Western English Channel cod (Gadus morhua) (COD/7XAD34)
• North East Atlantic horse mackerelw ( Trachurus spp.) (JAX/2A-14)
• Irish Sea whiting (Merlangius merlangus) (WHG/07A)
Finally, the focus is turned to the cod stocks as a case study that brings into focus the factors that contribute to stock decline and which complicate recovery. A brief history of the ups and downs in cod population statuses, exploitation and management history is presented covering the following stocks:
• North Sea cod (Gadus morhua) (and Eastern English Channel) (COD/2A3AX4, COD/07D)x
• West of Scotland cod (Gadus morhua) (COD/5BE6A)
v Considered jointly in alignment with the ICES stock advice (cod.27.47d20)
w EU waters of 2a, 4a; 6, 7a-c,7e-k, 8abde; EU and international waters of 5b; intern. waters of 12 and 14
x Considered jointly in alignment with the ICES stock advice (cod.27.47d20)
44 UK FISHERIES AUDIT 2021
• Irish Sea cod (Gadus morhua) (COD/07A)
• Celtic Sea cod (Gadus morhua) (and Western English Channel) (COD/7XAD34)
A detailed description of the methodology used to develop the stock-specific analysis of (where applicable) advised versus agreed TACs, landings
4.3 Results
4.3.1 The UK’s Top 10
Status overview
The ’top 10’ stocks (management units) for the UK fishing sector were selected based primarily on landings, along with consideration of the UK’s TAC share and data availability. Only three of the ‘top 10’ were categorised as having a healthy stock status and being sustainably exploited in 2020 - North East Atlantic mackerel, North Sea haddock and West of Scotland Nephropsy (Figure 21).
Six of the ‘top 10’ were categorised as either overfished or critical according to the exploitation or stock status. North Sea whiting and North East Atlantic blue whiting had a healthy stock status but were classed as being overfished. North Sea herring however was categorised as being in a critical condition but was considered to be sustainably exploited in the most recent assessment suggesting there may be cause for optimism.
(volume and value), quota uptake, unsustainable catches and national quota allocation is provided in Appendix 3.
Of greatest concern were the two stocks for which both indicators of stock size and exploitation rate did not meet MSY reference points - Southern North Sea crab and North Sea cod. Lack of data to support assessments against reference points for Eastern English Channel scallops (stock size) and North Sea anglerfish (more commonly referred to as monkfish), of which nearly 7,500 t was landed by the UK fleet in 2019, also highlights a priority for sustainable management.
y For West of Scotland Nephrops, assessments are available separately for 3 functional units (stocks). The indicator status applies to all 3 of these functional units.
45 UK FISHERIES AUDIT 2021
Stockhealthandexploitation statusofthe‘top10’
(Figure 21)
Healthy / Sustainably exploited
Data limited
North East Atlantic mackerel (Scomber scombrus)
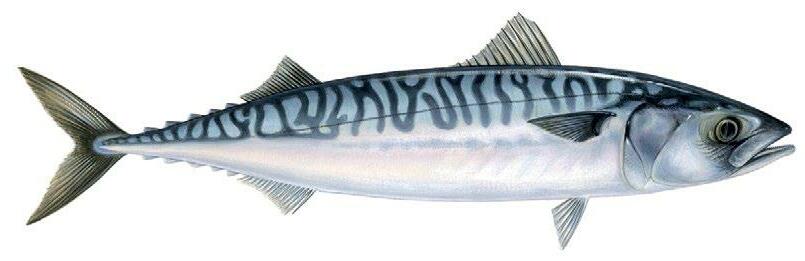
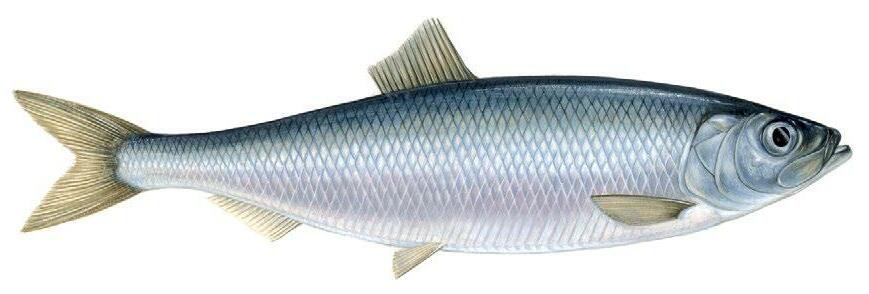
Exploitation status
Stock status
North Sea herring (Clupea harengus)
Exploitation status
Stock status
North East Atlantic blue whiting (Micromesistius poutassou)
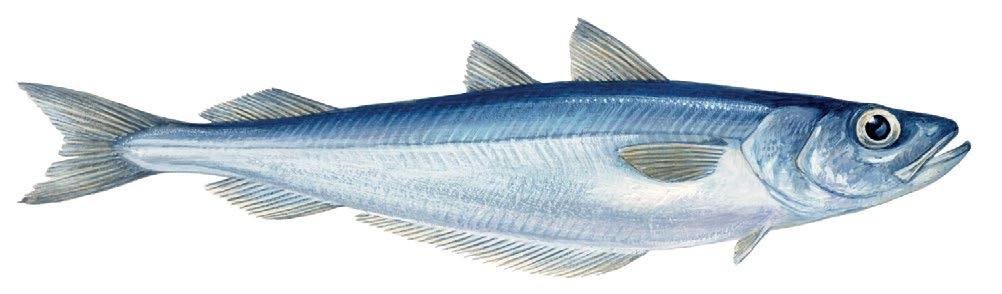
Exploitation status
Stock status
North Sea haddock (Melanogrammus aeglefinus)
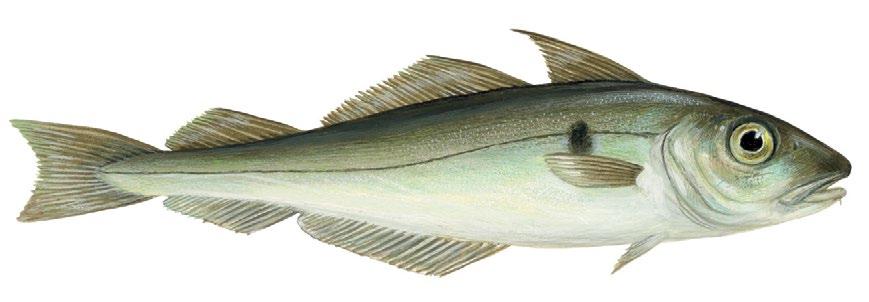
Exploitation status
Stock status
West of Scotland Nephrops (Nephrops norvegicus)
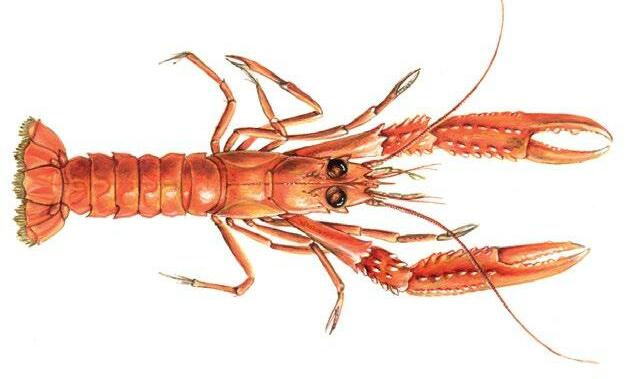
Exploitation status
Stock status
46 UK FISHERIES AUDIT 2021
North Sea
cod (Gadus morhua)
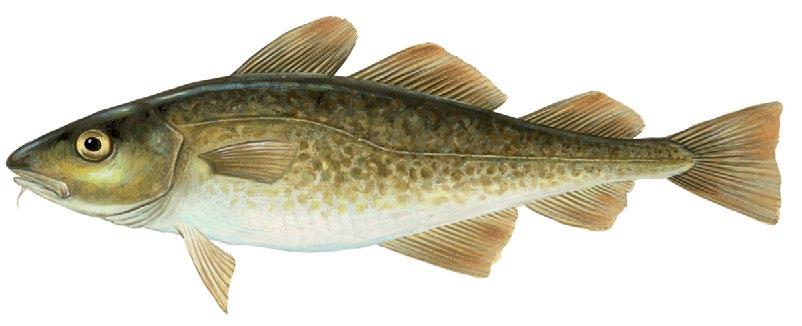
Exploitation status
Stock status
North Sea whiting (Merlangius merlangus)
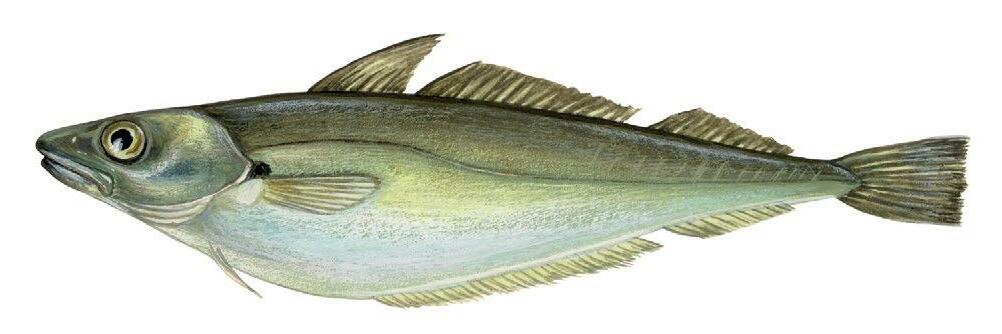
Exploitation status
Stock status
North Sea anglerfish
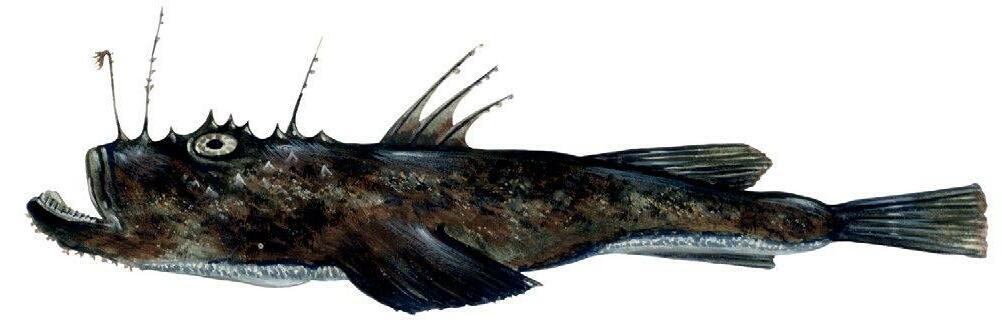
(Lophiidae)
Exploitation status
Stock status
Southern North Sea crab (Cancer pagurus)
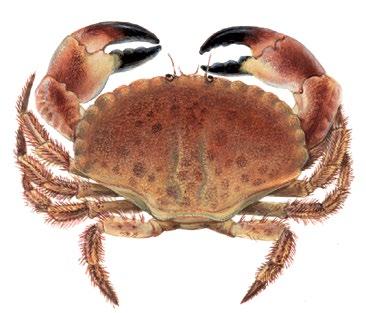
Exploitation status
Stock status
Eastern English Channel scallops (Pecten maximus)
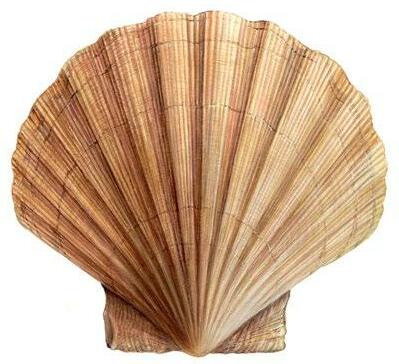
Exploitation status
Stock status
47 UK FISHERIES AUDIT 2021
Advised versus prescribed TACsz
The implications of this analysis are considered as part of Case Study 1 (Section 5).
For two of the stocks considered to be in good health and being exploited sustainably (haddock, Nephrops), the TAC has been set at or below the advised level for the last 4-5 years (Figure 22). For North East Atlantic mackerel, the scientific advice has been applied for the last two years, having previously been significantly exceededaa.
North Sea cod, which has been subject to a renewed period of recovery measures since 2019 (see Section 4.3.4), has had a TAC above scientific advice in the most recent years.
TACs for the stocks with a more mixed picture of their current status show variable trends. The TAC for North East Atlantic blue whitingbb was set at least 20% higher than scientific advice for the period 20162019, consistent with the current ‘overexploited’ status (Figure 21). However, the TAC for blue whitingbb is only partially influenced by the EU as Norway, Faroe Islands, Iceland and Russia also have significant interests in the fishery.
Discrepancy between the advised and agreed TAC for North Sea whiting was the most pronounced of all the focus stocks for the period 2016-2018
z Two of the ‘top 10’s stocks are non-quota, hence not included here
North Sea anglerfish
North Sea haddock
North Sea whiting
North East Atlantic blue whiting
West of Scotland nephrops
North East Atlantic mackerel
Although there has been some improvement in recent years, the 2020 TAC was still 10% higher than that advised. Despite this, whilst the stock is being overexploited at present this is not reflected in the stock size indicator. The increasing divergence between advised and set TAC for North Sea herring between 2016 and 2019 remains apparent in the ‘critical’ status of the stock size, despite the improvement in exploitation rate in 2020.
Given the data poor status of North Sea anglerfish, it is concerning that for the majority of the time series there does not seem to have been a precautionary approach to TAC decision-making.
aa The % difference in 2016 could not be calculated as an overall TAC for the EU, Norway and the Faroes was not specified by the Council of Ministers.
bb The % difference is based on the advised total catches by ICES and the sum of the unilateral quotas. The % difference could not be calculated in 2020 because the sum of the unilateral quotas was not available.
48 UK FISHERIES AUDIT 2021
100 80 60 40 20 0 20162017201820192020 -20 Percentage difference (%)
North Sea herring
North Sea cod
Figure 22: Difference between advised TAC and set TAC for the ‘top 10’ (2016-2020)
UK TACs
The UK’s relative stability share of the TACs for the focus stocksz ranged from 20% (North East Atlantic blue whiting) to 98% (West of Scotland Nephrops) (Figure 23). Additional insight into the relative reliance of the UK fishing industry on these stocks can be gained from the quota uptake figures e.g. how much of the UK’s quota was fished by the UK fleet (Table 1). With the exception of North Sea anglerfish and West of Scotland Nephrops, almost all of the UK’s initial (start of year) quota allocation, or more often in excess of that quota allocation, was caught by the UK fleet in 2019 (96-169% of starting TAC). These uptake figures are lower when compared to the end of year (final / adjusted) quota allocations because, with the exception of blue whiting and mackerel, the UK’s quota increased during the fishing yearcc .
Looking forward, ICES advice on TACs for 2021 compared to 2020 suggest a mixed picture in terms of stock status and therefore fishing opportunities. For example, there is a significant (66%) increase in the advised North Sea haddock TAC for 2021 relative
to 2020, whereas the advice for North Sea anglerfish is for a 20% decrease in permitted catches. Even between the three functional units which comprise the West of Scotland Nephrops management unit there is notable variation in the scientifically advised TAC for 2021 compared to 2020 (Table 1). The conversion of that scientific advice to the TAC is what matters and will be particularly critical for key stocks such as North Sea herring and cod where the stock is below sustainable biomass reference points.
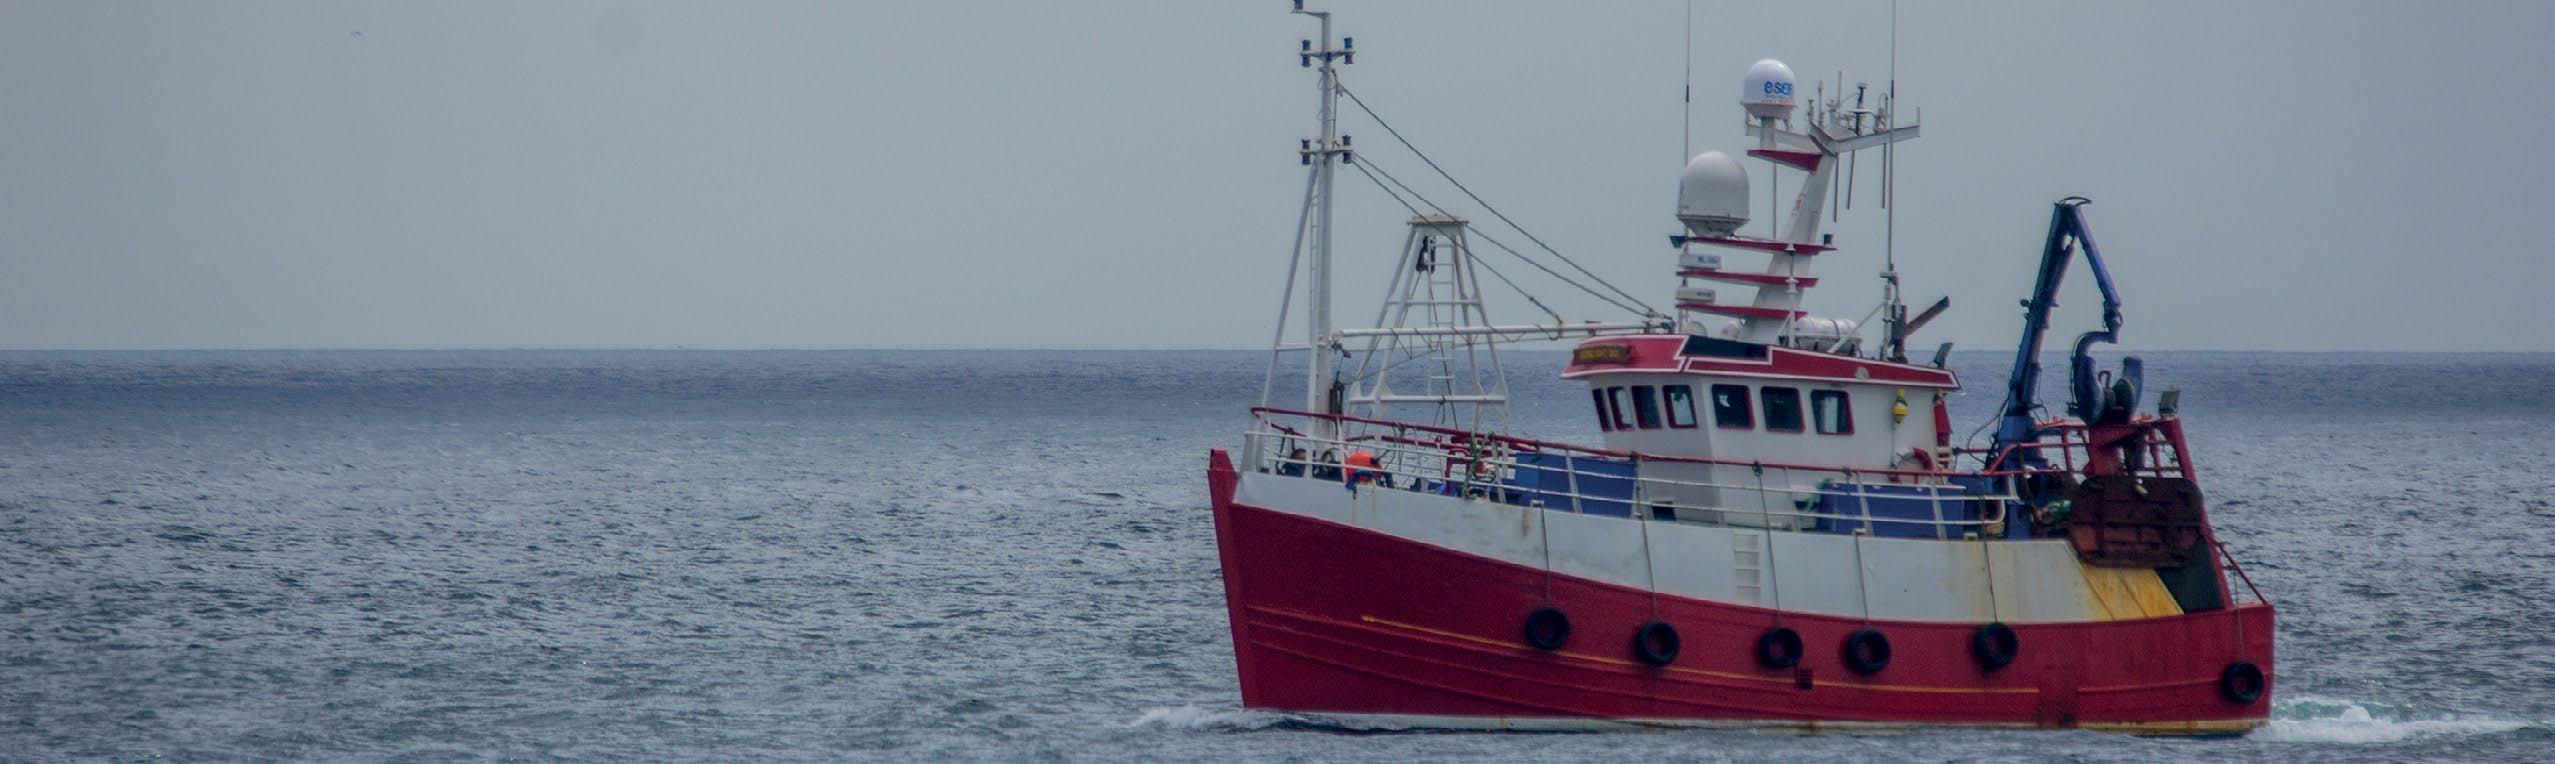
49 UK FISHERIES AUDIT 2021
North Sea haddock 84% North Sea nephrops 98% North Sea anglerfish 81% North Sea whiting 67% North East Atlantic mackerel 58% North Sea cod 47% North Sea herring 24% North East Atlantic blue whiting 20%
cc For example, due to international swaps, quota flexibilities such as bank and borrowing, special conditions associated with TACs (e.g. transfer of quota between stocks / areas) and in-year TAC adjustments by the European AGRIFISH Council.
Figure 23: UK relative stability share for the ‘top 10’
© OCEANA / Juan Cuetos
MANAGEMENT UNIT % UPTAKE OF FINAL UK QUOTA IN 2019 (% OF INITIAL ALLOCATION)
Landings in 2019
Mackerel dominates UK vessel landings in UK waters, followed by North Sea herring, with the majority caught by the Scottish fleet (~81% and 75%, respectively) (Figure 24). Indeed, with the exception of Southern North Sea crab and North East Atlantic blue whiting, Scottish registered vessels landed approximately 70-90% of the ‘top 10’ stocks.
Landings by Northern Irish vessels are generally small in comparison to Scotland and to a lesser extent England. North Sea herring, West of Scotland Nephrops and in particular North East Atlantic
Mackerel represent important stocks for Northern Irish vessels. Landings of these stocks by vessels administered in Wales are very low and hence do not appear on Figure 24ee
Approximate estimates of unsustainable catches in 2019, defined as catches (tonnes) in excess of the scientifically advised TAC, converted to a UK value based on the overall TAC share, are provided in Table 2 for the three stocks categorised as overexploited.
dd For the three stocks (functional units 11, 12, 13) associated with the management (TAC) unit
ee Indeed, Welsh registered vessels landed 1-2% of all landings by UK vessels in UK waters and abroad between 2015 and 2019, compared to 27-29% for English vessels, 62-65% for Scottish vessels and 4-7% for vessels administered in Northern Ireland. See: https://www.gov.uk/ government/statistics/uk-sea-fisheries-annual-statistics-report-2019
% DIFFERENCE
ADVISED TAC IN
AND
North Sea herring (HER/4AB) 101% (113%) -15% North Sea cod (COD/2A3AX4) 88% (143%) +8% North Sea anglerfish (ANF/2AC4-C) 48% (51%) -20% North Sea haddock (HAD/2AC4) 93% (116%) +66% North Sea whiting (WHG/2AC4) 91% (169%) +19% North East Atlantic blue whiting (WHB/1X14) 97% (96%) -20% West of Scotland Nephrops (NEP/5BC6) 57% (61%) -17% to +18% dd North East Atlantic mackerel (MAC/2CX14) 106% (101%) -8% 50 UK FISHERIES AUDIT 2021
BETWEEN
2020
2021
Table 1: Percentage uptake of UK quota in 2019 for the ‘top 10’ and change in the scientifically advised TAC
Foreign vessels targeting the ‘top 10’ stocks and catches outside the UK EEZ add a significant volume of catch onto those already caught by UK vessels in the UK EEZ (Figure 25). For example, on
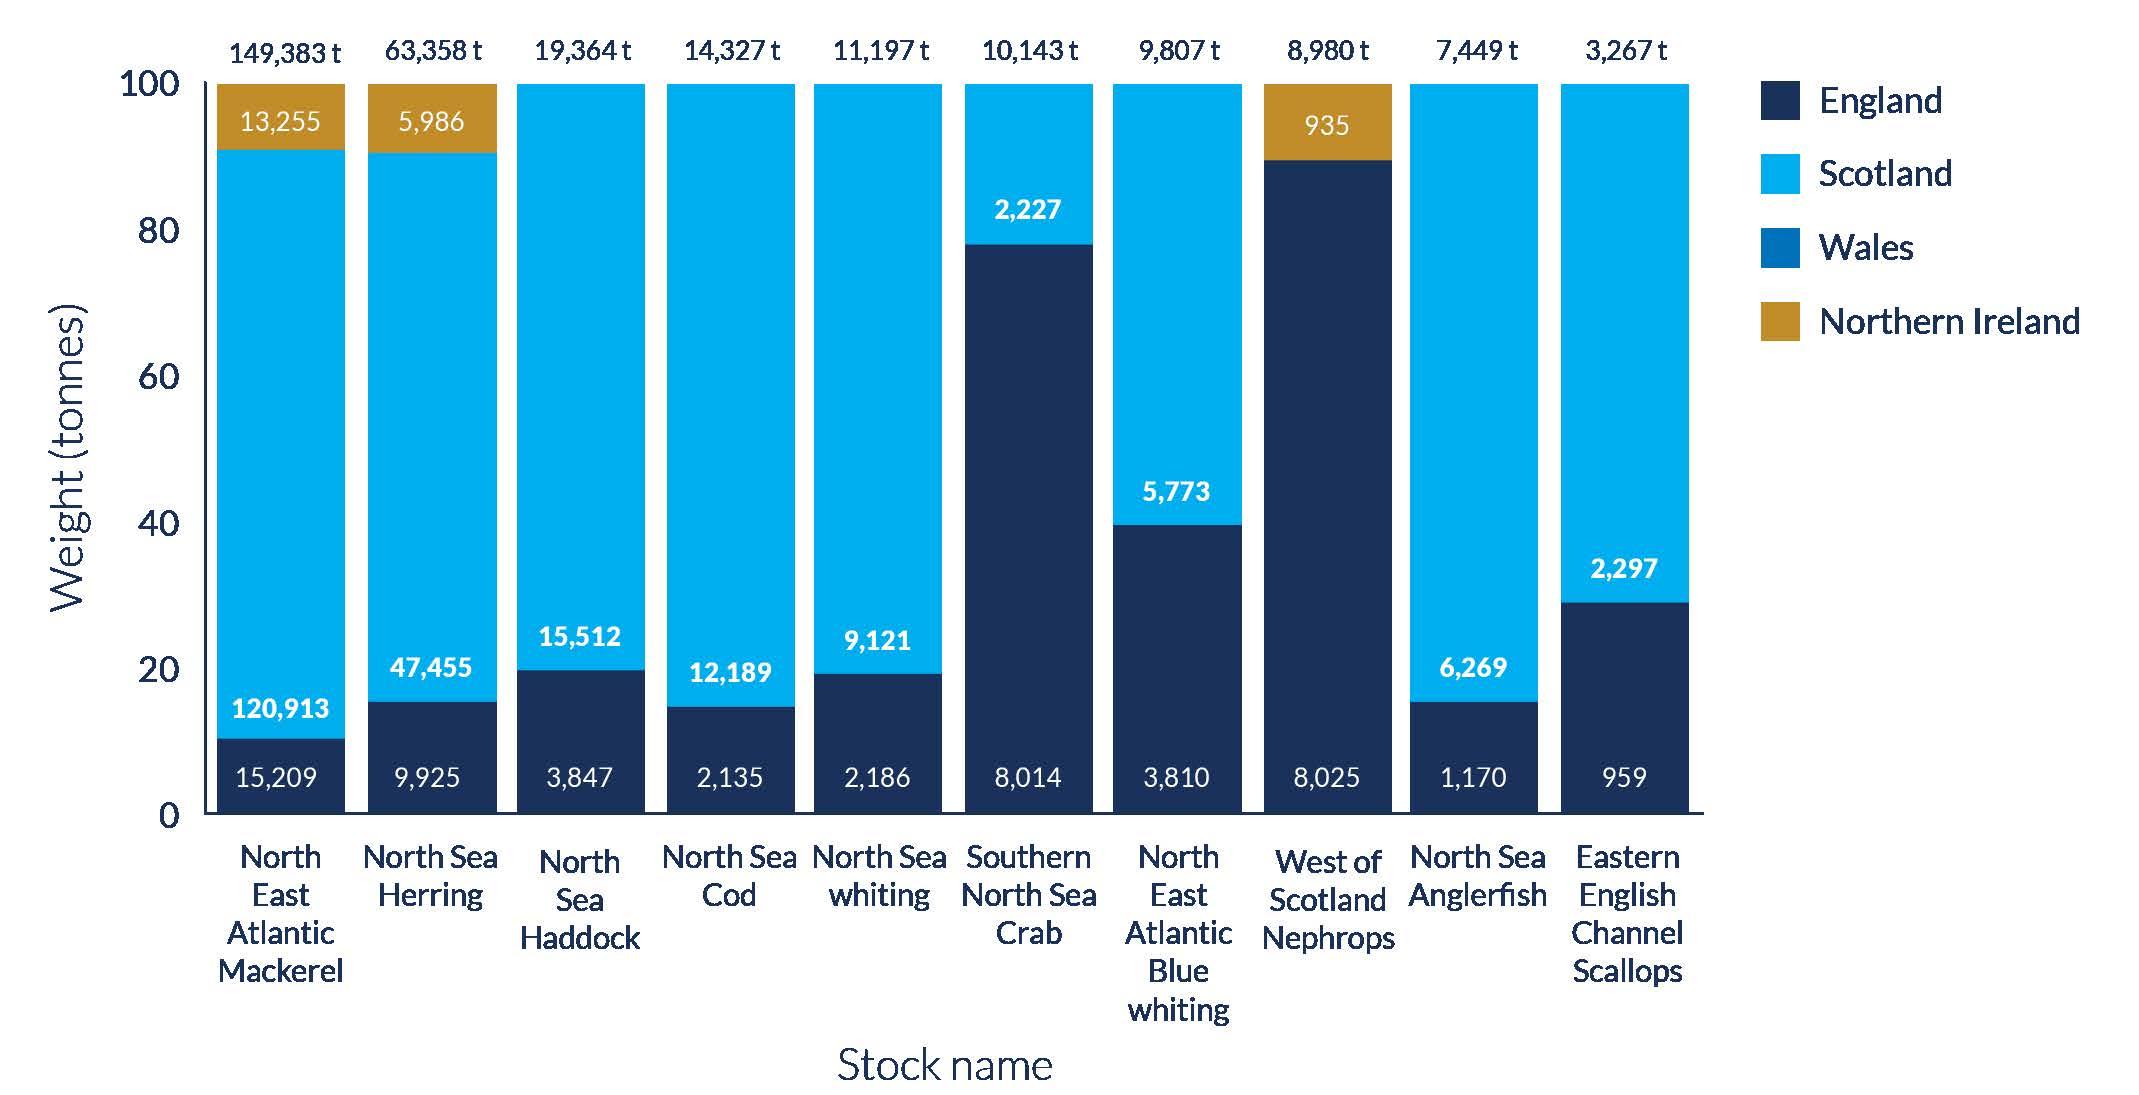
average between 2012-2016hh nearly 441,000 t of mackerelii were landed from catches in the North East Atlantic, 72% of which was caught within the UK EEZ by foreign and UK vessels. UK vessels caught
ff Advised TAC in 2019 was 28204 t, TAC set at 35357 t (total of TACs for North Sea, Skagerrak and Eastern English Channel management units, in alignment with ICES stock area). ICES landings + discards for three TAC areas estimated at 35685 t. UK % share of unsustainable landings based on overall % quota share of three TAC areas (31%). Total landings for 2019 15645 t for UK vessels fishing in ICES Divisions 4a, 4b, 4c, 7d
gg Advised TAC in 2019 was 1,143,629 t for all fishing nations (EU, Norway, Faeroes, Iceland). ICES catch estimate 1,478,358 t. UK received 4% share of overall (sum of unilateral) TAC (rather than relative stability share of EU TAC). Total blue whiting landings in 2019 for UK vessels 60,791
hh Data on non-UK catches in the UK EEZ are only available from MMO statistics (https://www.gov.uk/government/statistics/uk-commercial-seafisheries-landings-by-exclusive-economic-zone-of-capture-report-2019) as an average for the period 2012-2016 and only in an aggregated form.
ii Also includes catches associated with the North Sea mackerel stock (MAC/2A34)
MANAGEMENT UNIT ESTIMATED TOTAL WEIGHT (TONNES) OF UNSUSTAINABLE CATCHES IN 2019 ESTIMATED WEIGHT (TONNES) OF UNSUSTAINABLE LANDINGS BY THE UK FLEET IN 2019 (AS % OF TOTAL UK LANDINGS) North Sea cod (COD/2A3AX4) ff 328 102 (<1%) North Sea whiting (WHG/2AC4) 8,434 5,651 (48%) North East Atlantic blue whiting (WHB/1X14) gg 339,579 13,583 (22%) 51 UK FISHERIES AUDIT 2021
Table 2: Approximate estimates of unsustainable landings in 2019
on average ~181,000 t of mackerel per year for the same period, although this is unsurprising as the UK is only allocated just over half of the TAC for this stock. The majority (92%) of North Sea herring landings originate from UK waters, but are largely caught by EU vessels. North Sea haddock, anglerfish and whiting landings are dominated by UK registered vessels and catches within the UK EEZ (on average, UK vessels caught around 24,000 t of haddock, 6700 t of anglerfish and 9500 t of whiting per year in UK waters between 2012 and 2016).
The Eastern English Channel scallop stock area includes the northern half of ICES subdivision 7d, where the main fishery covers a large bed which stretches across the mid-eastern part of the Channel, straddling the border between UK and France. In 2015 and 2016, landings by French vessels from this area were estimated to be approximately twice that of UK vessels34.
Value of landings
In line with the volume of landings, the annual value of mackerel caught by UK vessels in UK waters in 2019 was more than four times greater than any other species (£179 million) (Figure 26). However,
this dominance does not hold for price per tonne
(Figure 27). This trend is common as pelagic species are typically caught in high volume but receive lower prices.
52 UK FISHERIES AUDIT 2021
440,730 305,494 133,579 30,692 23,911 14,375 13,333 7,595 300,000 400,000 500,000 200,000 100,000 North
Atlantic
North
North
North
North
West
North
0 Weight (tonnes) 72% caught
EEZ 92% caught in UK EEZ 42% caught in UK EEZ 79% caught in UK EEZ 54% caught in UK EEZ 81% caught in UK EEZ 100% caught in UK EEZ 95% caught in UK EEZ
East
mackerel
Sea herring North East Atlantic blue withing
Sea haddock
Sea cod
Sea whiting
of Scotland nephrops
Sea anglerfish
in UK
Figure 25: Landings of UK and foreign vessels of the ‘top 10’ in weight (tonnes) in 2019
North Sea cod, West of Scotland Nephrops and North Sea herring had a similar overall value in 2019 (£34-£39 million) (Figure 26), yet West of Scotland Nephrops achieved the highest price per tonne by far (£4,279). As an iconic species, and one of the most important in UK commercial fisheries, cod also places relatively high when assessing price per tonne (Figure 27).
Anglerfish (monkfish) has a relatively low overall annual value in line with the relatively low volume of landings, although ranks second for the price per tonne (£3,150), reflecting its status as a popular, high value fish – and that the marketed product is primarily just the tail. Meanwhile, blue whiting ranks the lowest both in terms of overall value and by price per tonne, perhaps unsurprisingly as this species is generally used for fish meal and exported as a
lower priced source of food. However, this is also a reflection of the relatively low catches of blue whiting by the UK fleet in UK waters compared to wider EU and international waters.
The value of non-quota shellfish stocks to the UK fishing industry is illustrated by the contribution of just two management units of scallops and edible crab to the ‘top 10’, despite their relatively limited geographical distribution.
For the majority of the North Sea ‘top 10’ stocks, namely mackerel, haddock, cod, herring, blue whiting and whiting, Peterhead is the main port of landing, followed by Lerwick and Fraserburgh, all situated on the North East coast of Scotland. Therefore, these fisheries are of high socio-economic importance to those areas in terms of employment and income
53 UK FISHERIES AUDIT 2021 Southern North Sea crab North Sea anglerfish North Sea haddock North Sea herring West of Scotland nephrops North Sea cod North East Atlantic mackerel North East Atlantic blue whiting Eastern English Channel scallops North Sea whiting 179 39 38 34 27 23 21 14 7 4 0 20 40 60 80 100 120 140 160 180 Value (£ million)
Figure 26: Annual value (£ million) of the ‘top 10’ by UK vessels in 2019
from the entire supply chain, e.g. catching sector through to the processing and distribution sectors.
Port landings for West of Scotland Nephrops are spread over a larger geographic area, with key ports including Campbeltown, Mallaig, Stornoway and Troon. These shellfish fisheries are likely to add value
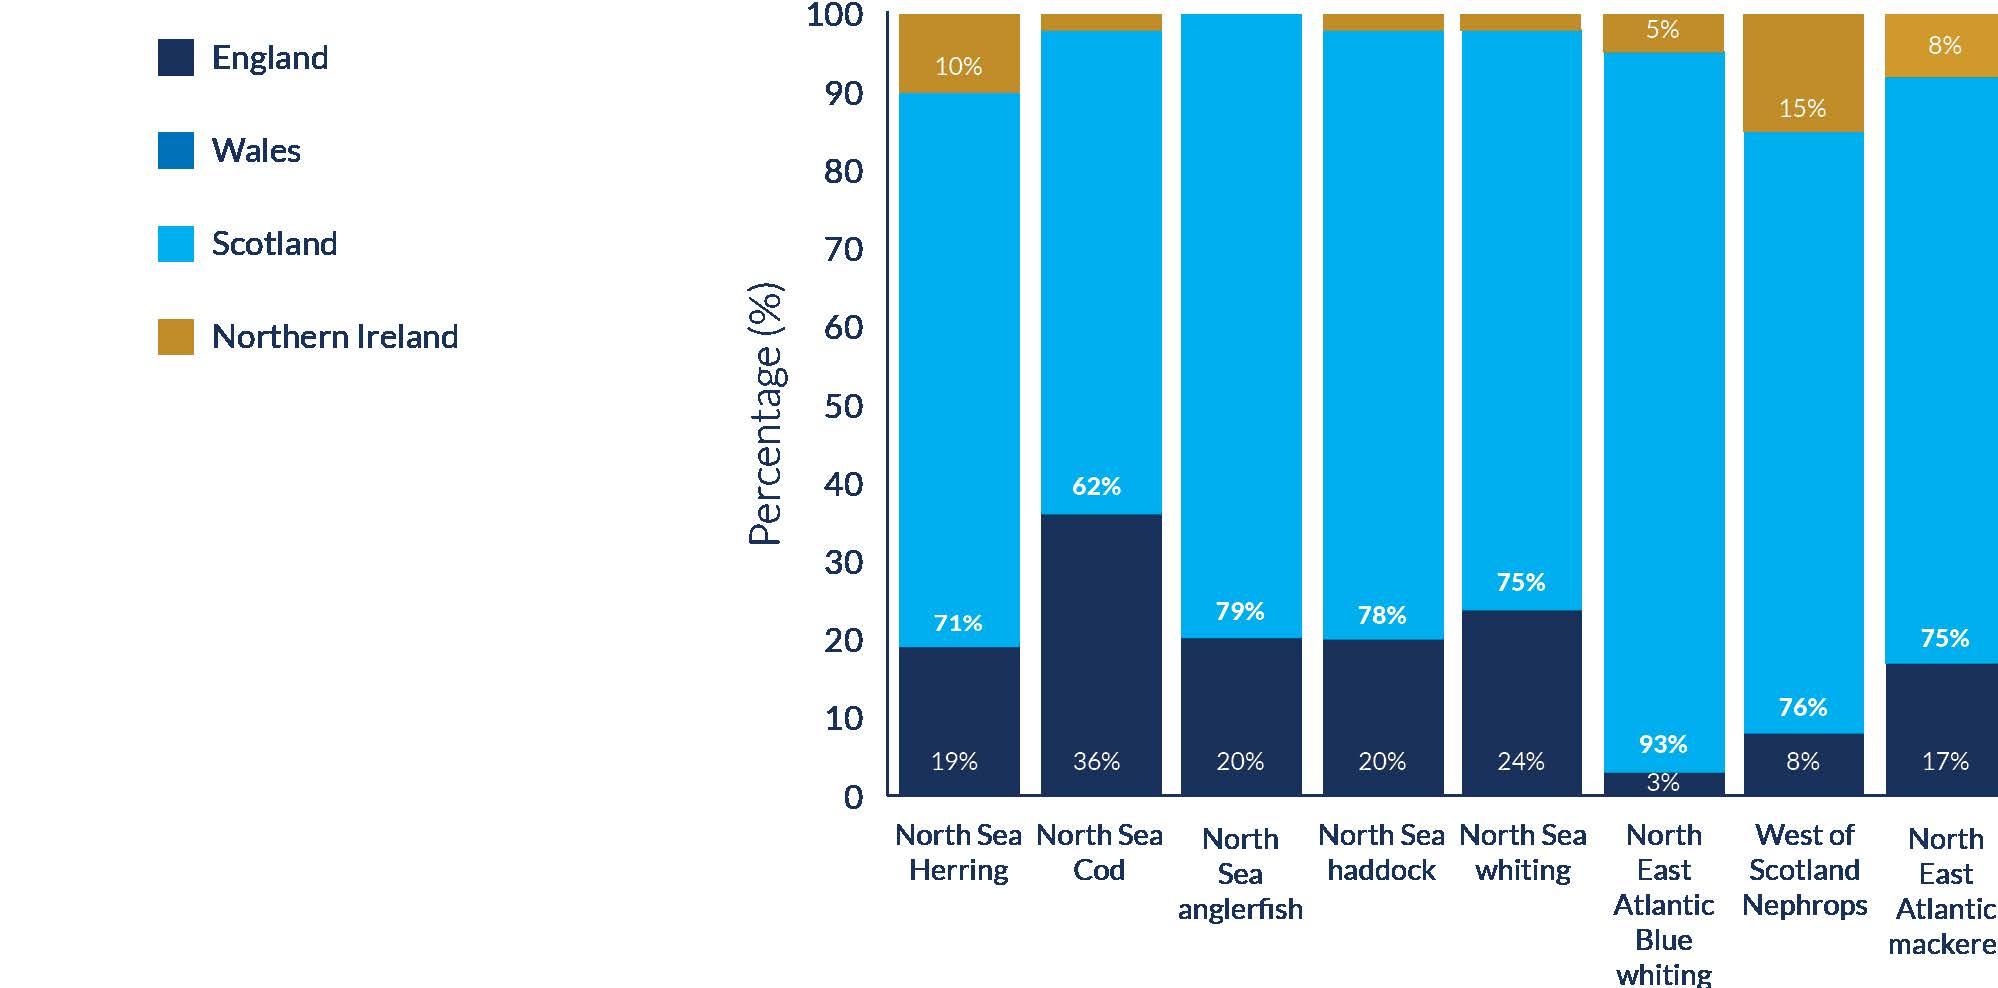
North Sea anglerfish
North Sea cod
Southern North Sea crab
Eastern English Channel scallops
North Sea haddock
North Sea whiting
North East Atlantic mackerel
North Sea herring
North East Atlantic blue whiting
to areas with limited additional industry. Key ports for Southern North Sea crab are likely to be Bridlington and Grimsby. It is more difficult to attribute scallop landings to a specific stock area because the fishery is in part comprised of large (≥15m) nomadic vessels34
54 UK FISHERIES AUDIT 2021
4,279 3,150 2,783 2,163 2,083 1,428 1,277 1,204 537 362
4,279 3,150 2,783 2,163 2,083 1,428 1,277 1,204 537 362
West of Scotland nephrops
Figure 27: Price (£) per tonne for the ‘top 10’ in 2019
National quota distribution
In alignment with the national distribution of landings, Scotland receives the largest proportion of quota between the four fisheries administrations (Figure 28)jj . The largest proportion appointed is for North East Atlantic blue whiting (93%), although Scottish landings represent approximately 60% by weight (Figure 24), suggesting for example a notable amount of domestic and/or international swapping of quota
4.3.2 Best performers
All five top performing stocks (Irish Sea herring and haddock, North Sea megrim and plaice, Western English Channel sole) currently have healthy stock sizes, are sustainably exploitedt and have been for the past three years. In addition, there was high confidence in these indicator assessments as they are ICES ‘data sufficient’ stocks with defined MSY reference points. All five stocks are shared with the EU fleetkk
Advised versus prescribed TACs
The implications of this analysis are considered as part of Case Study 1 (Section 5).
All top performing stocks, with the exception of North Sea megrim since 2018 and Irish Sea haddock in 2016, had their TACs set at levels advised by ICES or below. A notable improvement in decision-making
for this stock. England receives the second largest proportion of quota, however still considerably less than Scotland with the largest share being 36% for North Sea cod. Again, the landings values indicate a different end of year distribution of fishing effort compared to the starting allocations. Northern Ireland receives between 1% and 15% for each stock with the largest share assigned to West of Scotland Nephrops, whereas Wales is allocated a tiny fraction (0-0.2%).
was evident for Irish Sea haddock between 2016 and 2017, which has since been maintained (Figure 29). The current trend in TAC setting for North Sea megrim needs to be monitored, including impacts on the stock.
Irish Sea herring
North Sea megrim
Irish Sea haddock
North Sea plaice
Western English Channel sole
jj King scallops and crabs are non-quota species, hence are not included in the analysis kk North Sea plaice is also shared with Norway
55 UK FISHERIES AUDIT 2021
Figure 29: Difference between advised TAC and set TAC for the top performing stocks (2016-2020)
60 40 20 0 -20 2016 2017 2018 2019 2020 -40 Percentage difference (%)
National quota distribution
The UK’s quota for the two Irish sea stocks is largely allocated to the Northern Ireland fleet, whereas for the two North Sea stocks it is split in contrasting proportions between the English and Scottish fisheries administrations. Almost all the UK’s quota for Western English Channel sole is initially allocated to the English fleet. Once again, Wales hardly features in the quota allocation for these stocks (Figure 30).
Landings in 2019
In comparison with the majority of the ’top 10’ stocks, UK landings (in UK waters) are considerably less for the five top performing stocks (Figure 31). The highest landings in 2019 were for Irish Sea herring (4,479 t) which, if compared to the ‘top 10’ stocks, would fall second to last.
Landings of Irish Sea haddock in 2019 were only around 740 t for the UK fleet, however this is significantly more than 2013-2016 during which time landings increased from 100 to 480 t. There are indications that it is becoming an important fishery for the East coast of Ireland. Landings by the Republic of Ireland fleet have similarly increased in recent years and are considered a reflection of the stock’s recovery, which has been attributed to significant reductions in discarding of juvenile haddock by the Nephrops fishery following the introduction of more selective gear35
56 UK FISHERIES AUDIT 2021
60 80 100 40 20
North
0 Percentage (%) 20% 80% 75% 24% 98% 75% 16% 84% 19% 73% 7% England Wales Scotland Northern Ireland
Irish Sea herring North Sea megrim Irish Sea haddock
Sea
plaice Western English Channel sole
Figure 30: National quota distribution of the top performing stocks
5,000 4,000 3,000 2,000 1,000 Irish Sea Herring North Sea megrim Irish Sea haddock North Sea
Western
Channel common sole 0 Weight (tonnes) England Scotland Wales Northern Ireland 1,025 3,454 761 1,640 908 1,246 739
Figure 31: Landings (tonnes) of UK vessels in UK waters of the top performing stocks in 2019
plaice
English
Similarly to the 10 focus stocks, the initial distribution of UK quota across the four fisheries administrations (Figure 30) did not necessarily translate to the total landings (Figure 31). This was most obviously the case for North Sea plaice. For example, whereas England received 75% of the plaice quota, English registered vessels landed 32% of the total landings compared to Scotland’s 68% after an initial allocation of 24% of the UK quota.
Value of landings
Western English Channel common sole yielded the highest annual value and price per tonne of all the focus stocks by a significant margin in 2019 (£12 million value; £13,366 per tonne) (Figure 32 and 33). This is likely down to the very strong market demand, particularly from mainland Europe. Brixham, Newlyn and Plymouth are the key ports at which this stock is landed, all of which are well placed for exporting.
North Sea megrim and Irish Sea haddock both had an annual value of around £4 million in 2019, yet the price per tonne for megrim was considerably higher than haddock and was comparable to many stocks in the ‘top 10’. Herring (similarly to blue whiting) is a cheaper source of food protein, most of which is exported to Norway or the Netherlands, receiving the lowest price of £422 per tonne in 2019.
Similarly to the ‘top 10’ stocks, North Sea megrim and North Sea plaice are predominantly landed at Peterhead and Lerwick. Irish Sea Haddock and Irish Sea herring have differing key ports, the former being Kilkeel, and the latter being Belfast and Ardglass.
57 UK FISHERIES AUDIT 2021 North Sea megrim Western English Channel common sole North Sea place Irish Sea herrings Irish Sea haddock 12 4 4 2 1 02468101214 Value (£ million)
Figure 33: Price (£) per tonne for the best performing stocks in 2019
Western English Channel common sole £ 13,366 / t North Sea megrim £ 3,166 / t Irish Sea haddock £ 1,614 / t North Sea plaice £ 1,440 / t Irish Sea herring £ 422 / t
Figure 32: Annual landings value (£ million) for the best performers in 2019
4.3.3 Worst performers
All five worst performing stocks (all shared with the EU fleetll: North Sea and Eastern English Channel cod, West of Scotland cod, Celtic Sea cod, North East Atlantic horse mackerel, Irish Sea whiting) currently have critical stock sizes, are unsustainably exploited and have been for the past three years. In addition, there was high confidence in these indicator assessments as they are ICES ‘data sufficient’ stocks with defined MSY reference points.
Advised versus prescribed TACs
The overall picture for the five worst performing stocks is one of the advised TACs being exceeded, particularly for Celtic Sea cod and North East Atlantic horse mackerel early in the time series and North Sea cod more recently (Figure 34). North Sea cod has been subject to a renewed period of recovery measures since 2019. Whilst not plotted, the recurrent scientific advice for zero catches of Irish Sea whiting and West of Scotland cod, as well as Celtic Sea cod in 2019 and 2020, have also been exceeded through the setting of bycatch TACs (see Section 4.3.4 and Case Study 1 in Section 5 for further discussion).
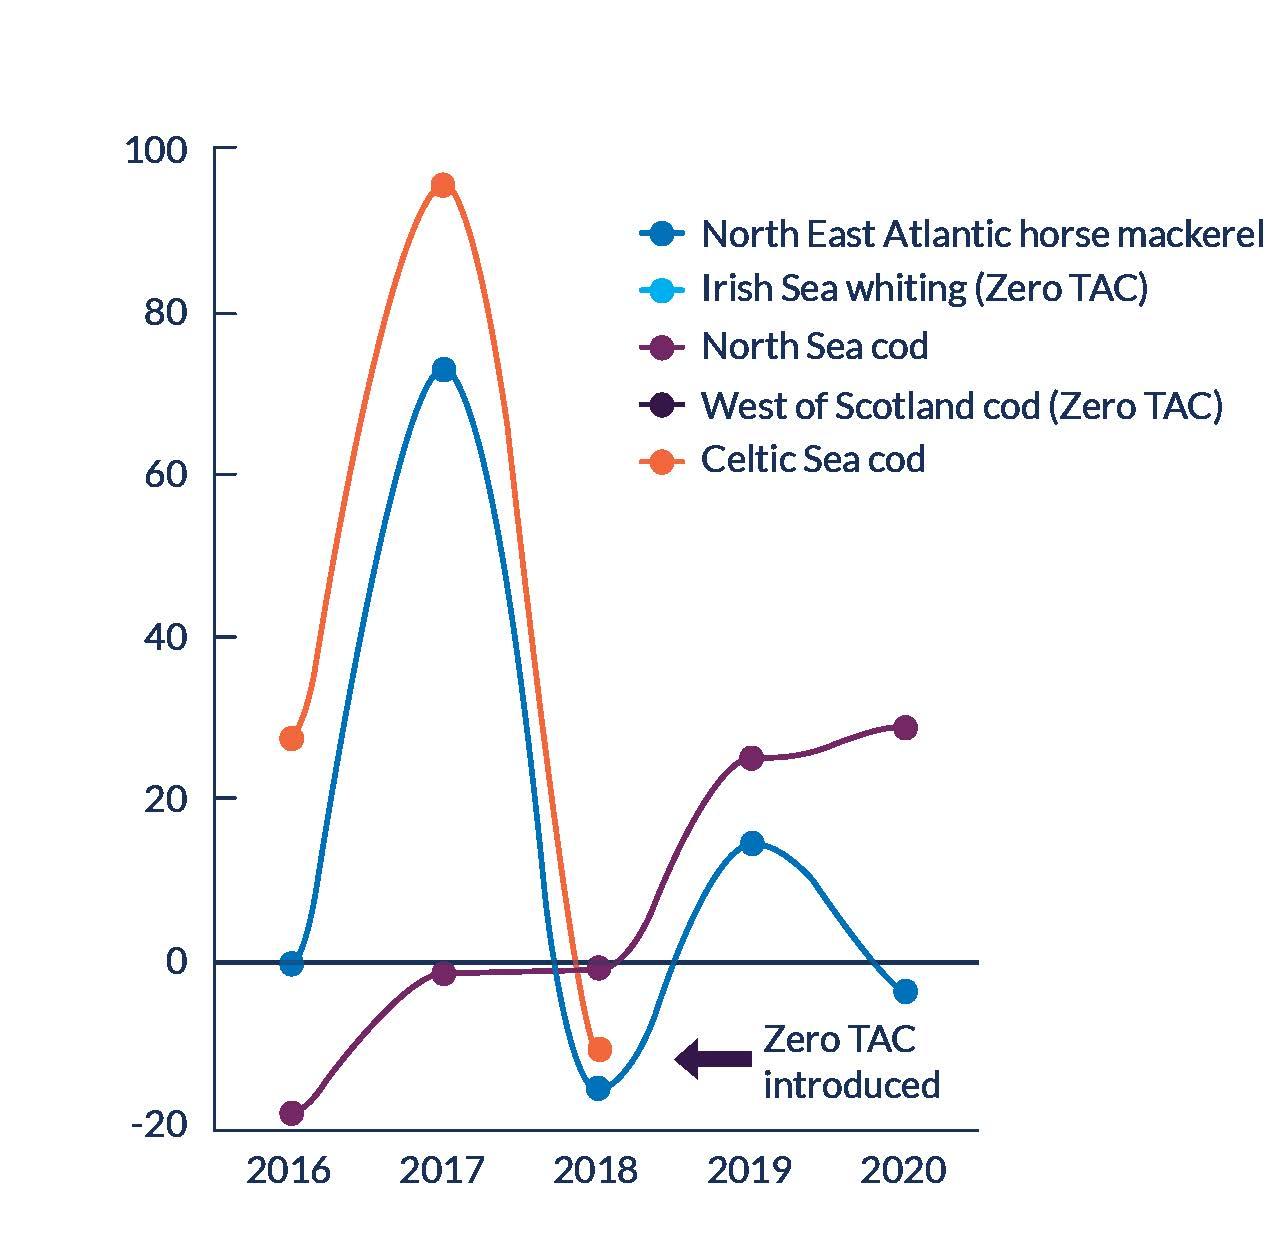
National quota distribution
The majority of the UK’s quota for the worst performing stocks is held by Scotland and England, with the exception of Irish Sea whiting which is allocated to Northern Ireland. Again, Wales has at most a tiny share of the fishing opportunities for these select quota stocks (Figure 35).
58 UK FISHERIES AUDIT 2021
Figure 34: Difference between advised TAC and set TAC for the worst performing stocks (2016-2020)
ll The TAC for North Sea cod is also shared with Norway and the TAC for North East Atlantic horse mackerel is also shared with the Faroe Islands
Landings in 2019
With the exception of North Sea cod, UK landings of the worst performing stocks are relatively low (Figure 36). For Celtic Sea cod, West of Scotland cod and Irish Sea whiting, the TAC is only permitted to cover bycatches of these depleted stocks, which are mainly associated with the Celtic Sea mixed otter trawl fishery targeting haddock and whiting, the West of Scotland mixed demersal trawl fisheries targeting haddock, saithe and anglerfish and the West of Scotland Nephrops fishery, and the Irish Sea Nephrops trawl fishery,
respectively (see Case Study 2 in Section 5). The UK held a 47% relative stability share in North Sea cod which amounted in 14,327 t being landed in 2019. This was a decrease from the ~19,500 t landed in 2018, reflective of the recent decline in stock biomass and the associated recovery measures. The UK also held a relatively large share of the EU TAC for Irish Sea whiting and West of Scotland cod (45% and 60%, respectively), but for Celtic Sea cod and North East Atlantic horse mackerel the UK’s share of the TAC was minor (7% and 9% respectively).
59 UK FISHERIES AUDIT 2021
60 80 100 40 20 0 England Scotland Wales Northern Ireland North East Atlantic horse mackerel 38% 40% 21% Celtic Sea cod 84% 5% 4% Irish Sea whiting 15% 6% 78% North Sea cod 36% 62% West of Scotland cod 16% 71% 7% Percentage (%) 6.000 8,000 10,000 12,000 4,000 2,000 0 England Scotland Wales Northern Ireland North East Atlantic horse mackerel 1,575 583 1,579 Celtic Sea cod Irish Sea whiting North Sea cod 2,135 12,189 West of Scotland cod 1,193 Weight (tonnes)
Figure 36: Landings (tonnes) of UK vessels in UK waters of the worst performing stocks in 2019
Figure 35: National quota distribution of the worst performing stocks
Value of landings
The three cod stocks are associated with the highest annual prices of around £3,000 per tonne, whereas North East Atlantic horse mackerel fetched the lowest price at £645 per tonne (Figure 37). However, because landings of horse mackerel were notably higher than the bycatch only stocks (albeit still low relative to North Sea cod and the other ‘top 10’ stocks) (Figures 24 and 36), the relative ranking
of the worst performing stocks in terms of annual value in 2019 (Figure 38) does not follow the trend in price per tonne (Figure 37). Whilst once primarily destined for fish oil/meal production, in recent years fisheries for horse mackerel are targeting the human consumption market.
Value (£ million)
60 UK FISHERIES AUDIT 2021
Figure 38: Annual landings value (£ million) for the worst performers in 2019
Celtic Sea cod £ 3,139/ t West of Scotland cod £ 2,904 / t North Sea cod £ 2,783 / t Iris Sea whiting £ 928 / t NE Atlantic horse mackerel £ 645 / t West of Scotland cod North Sea cod Irish Sea whiting Celtic Sea cod North East Atlantic horse mackerel 40 4 2
010203040
Figure 37: Price (£) per tonne for the worst performing stocks in 2019
4.3.4 Concerned about cod?
Historically, cod has been one of the most important commercial fish stocks in the North Atlantic. A series of stock declines and collapses, linked primarily to unsustainable fishing pressure and more recently additive effects of unfavourable climatic conditions, have led to various management responses with variable - mainly unsuccessful - outcomes. The
objective of this section of the report is to provide a brief history of the successes and failures for this symbolic fish species in European waters, the demise of which poses significant ecological and socioeconomic consequences.
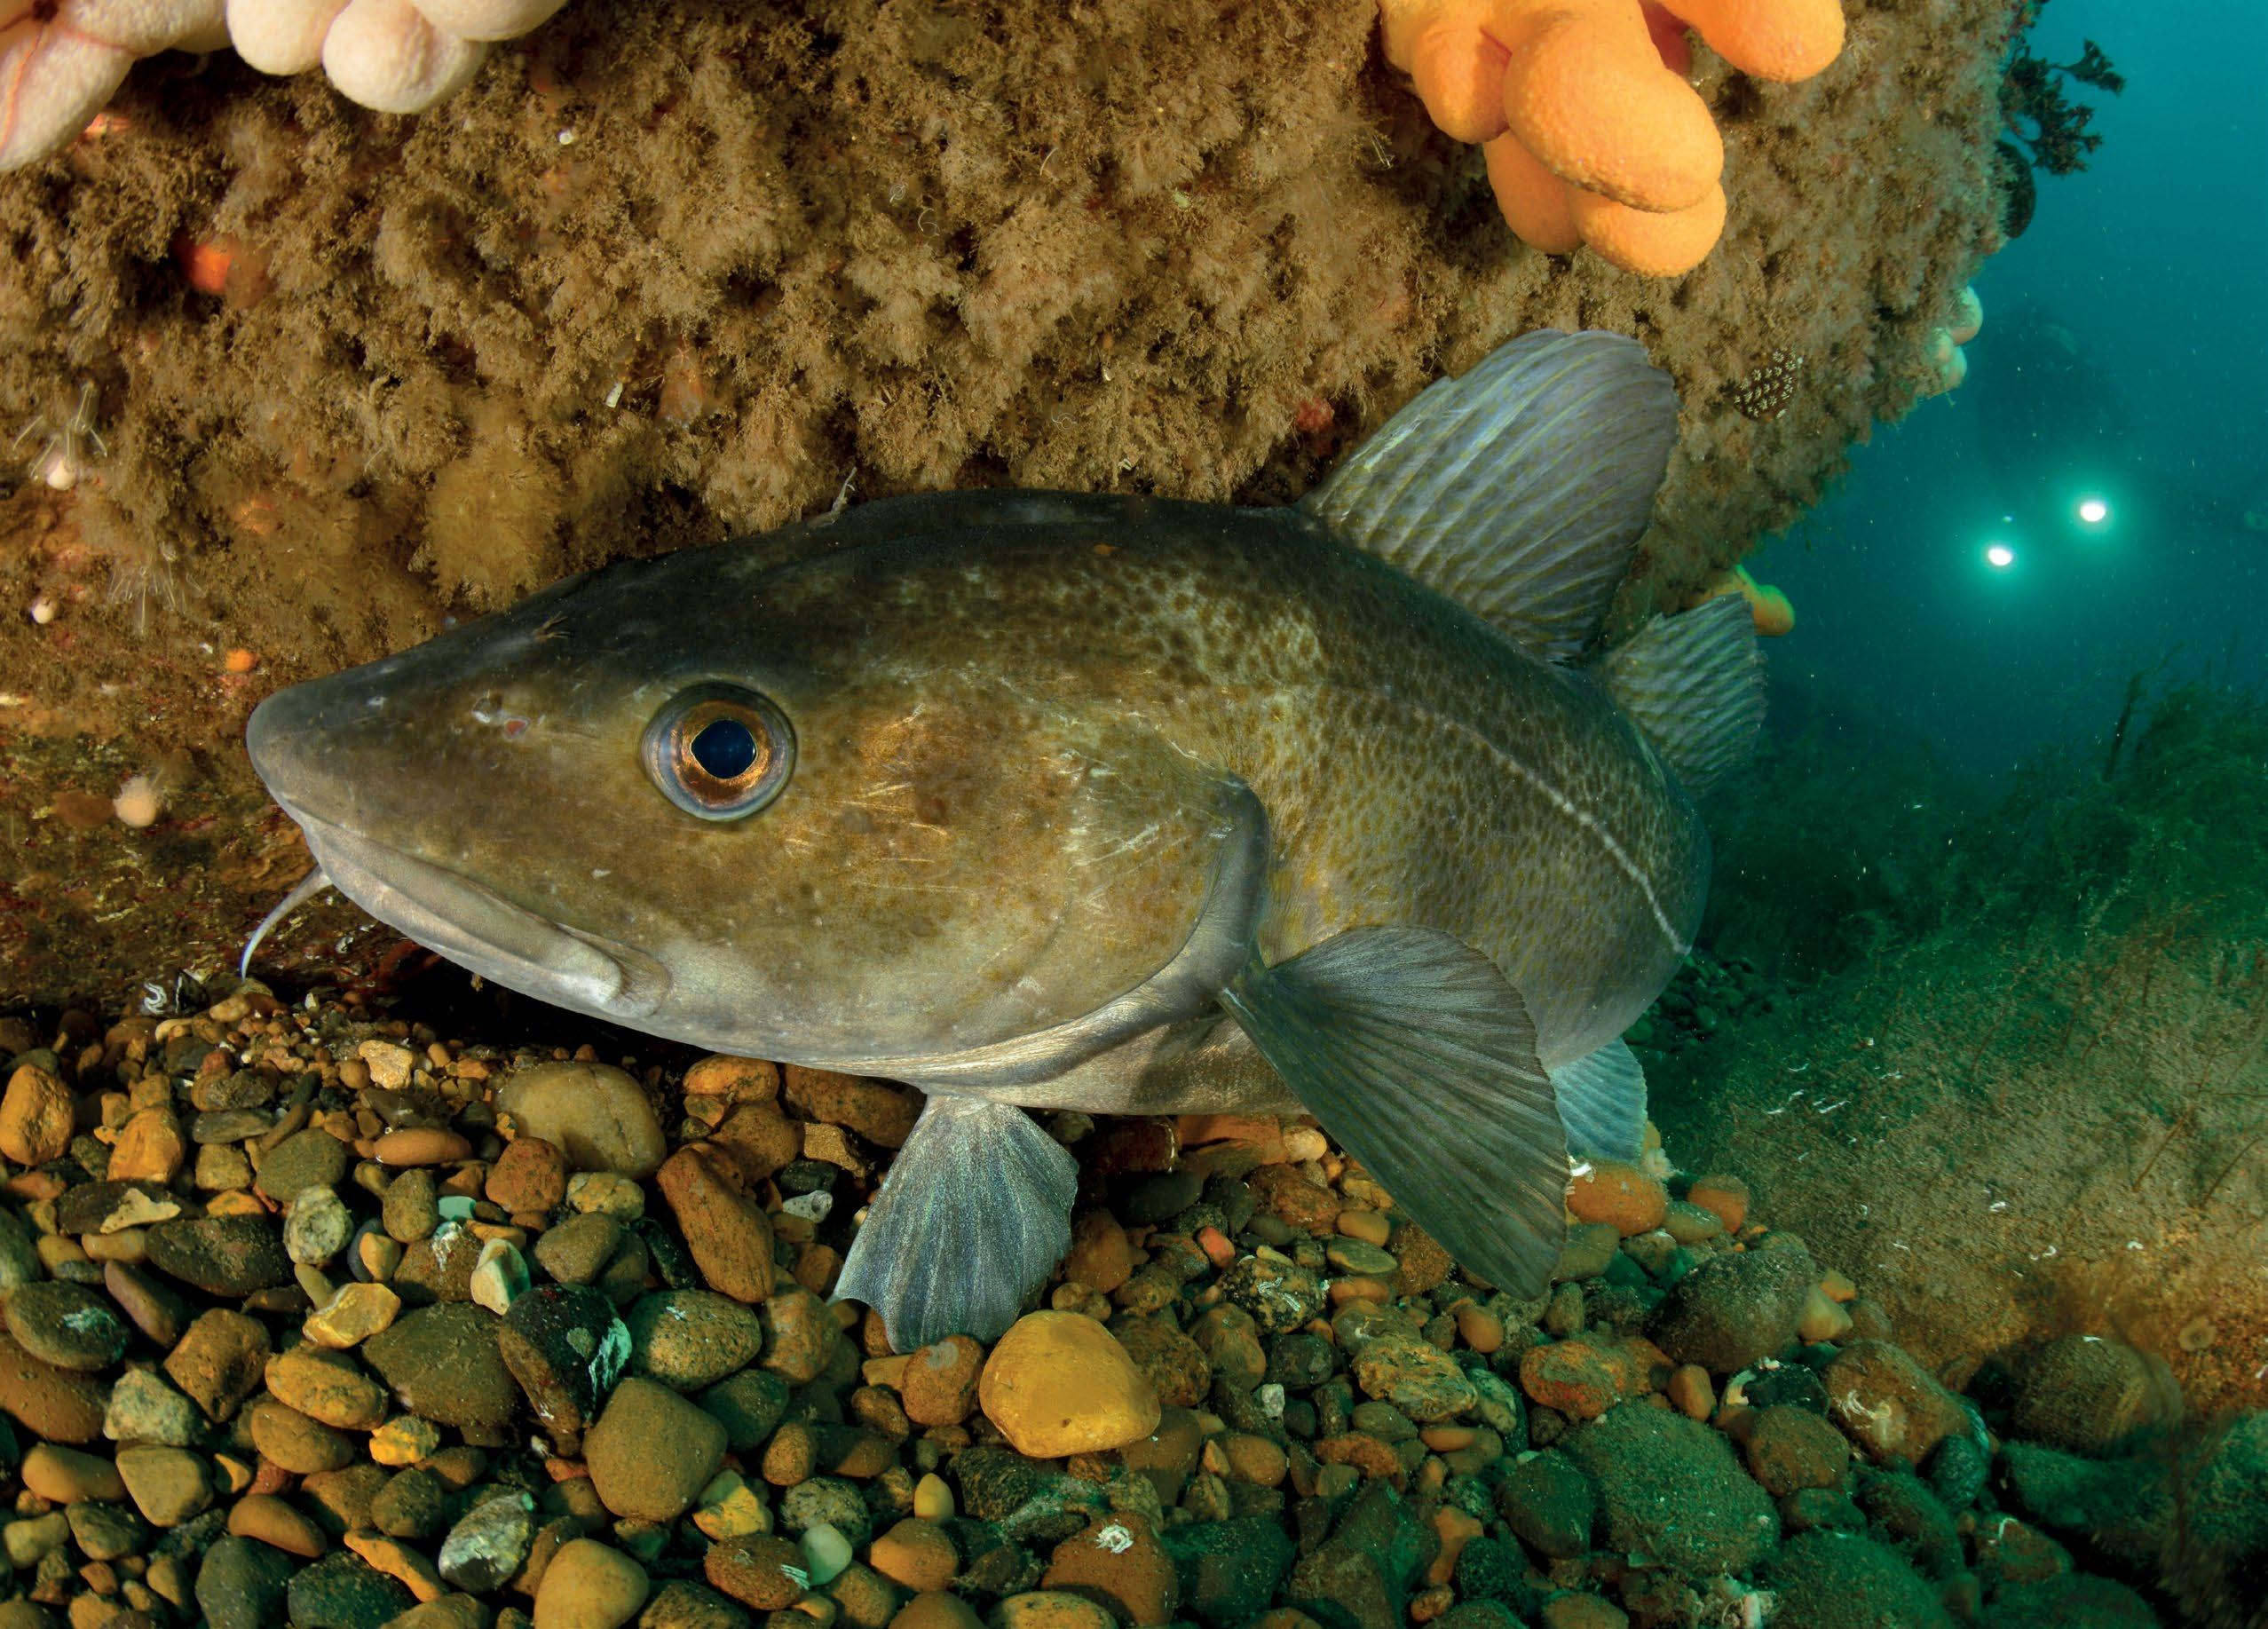
61 UK FISHERIES AUDIT 2021
© OCEANA / Carlos Minguell
Exploitation Status
North Sea
West of Scotland
Celtic Sea
Irish Sea
Exploitation Status
North Sea
West of Scotland
Celtic Sea
Irish Sea
Exploitation Status
North Sea
West of Scotland
Celtic Sea
Irish Sea
Critical / Overfished
Data limited
Stock Size
North Sea
West of Scotland
Celtic Sea
Irish Sea
Cod stocks across European waters are in a critical state according to scientific advice. Indicators of stock status and exploitation are ‘Critical’ and ‘Overfished’ for three of the four stocks (five management units) considered here - Irish Sea cod, however, does not have defined reference points (Figure 39).
In 2018-2019, UK consumers purchased around 59,300 t of cod with a retail value of over £480 million, making it the 3rd most popular seafood resource sold in retail (after tuna and salmon). It also topped the list of imported marine species by value36. Those figures are not limited to Atlantic
Stock Size
North Sea
West of Scotland
Celtic Sea
Irish Sea
cod, however, the importance of this speciesmm overall is shown by the UK landings and imports data. In 2018, cod imports to the UK predominantly originated from Iceland36, where Atlantic cod is sustainably managed, and imports from Norway and Iceland represented 38% of total cod imports by weight in 201919. Domestically, cod ranked 8th by weight (~16,000 t) for UK vessel landings from the UK EEZ in 2019 and 6th by value (£44 million). Less than 2% of cod was caught by 10 m and under vessels (Figure 7) and most was caught by the Scottish fleet (Figure 40). In terms of UK seafood exports, cod plays a lesser role, representing around 3% of the overall value and volume in 2018 and 201919,36
62 UK FISHERIES AUDIT 2021
Figure 39: History of cod stock status and exploitation status (same categorisation for each stock each year) 2016 – 2020 (exploitation status only to 2019)
2016 2017 2018 2019 2020
mm Atlantic cod (Gadus morhua) is one of several ‘cod’ species of imported into the UK
With climate change likely to be affecting cod’s resilience to fishing mortality, effective recovery plans are needed more urgently than ever. However, because the majority of the cod stocks are now primarily caught as bycatch in valuable fisheries, as discussed in Case Study 2 (Section 5), such measures will require a shift in the balance from socio-economic priorities to ones that are actively fighting the corner of healthy ocean ecosystems, although if done successfully the longer-term benefits would be less selective.
Irish Sea cod (COD/07A)
There has been a continuous decline in the Spawning Stock Biomass (SSB) of Irish Sea cod (ICES Division 7a) since the early 1990s, which is currently close to its lowest level (Figure 41). The stock, which is the edge of Atlantic cod’s southern limit, has been subject to increasingly restrictive advice on fishing mortality since the late 1980s, with zero catch advice since 2000, until 2018 and 2019 when there was a sudden jump up to 800-1000 t in
response to apparently positive trends in biomass and fishing mortality in the preceding years. However, a subsequent change in assessment methodology, downgrading of the stock’s data quality status and removal of the previously defined MSY reference points, coincided with advised catches in 2020 and 2021 falling to around 100 t37.
20,000 15,000 10,000 5,000 2015 2016 2017 2018 2019 0 Weight (tonnes) England Wales Scotland North Ireland 40 35 42 98 157 9,156 10,573 12,536 16,608 13,456 3,329 3,761 3,236 3,300 2,232
63 UK FISHERIES AUDIT 2021
Figure 40: Total volume of cod landings by devolved nation (2016-2019)
Relative Biomass 2.5 3.0 2.0 1.5 1.0 0.5 1993 1997 2001 2005 2009 2013 2017 0 Relative Fishing Pressure (F) 2.5 3.0 2.0 1.5 1.0 0.5 1993 1997 2001 2005 2009 2013 2017 0
Figure 41: Timeseries of relative biomass and fishing pressure for Irish Sea cod (19932019)
TACs are exclusively for bycatch; no targeted fisheries are allowed. In the years when ICES advised zero catches (e.g. 2016-17), small bycatch TACs (146 t) were set by the AGRIFISH Council. When advice changed in 2018, the TAC also increased notably but it remained below the assessment estimates. Since then it has crept up again to beyond that advised by scientists (Figure 42).
Catches of cod in the Irish sea are mainly associated with otter trawls fishing for demersal fish species and Nephrops, with Republic of Ireland and UK vessels largely responsible. The average discard rate is estimated to be around 30%, the majority of which are associated with the Nephrops fishery38 . The majority (~68%) of the UK’s share (29%) of the EU bycatch TAC went to the Northern Ireland fleet (Figure 43), for which reported landings ranged between 26 t in 2016 and 153 t in 2019.
Recovery measures were first introduced by the EU in 2000 in response to serious depletion of four cod stocksnn and have included seasonal and area-based closures to protect the spawning stock, technical gear (selectivity) measures and, until 2017, effort
North Sea, English Channel Irish Sea
West of Scotland (Zero TAC)
Celtic Sea, English Channel
restriction, along with a harvest control rule with the unmet objective of restoring the stock biomass to a minimum precautionary level at the same time as restricting variability in TACs39. Attempts to manage fishing mortality through the cod recovery planoo , which came to an end in 201840, are now enacted through the Western Waters MAP15 (since 2019) and other regulations such as the technical conservation ‘tech con’ regulation and North-Western Waters discard plan42
nn Irish Sea, West of Scotland, North Sea and Kattegat
oo Initially recovery plan Council Regulation (EC) No 423/2004 (https://eur-lex.europa.eu/legal-content/EN/TXT/ PDF/?uri=CELEX:32004R0423&from=EN), later replaced by long-term plan Council Regulation (EC) No 1342/2008 (https://eur-lex.europa.eu/ legal-content/EN/TXT/PDF/?uri=CELEX:32008R1342&from=EN)
64 UK FISHERIES AUDIT 2021
150 100 50 0 2016 2017 2018 2019 2020 -50 Percentage difference (%)
Zero TAC introduced Zero TAC before this point
Figure 42: Difference between advised TAC and set TAC for cod stocks (2016-2020)
Figure 43: National distribution of UK cod stock quota
60 80 100 40 20 North
0 England Wales Scotland Northern Ireland 36% 62% 2% 24% 8% 89% 6% 4% 75% 90% 6% 4% 17% 7% 76% 68% Percentage (%)
Sea English Channel West of Scotland Irish Sea Celtic
Sea, English Channel
West of Scotland cod (COD/5BE6A)
The biomass of West of Scotland cod (ICES Division 6a) has also declined over (at least) the last four decades and the stock shows no sign of recovery (Figure 44), despite the measures under the EU’s cod recovery plan and more recently the Western Waters MAP, etc (see Irish Sea cod). In response to very low recruitment since 2001 and SSB being below Blim since 1993, ICES has advised zero target catches since 2003, following years of restrictions on fishing mortality43.
2100 t and 4200 t since 2016, from a stock that is estimated to have had a SSB of between ~2500 and 6600 t for the same period (95% confidence interval range ~1500 to 8000 t)43. Landings by the UK fleet, predominantly Scottish vessels, have represented between 53-82% of official EU values in recent years, reflective of the UK’s 60% relative stability share and application of Hague Preference (see Section 2), as well as the internal quota allocation between the fisheries administrations (Figure 43).
Most cod landings are associated with the mixed demersal trawl fisheries targeting haddock, saithe and anglerfish, although cod only comprises around 1% of the total catches for this fishery. An estimated 45% of discards result from the Nephrops fleet, with the overall discard rate thought to be around 9%44. Area-misreported landings (catches taken in Division 6a but reported elsewhere) have been estimated to account for over 40% of the total landings in recent years. Unreported discarding of below minimum size cod, which under the Landing Obligation should have been landed since 2019, is also suspected45. ICES estimates total catches to have fluctuated between
As discussed in Case Study 2 (Section 5), Member States of the North Western Waters Regional Group are required to develop and implement a bycatch reduction plan for West of Scotland cod, as a condition to the bycatch TACs set by the AGRIFISH Council46. Progress to date has been criticised47, although the plan did include technical measures for the West of Scotland that have subsequently been incorporated into the discard plan42. The Scottish government and fishing industry are investigating further technical solutions, such as a bycatch avoidance tool48 and gear selectivity measures, the outcomes of which are not yet clear49.
65 UK FISHERIES AUDIT 2021
Spawning Stock Biomass (SSB) 12,000 14,000 16,000 10,000 8,000 6,000 4,000 1993 1998 2003 2008 2013 2018 2,000 Fishing pressure (F) 1.1 1.0 0.9 0.8 0.7 1993 1998 2003 2008 2013 2018 0.6
Figure 44: Spawning Stock Biomass and Fishing Pressure for West of Scotland cod (1993-2019)
Whilst the percentage difference between advised and agreed TACs cannot be calculated (due to zero catch advice), fishing pressure continues to be above MSY and precautionary reference points43. ICES advice on catch scenarios for zero TAC stocks estimates that if the advised TAC reductions in 2021 for West of Scotland haddock and particularly saithe (-1.5% and -21%, respectively) are implemented by the AGRIFISH Council, then a similar reduction in fishing mortality on cod will follow, and a 17-30% increase in SSB could be seen in 202244. These predictions illustrate that continuation of setting TACs above scientifically advised levels will not only be detrimental to the stocks themselves (Case Study 1, Section 5), but also those other species that are inadvertently associated with the fisheries in question.
Celtic Sea cod (COD/7XAD34)
Unfortunately, the picture does not get any more positive for cod in the Celtic Sea (ICES Divisions 7b-c, e-kpp) (Figure 45). The SSB has been below
Blim since 2017, and fishing mortality has not fallen below FMSY since the stock has been assessed, and has even been above Flim in recent years. Even with zero catch, the scientific advice for 2019 - 2021, the stock was estimated to be well below Blim in 2020 and is anticipated to stay that way in 202150. Significant overshoots of the advised TAC occurred prior to the zero catch advice (2016, 2017), with bycatch only TACs set by the AGRIFISH Council in response to the recent advice (807 and 805 t in 2019 and 2020, respectively).
Celtic Sea cod are mainly caught as bycatch in the mixed otter trawl fishery targeting haddock and whiting. Cod are caught by Irish, French, UK and Belgian vessels with the UK receiving 7% of the TAC under relative stability. Total catches were estimated at around 4700 t in 2015 declining to 1550 t in 2018, with typically in the region of 90% of the catch landed. UK (mainly English, Figure 43) landings have ranged between around 259 t in 2016 and 62 t between in 2019.
66 UK FISHERIES AUDIT 2021
Spawning Stock Biomass (SSB) 10,000 12,000 14,000 16,000 8,000 6,000 4,000 2,000 1993 1997 2001 2005 2009 2013 2017 0 Fishing Pressure (F) 1.10 1.15 1.05 1.00 0.95 0.90 1993 1997 2001 2005 2009 2013 2017 0.85
Division 7e also categorised as the Western English Channel.
Figure 45: Spawning Stock Biomass and Fishing Pressure for Celtic Sea cod (19932019)
pp
Unlike the other cod stocks considered in this report, Celtic Sea cod were not part of the former EU cod long-term plan. The stock now falls under the Western Waters MAP and selective gear measures are specified for certain fisheries in the Celtic Sea Protection Zone42, 51, although again little more has been achieved through the North Western Waters bycatch reduction plan. Seasonal closure of the Trevose Box, which includes the main cod spawning area in the eastern Celtic Sea, a fishing industry led initiative which has been implemented since 2005, is likely to have had positive effects. However, those have not been quantified52,53, and collectively these measures are evidently insufficient to buffer the continued level of fishing mortality across the whole stock.
North Sea cod (COD/2A3AX4)
The North Sea has long been the most important source of cod catches for the EU, with the UK holding a 47% share in the annual Union TAC. Given its contribution to the UK’s landings, North Sea cod features in the ‘top 10’ stocks but because of its status it is also one of the five worst performers (see Sections 4.3.1 and 4.3.3). The majority of the UK’s quota is held by Scotland (Figure 43), which resulted in over 12,000 t of cod being landed by Scottish vessels in 2019 and an additional 2,100 t by English vessels (catches in UK waters only), with an approximate value of £40 million.
However, those figures represent a 27% decrease by weight and 13% by value compared to 2018, because of recent cuts in the North Sea cod TAC in response to
67 UK FISHERIES AUDIT 2021 Spawning Stock Biomass (SSB) 90,000 100,000 110,000 80,000 70,000 60,000 50,000 1993 1998 2003 2008 2013 2018 40,000 Fishing Pressure (Age 2-4) 0.9 1.0 1.1 0.8 0.7 0.6 0.5 1993 1997 2001 2005 2009 2013 2017 0.4
Figure 46: Spawning Stock Biomass and Fishing Pressure for North Sea cod (1993-2019)
a decline in the stock’s statusqq. But such comparison greatly masks North Sea cod’s troubled past as whilst the SSB was estimated to be around 110,000 t in 2015/2016, it had been around 260,000 t in the early 1970s.
It is not the first time the stock has shown signs of overexploitation – the stock has been in the process of recovering since 2007, having reached a historical
low in SSB (reaching ~43,000 t in 2006). The current stock depletion has not quite reached those levels but given the rapid downward trend that has been observed since 2017, it is still possible (Figure 46). Regardless, the SSB of North Sea cod has likely been below MSY Btrigger since the early 1980s and below Blim since the late ‘80s, except for 2015 and 2016, with consistently low recruitment since the mid ‘90s54
qq The TAC decreased by 32% between 2018 and 2019 and then by 50% between 2019 and 2020 (although the EU had sought a reduction of 61% to which Norway did not agree: https://ec.europa.eu/fisheries/press/eu-and-norway-reach-agreement-fisheries-arrangements-2020_en).
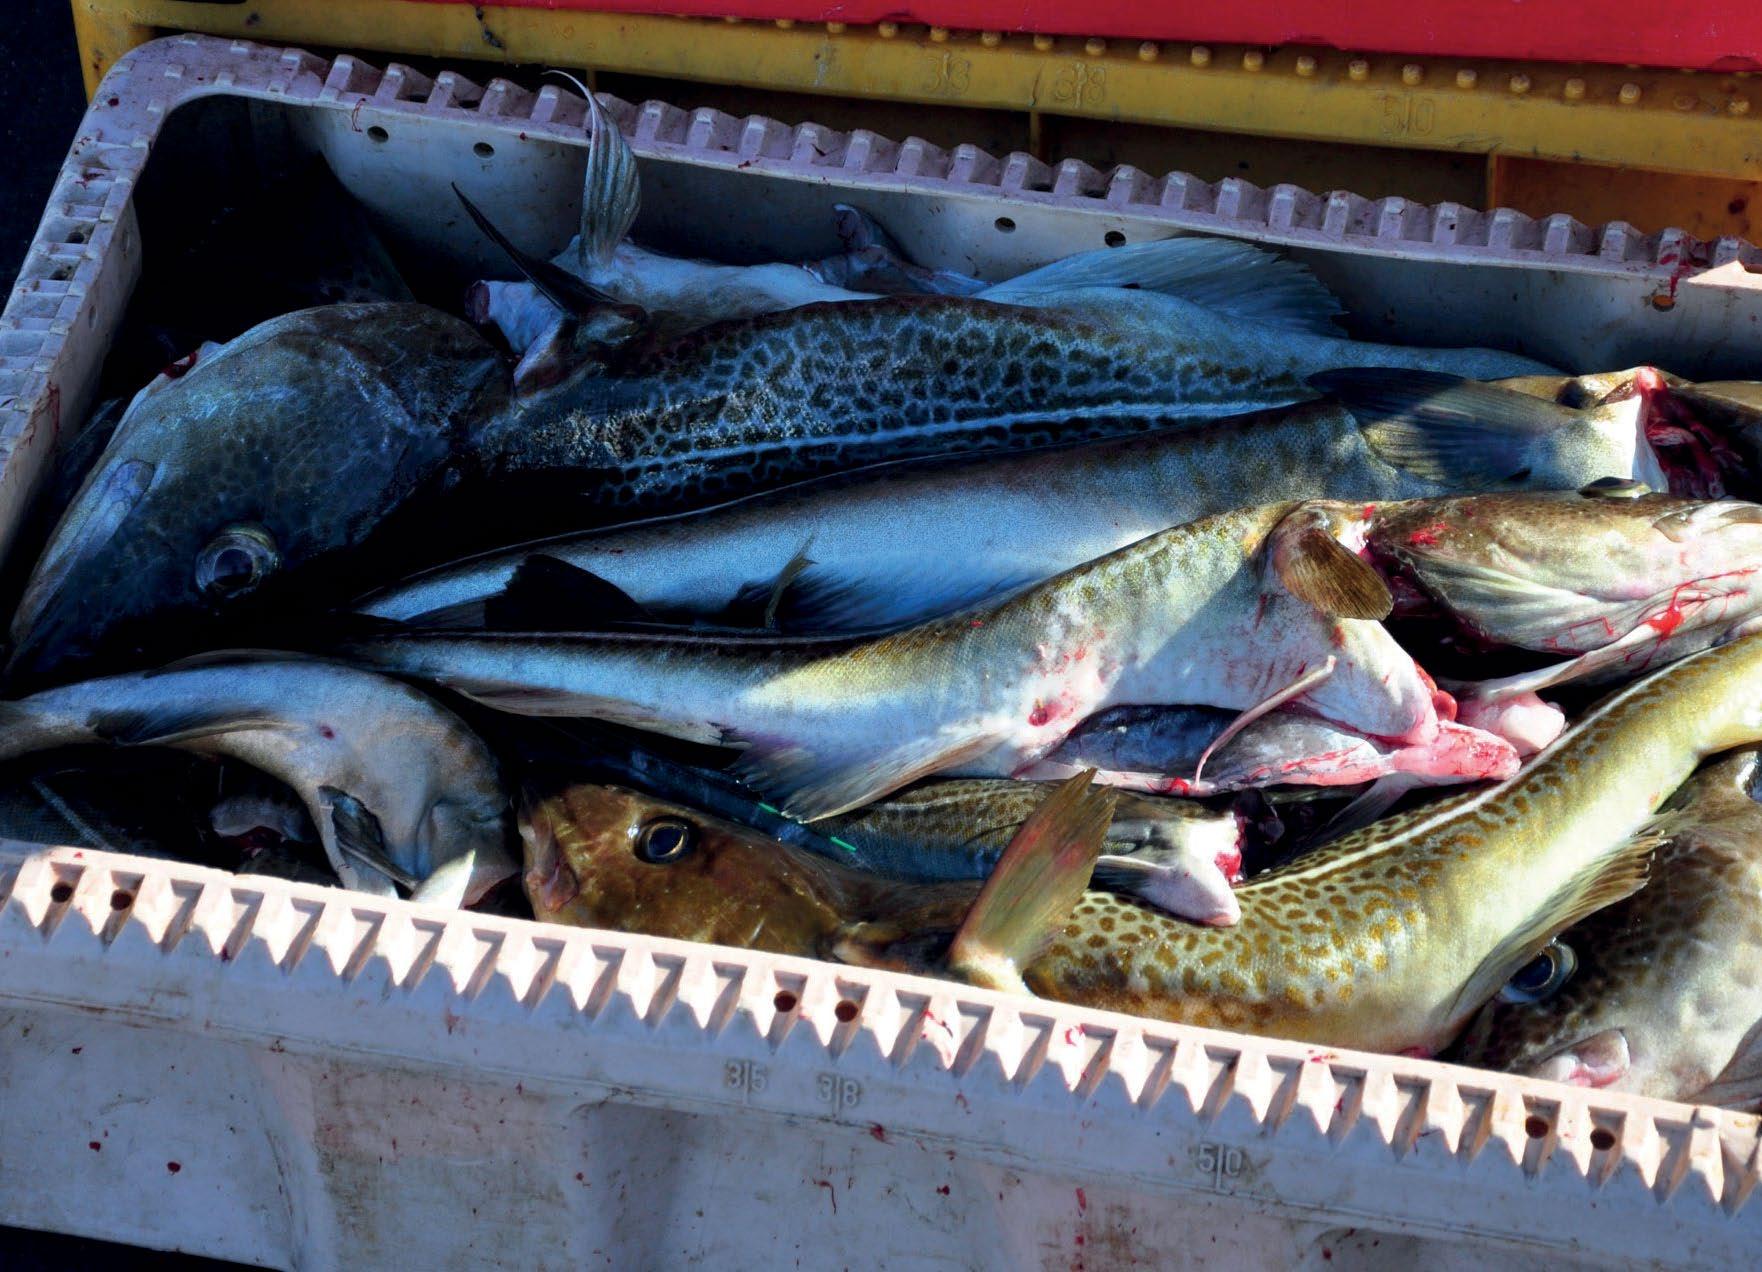
68 UK FISHERIES AUDIT 2021
© OCEANA / LX
Management measures in the 2000s under the cod recovery plan, which included restricted TACs, technical measures (e.g. more selective mesh sizes and area closures) and complementary effort management regulations, were hailed a success and in 2017 it was certified by the Marine Stewardship Council (MSC)55,rr. However, the EU’s long term management plan (which essentially replaced the original cod recovery plan in 2008)oo had been criticised because fishing mortality objectives were not met, largely due to inadvertent incentives created by landings quotas to continue overfishing and discard over-quota catchss and insufficiently restrictive effort limitations56,57.
The 2019 MAP for the North Sea establishes a mixed species management plan for the North Sea, with objectives that include reaching and maintaining MSY for target stocks, implementation of the landing obligation and an ecosystem-based approach to fisheries management14. Management measures, beyond the TAC reductionqq, are being developed and negotiated between the affected Member States, Norway and European Commission in response to the recent stock decline. There are encouraging signs of positive institutional-industry collaborations to find solutions58, including commitment by the Scottish fishing industry to a Fishery Improvement Project55 ,
which hopefully will draw on the lessons learnt from the previous management plans in order to set the stock on a speedy path to recovery.
In doing so, there are many complex factors that will need to be taken into consideration through the application of best available scientific evidence. These range from, for example, effective implementation of the discard ban in order that total mortality on the stock can be monitored and controlled, accounting for sub-population structure in order to avoid further loss of diversity and consideration of the role of climate change versus fishing pressure on cod distribution and recovery potential54,59,60.
rr MSC certification for North Sea cod was however suspended in 2019
ss North Sea cod are caught as part of a mixed fishery. Therefore, quotas based on landings rather than catches result in discarding of the more quota restricted species, whilst quota is still available for others caught in the mixed fishery. There is also no incentive for more selective catches under such a system.
69 UK FISHERIES AUDIT 2021
5.Environmental impact case studies
The purpose of this section is to consider five issues associated with UK fisheries and their management which have negative implications for the environment and sustainable fishing. In doing so, potential opportunities for improvements following Brexit, as well as further risks, are highlighted.
5.1
Case study: Advised versus prescribed TACs
A key legally binding commitment of the CFP is to end overfishing by 2020 by ensuring stocks are fished at a level that is MSY compatible. Whilst progress has been made, that objective has not be met in full because TACs have continued to be set above levels advised by the scientific community. The UK will have contributed to that failure as a member of the EU. However, the UK government promised to set ‘a gold standard for sustainable fishing around the world’ in the wake of Brexit. This can only be delivered by ensuring catches of shared stocks are fully aligned with scientific advice.
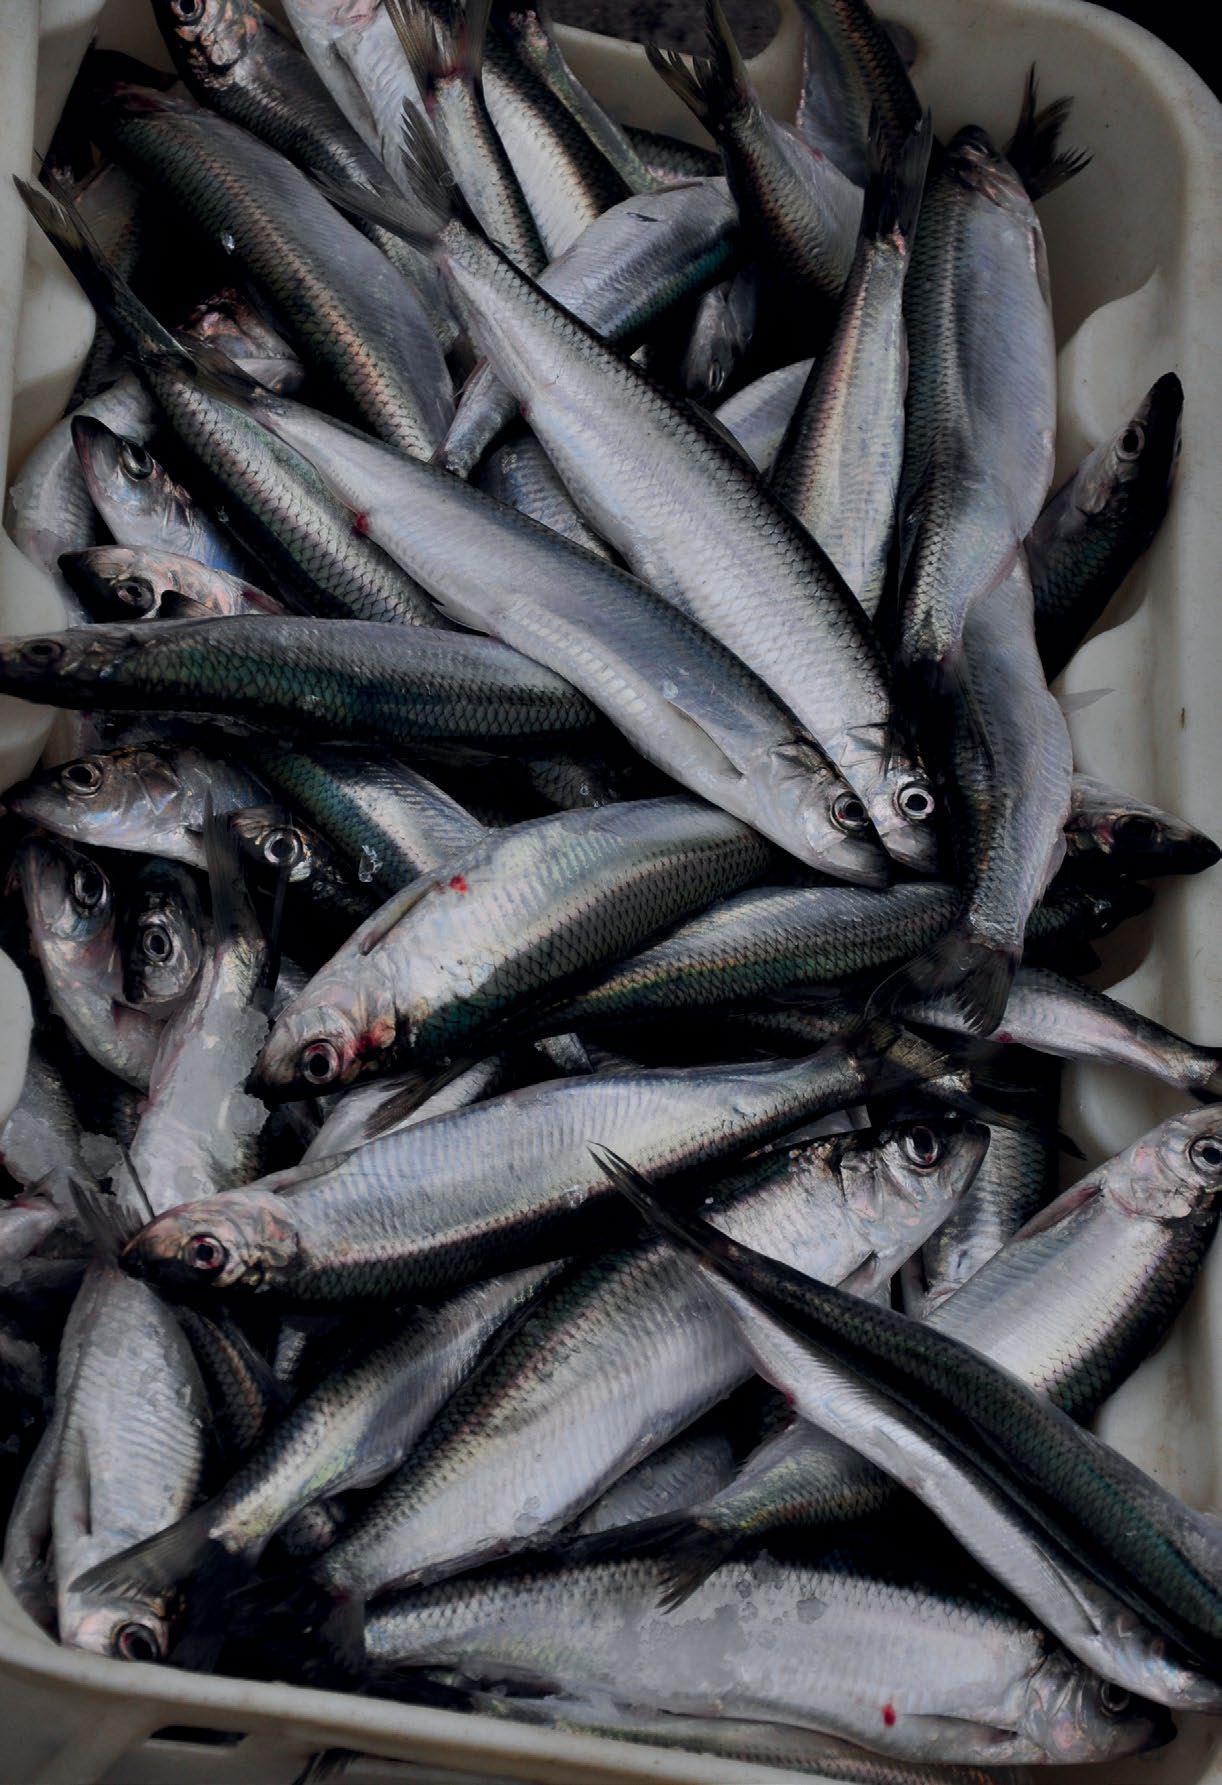
© OCEANA / LX
The key management method for fish stocks exploited by the EU fleet is output control through catch quotas – TACs. For most stocks shared by the UK, those TACs are set by the AGRIFISH Council during the annual December meeting, the result of the combined influence of the underlying scientific advice from ICES, the European Commission’s proposal and Member State’s contributions to the political negotiations. Previous reports have provided detailed analyses of the differences in advised versus agreed TACs.
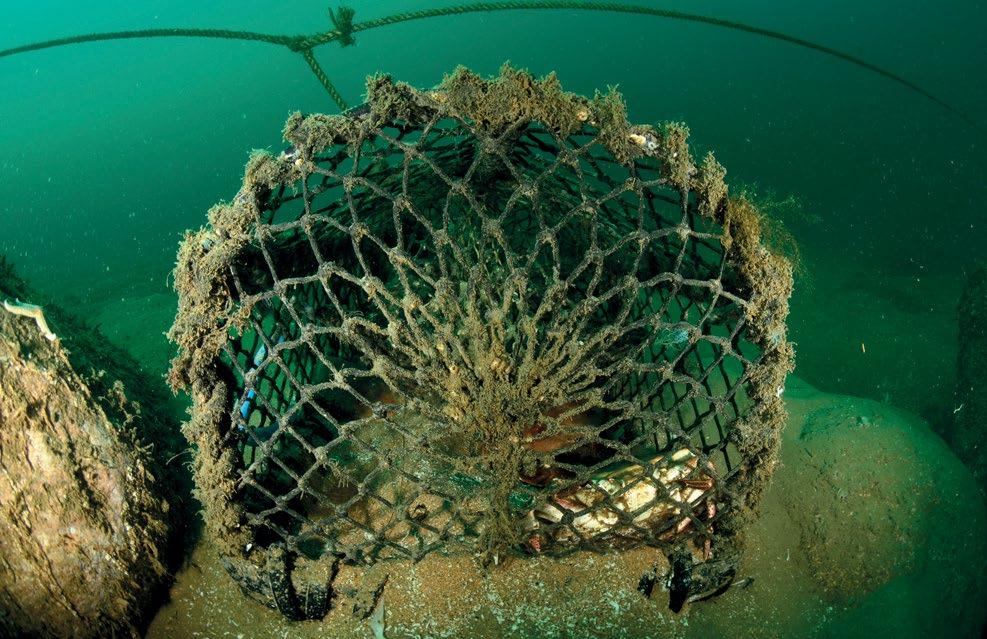
Based on their analysis of 2015-2020, ClientEarth10 found the percentage of set TACs that exceeded the scientific advice was 48% in 2020, although that ‘overshoot’ had dropped steadily from 73% in 2016. The magnitude of that overshoot (how much greater the agreed TAC was than the advised catch) had declined from ca. 13% in 2015 to 6%
in 2020, although prior to 2020 the overshoot was consistently multiple times higher than the % ‘undershoot’ (where TACs followed the scientific advice). A closer look at the figures revealed that for those stocks where advice is based on the ICES precautionary approach or its approach to data limited stocks, higher TACs were agreed than had been advised for 82-87% of stocks between 2015 and 2019 and 71% in 2020, whereas where the advice was based on MSY reference points this figure was 25% in 2020. Also, in 2020, the proportion of stocks where the advised TAC was exceeded continued to be considerably higher for economically less important bycatch stocks compared to target stocks, indicating lower ambitions for sustainability10. Further, zero catches and/or no targeted fisheries were advised for 15 depleted stocks in 2020. In all cases, that advice was exceeded61. An earlier study62 with wider geographical scope similarly found that 55%
71 UK FISHERIES AUDIT 2021
© OCEANA / Carlos Minguell
of agreed TACs were set above ICES advice in 2017 and that 30% of 2017 TACs were more than double the scientific advice. Therefore, whilst progress has been made in recent years, far more is still needed to ensure that TACs are aligned with scientific advice, despite the agreed – and missed – 2020 deadline to end overfishing10,61
Whilst a detailed addition to these comprehensive reviews was beyond the scope of this report, we have investigated advised versus agreed TACs for the focus stocks (see Section 4)tt. Those analyses have shown that for the UK’s ‘top 10’ and five worst performing stocks, the majority of TACs for the period 2016-2020 were above levels advised by ICES, with percentage differences varying from small (<5%) to significant (100%) depending on the stock and year. Whilst there was a mixed picture in terms of change over time overall, there appears to have been an improvement in 2019/2020, particularly for those stocks which had previously shown the most dramatic divergence from the advised levels. Worryingly, the notable exception to this trend was North Sea cod for which the TAC was 25-30% higher than the advised TAC (reduction) in recent years, following political negotiations between the EU and Norway (see Section 4.3.4).
Whilst the Irish Sea cod TAC is for bycatch only, it significantly exceeded the scientific advice in 2020, despite the worrying stock status. Similarly, although the percentage difference is not calculated as the advice was for a zero TAC, the permitted bycatch TACs for Irish Sea whiting, West of Scotland and Celtic Sea cod are clearly inconsistent with that
scientific advice. As discussed in Case Study 2 below, this is an illustration of the trade-offs in mixed fisheries.
All top performing stocks, except for North Sea megrim since 2018 (5-6% above advised TAC) and Irish Sea haddock in 2016, had their TACs set at levels advised by ICES or, commonly, below (3-34% below advised TAC) during the period 2016-2020.
Therefore, an important observation from these analyses was that there appeared to be a general relationship between current stock status and differences between advised versus prescribed TAC, with those stocks considered to be in better state and exploited sustainably having been subject to TACs that were largely set at or below the scientifically advised levels.
Quantification of the influence of different Member States on the decision-making process for unsustainable TACs has been attempted, but is difficult due to lack of transparency10. Whilst a few other Member States were ranked higher, the UK was identified as one of the more vocal countries in pushing for higher TACs. Further, comparison of the Member States with the highest percentage of their TAC in excess of scientific advice ranked the UK as 7th in 2020, with that placing increasing to 3rd by total excess tonnage (2.1%, amounting to 12,207 t). Whilst these figures vary between years, the UK has frequently featured in the ‘league table’ since 200163 .
Going forward, the UK will be negotiating quota with the EU in a very different capacity. Both parties
72 UK FISHERIES AUDIT 2021
tt Excluding the non-quota Southern North Sea crab and Eastern English Channel scallops
will negotiate annually to agree the TACs for shared stocks. Under this scenario, the UK voice has the scope to have a very different tone. Concerns64 are rapidly rising amongst the green community that the lack of firm environmental sustainable principles in the recent UK Fisheries Act1 (superscript), already absent in the original Fisheries Bill proposal65, will enable
the UK to seek - and set - unsustainable catch limits. Brexit still offers an opportunity for the UK government to actively demonstrate its ‘commitment to sustainable fisheries for future generations’ and to ‘set a gold standard for sustainable fishing around the world66 . The UK has a chance to put sustainability at the forefront of its independence and being a positive influence on catch limits is an obvious way to start.
5.2 Case study: Trade-offs in mixed fisheries
Fisheries that catch more than one fish species at a time are termed mixed fisheries. They can have advantages and disadvantages for both fisheries management and fishermen. Striking a balance between wanted and unwanted catch is inherently difficult in true mixed fisheries, particularly when the bycatch species should be subject to recovery measures. That is the dilemma facing decisionmakers over the management of several mixed fisheries in the Celtic Sea, West of Scotland and Irish Sea where bycatch species are subject to zero TACs and bycatch reduction has been specified by the AGRIFISH Council of the EU.
Member State unwillingness to meet this requirement has been apparent, with political reluctance to prioritise the environment over socio-economics clearly the stumbling block. This trade-off is particularly evident in the Irish Sea where fishing pressure from the Nephrops fishery is preventing the recovery of whiting but further selectivity
improvements, or other mortality reducing measures, would result in loss of revenue. The UK is now able to take its own independent decisions and if they are going to meet the vision for sustainability set out in the Fisheries White Paper, short-term losses may have to be shouldered by current fishermen for the sake of those who will come after them.
Few fisheries are truly ‘single stock’ operations or ‘clean’ in terms of their catches. For most, the catch hauled onto the vessel is typically a mixture of target and non-target species, the latter of which they may or may not be permitted to sell due to quota entitlements or minimum landing sizes, and/or may or may not want to sell due to market preferences and prices. Discarding of the unwanted portion of the catch has therefore always been a feature of these mixed fisheries. Bycatch and discarding pose a major threat to sustainable fisheries by negatively impacting
73 UK FISHERIES AUDIT 2021
biodiversity, fish populations, ecosystems, and contributing to overfishing67. In addition, discarding is considered a waste of resources, unethical and a loss of scientific information68,69,70. As a result, the EU fully introduced the Landing Obligation (LO) under the CFP in 2019 following a phased introduction. Under the LO, discarding of species subject to catch limits is not permitted except under certain conditions, and instead all catches must be landed and counted against quota allocations (where applicable)12 .
Significant concerns over the ongoing lack of tangible implementation of the LO by all Member States, including the UK, have been raised71. This has shone a brighter light on a key problem associated with the mixed fisheries which characterise the EU fishing industry – bycatch of weak stocks. Under the LO, these depleted stocks pose the greatest ‘choke risks’ to the affected fleets – whereby application of the LO would mean vessels have to cease fishing prematurely due to insufficient quota to cover their non-target catches. In recent years, some of the weakest stocks (West of Scotland cod and whiting, Celtic Sea cod and plaice, Irish Sea whiting), caught as bycatch in some of the UK’s most socio-economically important mixed fisheries, have received zero TAC advice from ICES and so have been subject to intense political discussions over mitigation measures for the resulting choke risks72.
Such negotiations have in part focused on options for allocating the ensuing bycatch only TACs amongst
the affected Member States. Those TACs are a key trade-off in mixed fisheries management as they are inherently linked to the potential catch of the more abundant (typically, but not always, target) species; the more limiting one must be, the more limited the other should be. However, scientific advice on mixed fisheries (rather than single stock assessments) to inform such decisions remains limited to a few stocks / fisheries73 ,74. These five zero catch advice stocks, mainly gadoids, are predominantly associated with the demersal trawl fisheries targeting haddock, saithe and anglerfish West of Scotland (cod, whiting) and anglerfish and megrim in the Celtic Sea (cod, also plaice74,uu), and the Irish Sea and West of Scotland Nephrops fisheries (whiting).
Essential to the TAC negotiations for these stocks was the requirement for Member States to jointly develop bycatch reduction plans through the North Western Waters Regional Group. The plans, which will need to include technical solutions46, have been heavily criticised47, 75. Therein lies another trade-off in mixed fisheries; where gear modifications could be introduced that reduce the unwanted catch, but at the same time result in losses of the target species which in the case of Nephrops may also include some fish catches67,76,77,78,79. The Irish Sea Nephrops fishery is a key example of this political dilemma.
Nephrops, also called Dublin Bay prawn, Norwegian lobster, langoustine and scampi, is a key commercial species for the EU fleet in the North East Atlantic.
74 UK FISHERIES AUDIT 2021
uu Also caught as bycatch by bottom trawls targeting gadoids, beam trawl and seine net fisheries
The UK fishing industry alone landed approximately 32,700 t in 2019, with a value of more than £109 million26. These fisheries are known for their bycatch issues and are therefore considered mixed fisheries; the North East Atlantic Nephrops trawl fishery was ranked as number eight among the top twenty fisheries with the highest recorded discard ratios and as number five based on gear type80. The scale of the bycatch issue may be greater in some areas when considering invertebrate bycatch. On one of the fishing grounds in the Clyde Sea area, Nephrops represented just 4% of the catch biomass on average, with fish discards representing 36% and invertebrates the remaining 60%81. A discard rate of 43%, with whiting representing 72% of the discards by weight,
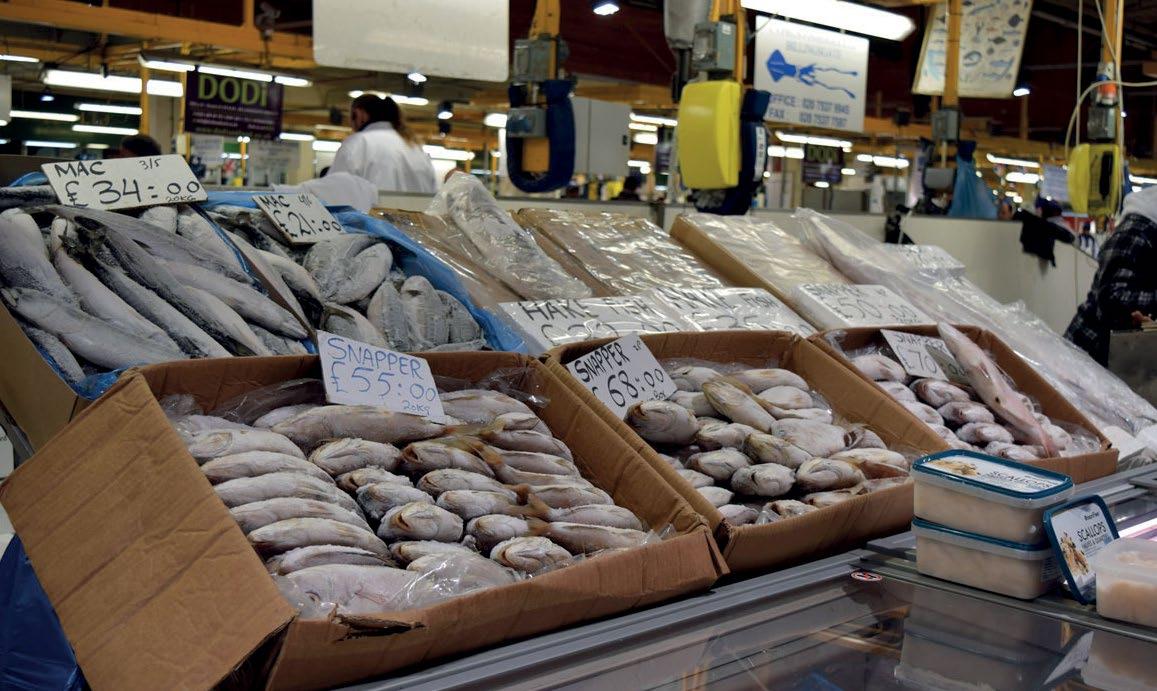
was reported for the Nephrops fishery off the NorthEast coast of England82. Regulations and innovation83 are striving for higher selectivity in these fisheries, but there is some way to go, and in the meantime the recovery of bycatch stocks continues to be hindered84.
Whilst the smallest of the three management (TAC) unitsvv, the Irish Sea (NEP/07) Nephrops fishery is an important fishery for Northern Ireland in particular85 , as well as the Republic of Ireland67. In 2019, 97% of the discards and 84% of the catch of Irish Sea whiting originated from the Nephrops-directed bottom-trawl fisheries, the majority of which was undersized (below the EU minimum conservation reference size). The whiting stock has remained well below Blimww since
vv EU waters of 2a and 4 (NEP/2AC4-C), 6; EU and int. waters of 5b (NEP/5BC6) and 7 (NEP/07)
ww The reference point Blim is the stock size below which there is a high risk of reduced recruitment
75 UK FISHERIES AUDIT 2021
© OCEANA / Yuri Smishkewych
the mid-1990s44. Whilst the introduction of highly selective gear requirements in the Nephrops fishery86 are thought to have reduced whiting catches in recent years, fishing pressure remains above the level which would enable the stock to rebuild87.
Further gear selectivity improvements, to reduce unwanted catches of juvenile whiting, have been trialled with promising results67. However, such changes may well be at the cost of wanted catch. Implementing them also requires further investment by the fishing industry in what has always been an uncertain business. So should selective gear requirements be voluntary, perhaps incentivised by for example additional quota, or should they simply be universally mandatory? And should that only occur when there is good understanding of their economic impacts or sooner on a precautionary basis, for example given the fragile state of the whiting stock? Does it ultimately have to come down to decision makers making, hopefully informed, judgements over trade-offs between socio-economics and ecology?
These politically sensitive decisions are even more complex when multiple players, with different interests and objectives, are involved. The UK’s independence offers an opportunity for the UK government to take tough decisions that tip the balance in the favour of the environment, because ultimately short-term pain for long-term gain is what will achieve ‘sustainable fisheries for future generations4 .
76 UK FISHERIES AUDIT 2021
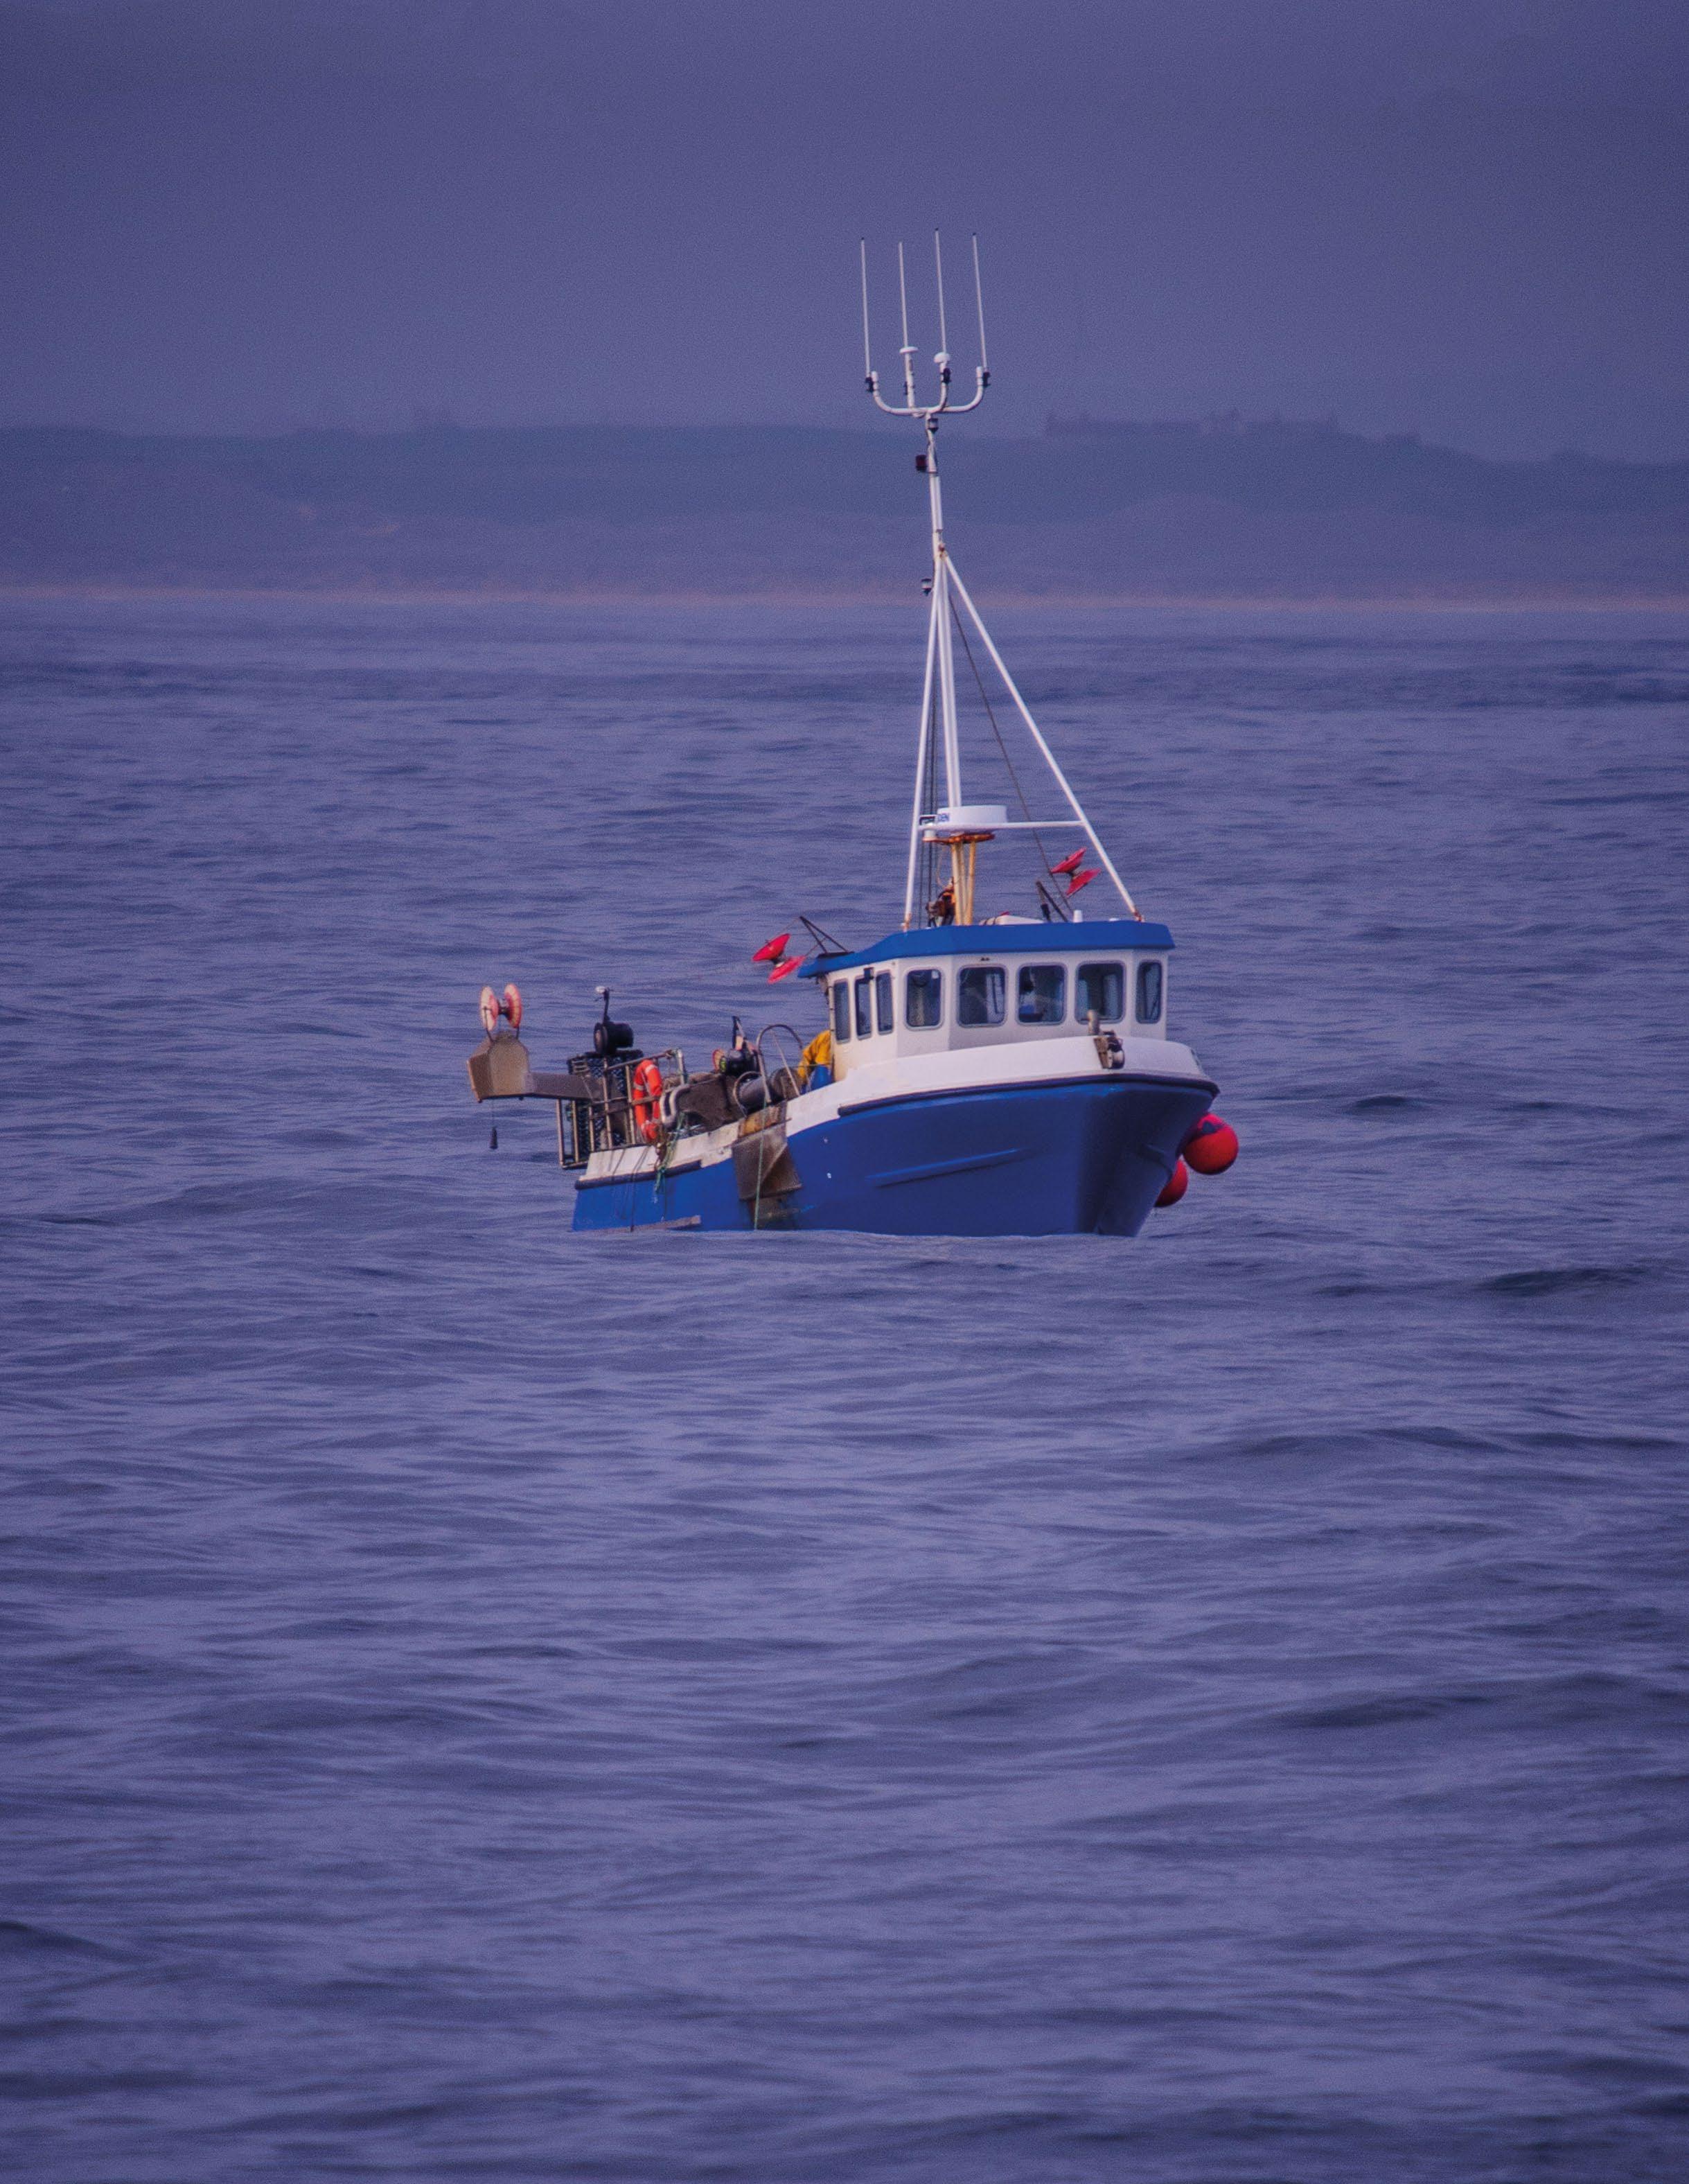 © OCEANA / Juan Cuetos
5.3
Case study: Competition between predators – sandeels in the North Sea
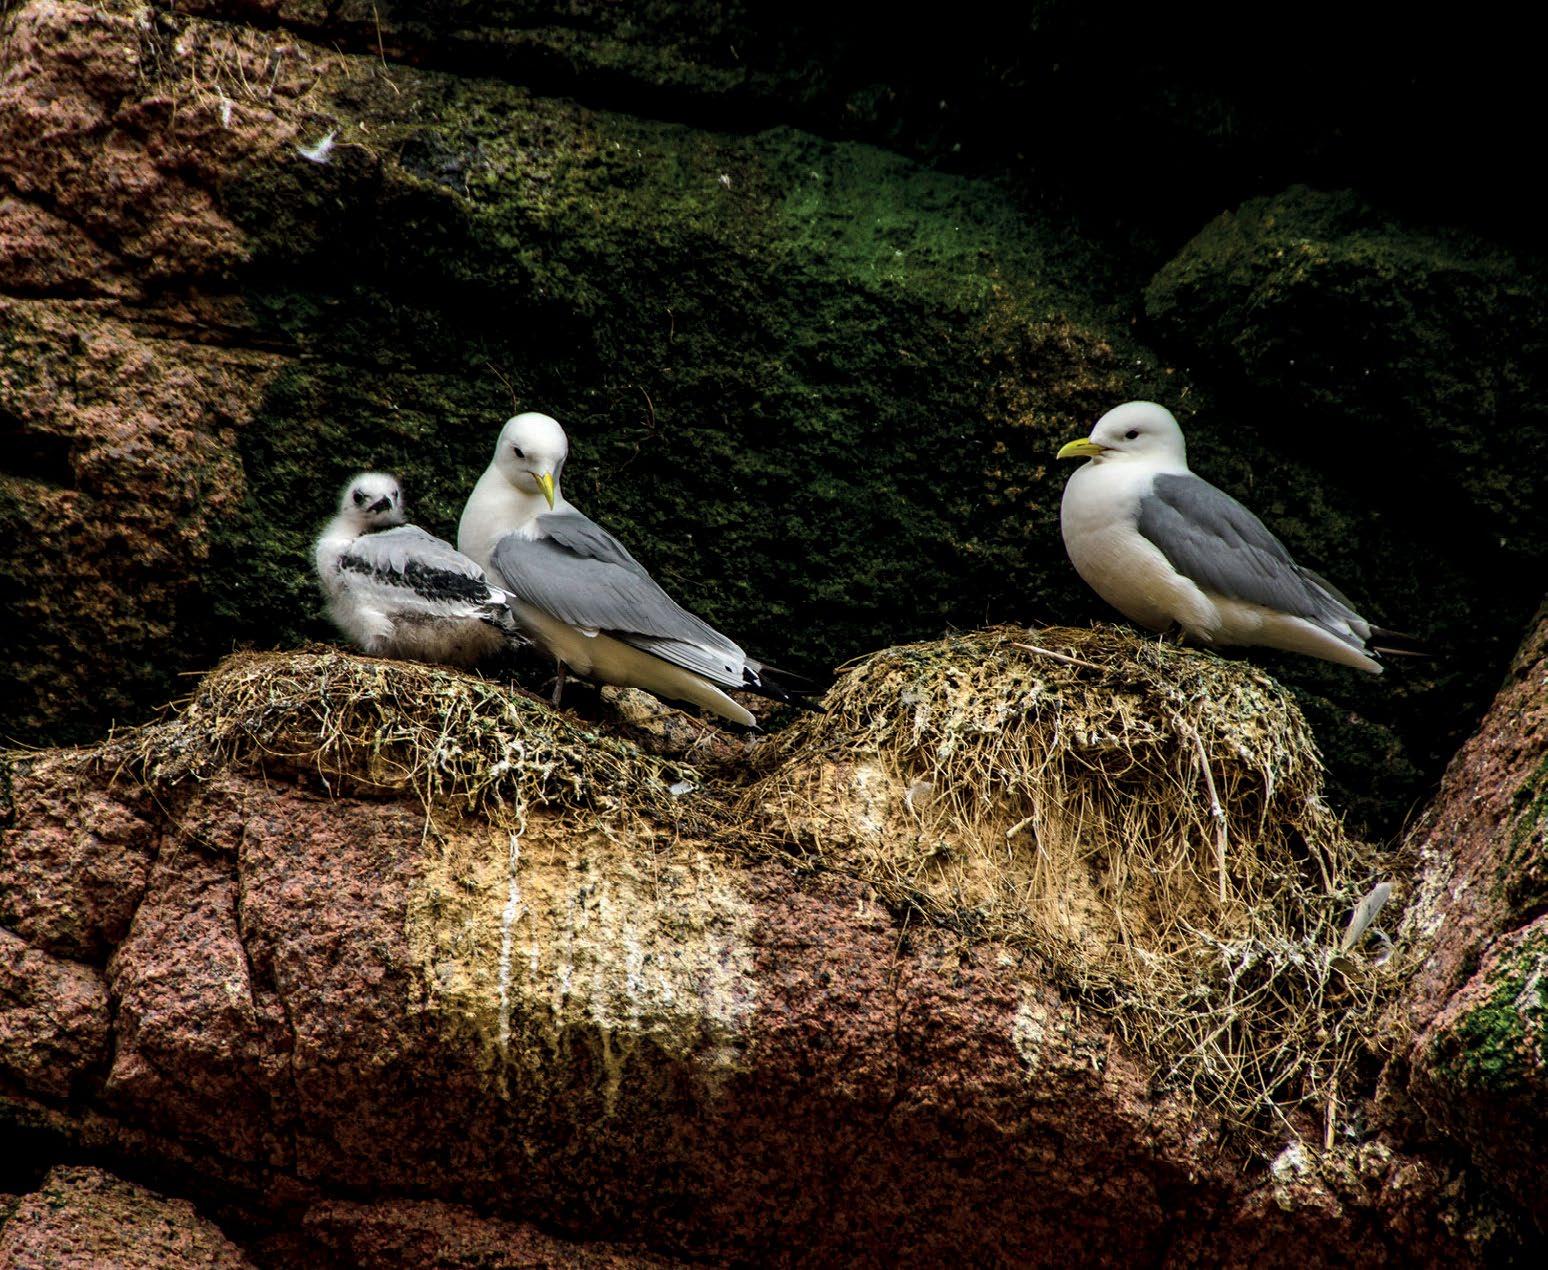
Sandeels are an essential component of the North Sea ecosystem, supporting populations of other fish, mammals and seabirds. Localised overfishing has led to depletion of subpopulations and climate change is likely to put further pressure on sandeel populations and their predators in the future. Scientific advice is that current management strategies are unsuitable. The implications of
unsustainable fishing practices in UK and EU shared waters are significant for the UK’s marine and coastal ecosystems. Brexit offers an opportunity for the UK to demonstrate better practice by accommodating the ecological importance of the species when implementing or influencing future management strategies.
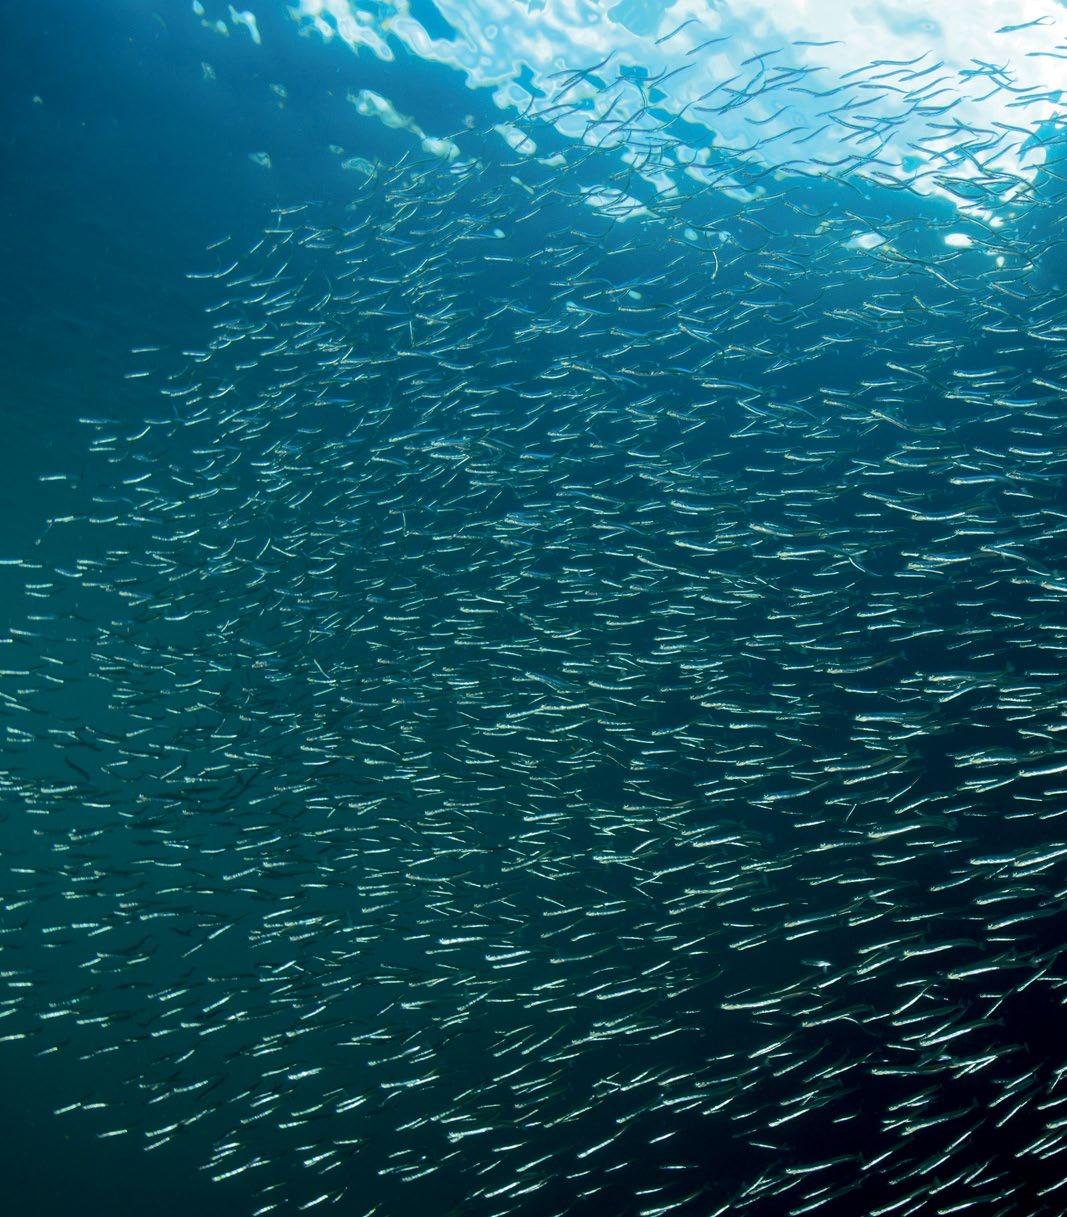
78 UK FISHERIES AUDIT 2021
© OCEANA / Juan Cuetos
Sandeels, like other forage fish, are a crucial component of the North Sea ecosystem, being key species that transfer energy from zooplankton to larger fish (such as haddock and horse mackerel), marine mammals (including minke whale and grey seals) and seabirds (for example puffins and sandwich terns)88,89,90,91. Sandeels, predominantly Ammodytes marinus, are targeted by fishing fleets from Denmark, Norway, Sweden, UK and Germany, with Denmark catching more than 70% of the annual total landings92. As a result of the EU relative stability key, where quota allocation among nations was determined based on past records, Denmark controls more than
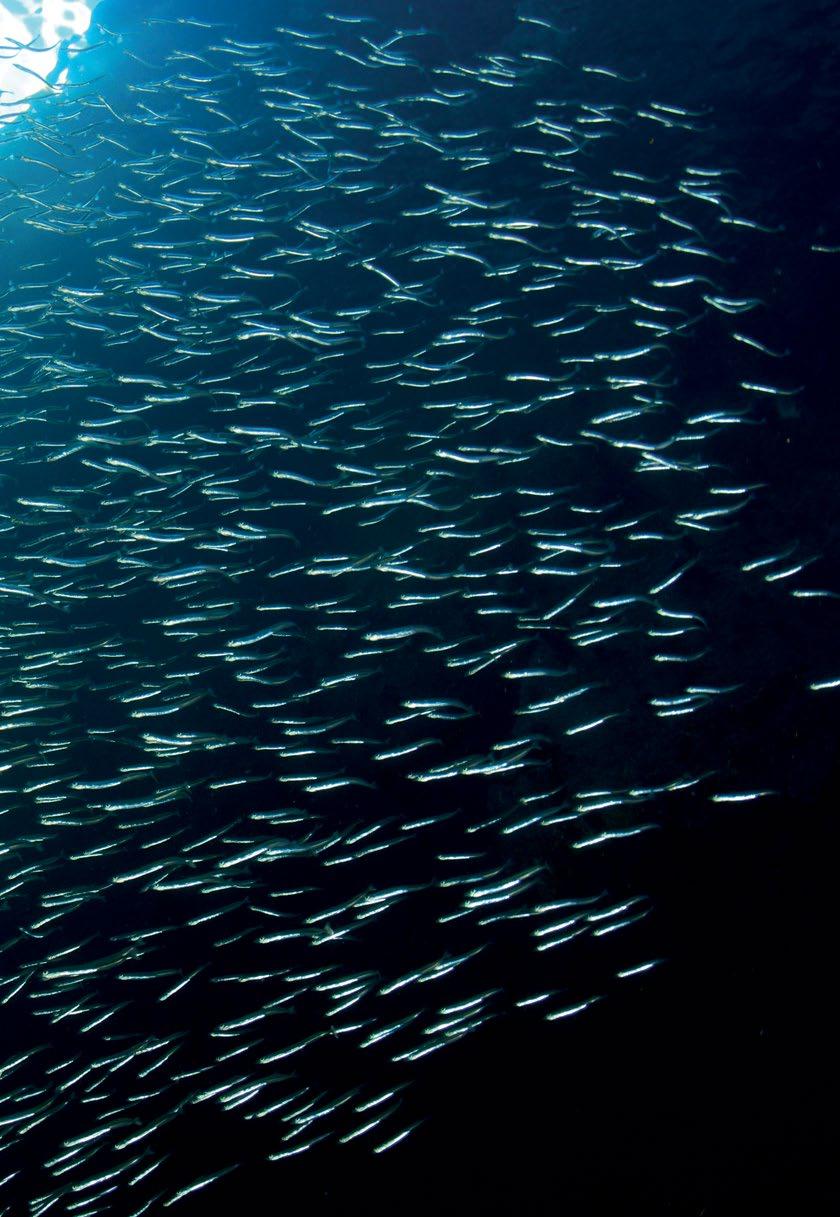
90% of the quota for sandeels in UK waters. This is largely destined for processing into fishmeal.
The fishery for sandeels expanded significantly in the 1970s and was not constrained by TACs until 2006. Landings between 1994 and 2002 averaged 880,000 t, but fell to 300,000 t for the period 2003 to 201692 . Since the late 1980s, a growing evidence base has identified a link between the success or failure of seabird breeding and the availability and quality of sandeels93. As a result, areas rich in sandeels within about 100km of seabird colonies have been the focus of concern, as overfishing risks local depletion of reproductively isolated subpopulations98 .
Localised overfishing and reduced breeding success of seabirds led to the closure of an area of water east of Scotland to commercial fishing for sandeels in 200094 . Despite an initial bounce-back in the years immediately after the closure, a combination of factors (a population depleted by unsustainable fishing, consumption by predators, natural mortality and changing food availability) prevented this subpopulation from recovering89,94. With climate change forecast to further alter food availability for sandeels and therefore seabirds, there is a strong rationale to implement precautionary management measures that adequately account for dependent predators. Another issue is the sustainability of the fishmeal and activities which the sandeels supply in Denmark, most notably salmon, mink and pig farms. All have sustainability issues, including the tonnage of fishmeal needed per ton of salmon95,96,97 .
Shared management of the sandeel fishery on the Dogger Bank may become an increasingly contentious issue now the UK has left the EU. The Danish fleet extracts a substantial volume of sandeels from the area of the Dogger Bank within UK waters. Currently there is no precautionary management plan98 ,99
79 UK FISHERIES AUDIT 2021
© OCEANA / Carlos Minguell
and under-reporting of catches has until recently been a problem98. The current approach to management is an escapement strategy where efforts are made to maintain the spawning stock biomass above the MSY Btrigger after the year’s fishing has happened98. ICES advise that this approach is not sustainable without a ceiling on fishing mortality, which currently does not exist98.
The UK’s status as a fully independent coastal state provides an opportunity to demonstrate better practice by accommodating the ecological importance of the species when implementing or influencing
future management strategies100. Options discussed range from spatial closures close to seabird breeding colonies during the breeding season, allocation of ‘quota’ to sandeel predators to closing the fishery entirely. But this requires an explicit commitment to an ecosystem-based approach to sustainability and to following scientific advice when determining fishing opportunities.
5.4 Case study: Caught in the net - cetacean bycatch
Accidental catches of dolphins, porpoise and whales in fishing gear is a global problem, which the European fishing fleet make an indefensible contribution to. Bycatch and mortality estimates strongly indicate possible population level impacts in European waters, especially the NE Atlantic. Common dolphin mortality inferred from strandings on France’s Western Channel coastline alone in 2018 was estimated to be between 3400 and 10,500 individuals, alongside an estimated annual bycatch in the Celtic Sea of around 720 individuals (range 278-1345) and 3973 (range 19986599) in the Bay of Biscay and Iberian Peninsula.
However, confidence in estimates is generally severely hindered by low levels of monitoring, despite legal requirements. The UK has gone to more effort than other EU countries to address the issue, but there is more required to ensure cetacean bycatch by the vessels fishing in UK waters is avoided where possible. That work could become a flagship achievement of the UK’s new fisheries management framework, although it will not be possible without international collaboration.
80 UK FISHERIES AUDIT 2021
Each year, high numbers of dolphins, whales and harbour porpoise (Phocoena phocoena) die in fishing nets in European waters, resulting in a major conservation and welfare concern101. Tackling this bycatch issue is an essential component of achieving sustainable and responsible fisheries. In the Celtic Sea, where most net fishing effort is undertaken by the UK xx,103, the bycatch mortality rate of harbour porpoise is likely to exceed the precautionary threshold (1% of population abundance104 ). Common dolphin (Delphinus delphis) mortality in the same
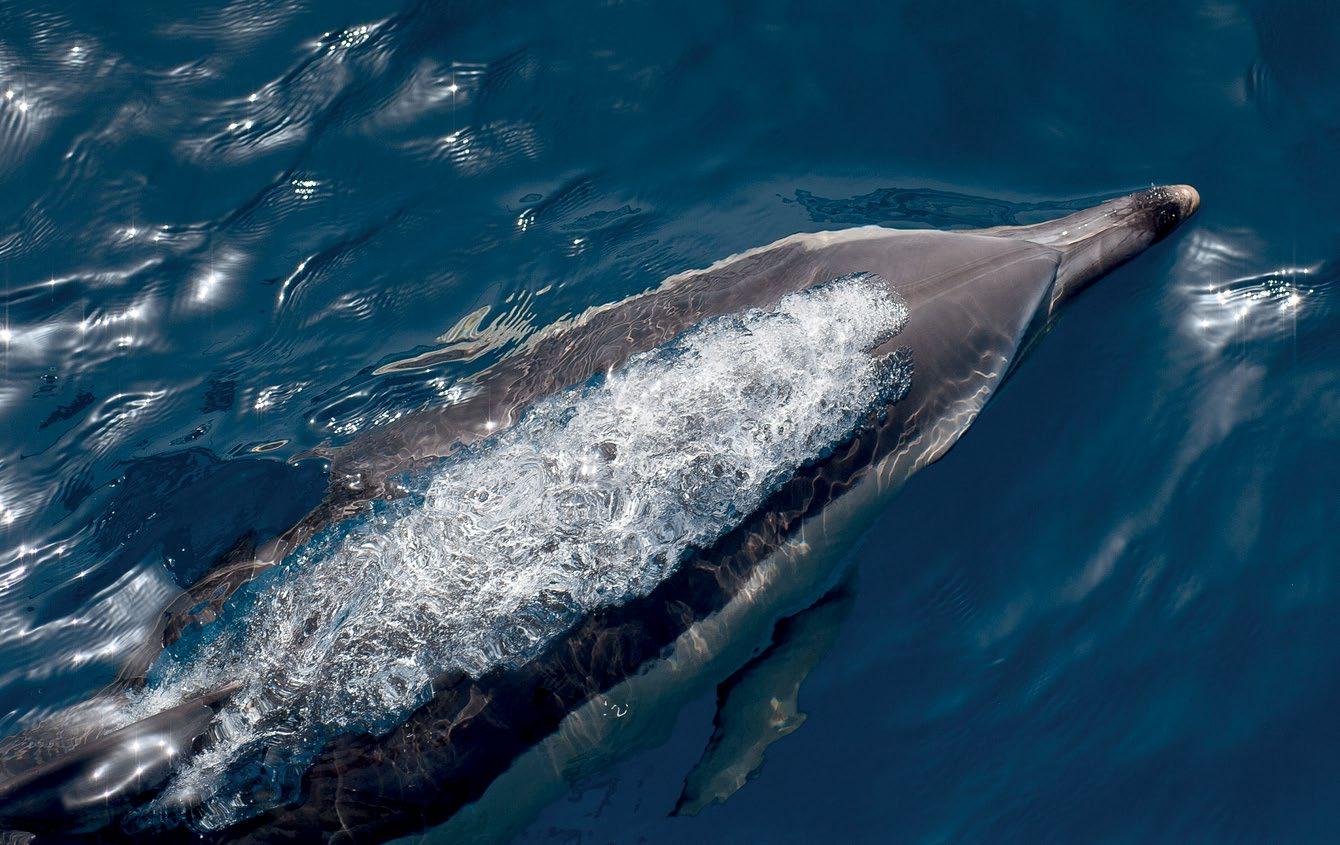
ecoregion, primarily due to bottom otter trawls and gillnets, is considered to be impacting at the population level too105.
The UK’s Cetacean Strandings Investigation Programme106 recorded 503 stranded harbour porpoise and 186 common dolphins in 2018, with bycatch as the identified cause of death accounting for between 0-40% and 24-33% of those strandingsyy, respectively, depending on the location105,107. The current best estimatezz of porpoise bycatch in all UK
xx In the UK, static net fisheries (set gillnets, drift gillnets, trammel nets and tangle nets) are recognised as having the highest rates of marine mammal bycatch, though some very specific and local issues have been identified in other types of UK fisheries. Overall, it is clear that the majority of marine mammal bycatch in UK fisheries occur in gillnet fisheries.
yy Strandings schemes provide useful supplementary evidence of bycatch, however it is not always possible to attribute the cause of death
zz These estimates are however associated with notable limitations due to necessary assumptions to enable extrapolation of the available data to the fleet level, which may introduce bias to the estimates, therefore affecting confidence in these estimates http://www.ices.dk/sites/pub/
Publication%20Reports/Expert%20Group%20Report/acom/2018/WGBYC/wgbyc_2018.pdf
81 UK FISHERIES AUDIT 2021
© OCEANA / Carlos Suárez
gillnet fisheries is 1250 (range 606–3114) animals if all over 12 m boats used pingers in relevant areas (higher if they do not). Bycatch estimates for common dolphins in the Celtic Seas alone are 720 individuals (95% confidence interval range 278-1345) per year for the period 2016-2018 and 3973 (95% CI 19986599) in the Bay of Biscay and Iberian Peninsula ecoregion. Common dolphin mortality inferred from strandings on France’s Bay Western Channel coastline in 2018 was estimated to be between 3400 and 10,500 individuals108.
Despite various legal requirements developed over the past few decades including the Habitats Directive109 and Marine Strategy Framework Directive110, there has been limited implementation to deliver effective monitoring or mitigation by EU Member States101. Estimating the total number of individuals caught across entire fishing fleets is challenging due to low observer coverage and the scarcity of detailed data on the distribution of fishing effort111. This means that fleets which pose the greatest risk of bycatch are generally under-sampled and so bycatch is underestimated. Even in 2018, the quality and scope of Member States’ reports on
the implementation of the EU’s cetacean bycatch regulationsaaa remained varied, with most countries lacking dedicated observer programmesbbb,105. Whilst bycatch estimates remain uncertain and patchy, the case for mitigation remains weak and cetaceans and other protected species will continue to be inadvertently killed by fishing activities.
On a more positive note, the UK is leading the way in terms of commitments to the current legislative requirements. It was considered to be the only EU country to be fully compliant with the pinger requirementsaaa and to have a long-running, dedicated observer programme for protected species bycatch monitoring105,107, although observer coverage across the UK fleet is still very low (<1%). In 2004, the UK banned the use of pair trawls (typically used to fish for seabass) within 12 miles of the south-west coast of England, due to high levels of common dolphin bycatch112. However, despite the UK’s efforts, further improvements are required in ICES Division 7e (western English Channel), particularly for gill nets, due to the relatively high fishing effort and bycatch risk105. Accurate information on net fishing effort is needed to inform Bycatch Risk Assessments, for all vessel sizes107. Increased sampling of smaller
aaa EU Regulation 812/2004, at that time. The Regulation had two components, one specifying the use of Acoustic Deterrent Devices (ADDs or ‘pingers’) on vessels of 12 m or over in certain métiers; the other setting out on board observer monitoring requirements for vessels of 15 m or over [for specified fisheries and under certain conditions]. Member States were also obliged to establish Pilot or Scientific Studies on some smaller vessels, and to report annually to the European Commission on their implementation of the regulation. In June 2019, this regulation was repealed by the new Technical Conservation Measures Regulation (EU 2019/1241). The former requirements were largely carried over to the new regulation, which has the objective to minimise, or where possible eliminate, incidental catches of sensitive marine species such that they do not pose a threat to the species’ conservation status. Additional monitoring and mitigation obligations to reduce protected species bycatch are set out within the EU Habitats Directive (although the implementation of this regulation has been formally challenged by eNGOs: https:// uk.whales.org/2019/07/10/wdc-leads-call-for-eu-commission-to-take-legal-action-against-15-governments-over-dolphin-deaths/) and revised Commission Decision 2017/8483 relating to the implementation of the MSFD, and specifically the assessment of Good Environmental Status.
bbb Most commonly, observer data on cetacean bycatch originate from more general fisheries observer programmes under the EU Data Collection Framework Regulation 2017/1004 (https://datacollection.jrc.ec.europa.eu/legislation/current/obligations) as part of the Multiannual Plan https://datacollection.jrc.ec.europa.eu/dc/fleet/eum
ccc Although the use of pingers is mandatory for EU fishing vessels over 12m, such vessels only represented 2% by number of those UK vessels deploying static nets in 2017 (https://research-repository.st-andrews.ac.uk/handle/10023/6855). This is despite vessels both under and over 12m fishing where harbour porpoises are known to be present (https://doi.org/10.1017/S002531541100155X).
82 UK FISHERIES AUDIT 2021
vessels (<12 m) should also be a priority as they likely account for a significant proportion of bycatchccc , as is the use of pingers in high risk areas to reduce bycatch of harbour porpoise113, despite the lack of EU legislative requirements for such activities on the smaller inshore fleetaaa. For other species, management strategies need to consider other mitigation measures, including effort reductions, time/area closures, bycatch reduction devices and use of alternative or modified gears114, all of which are dependent on commitments to long-term, reliable monitoring programmes linked to mitigation strategies.
In order to tackle cetacean bycatch in UK waters, the UK Government has said they are developing a coherent and coordinated, stakeholder-led approach to minimise cetacean bycatch115 and in 2017 committed to development of a cetacean bycatch strategy116 . It is imperative that the UK’s efforts continue beyond EU membership, but moreover are demonstrably effective at tackling the issue of marine mammal bycatch in UK waters within agreed timeframes. To do so, those activities need to recognise that political boundaries are irrelevant to the animals affected, and need to treat the EU requirements as minimum standards to be exceeded as evidence of the UK’s ambition to become “a world leader in managing our resources while protecting the marine environment”117,118
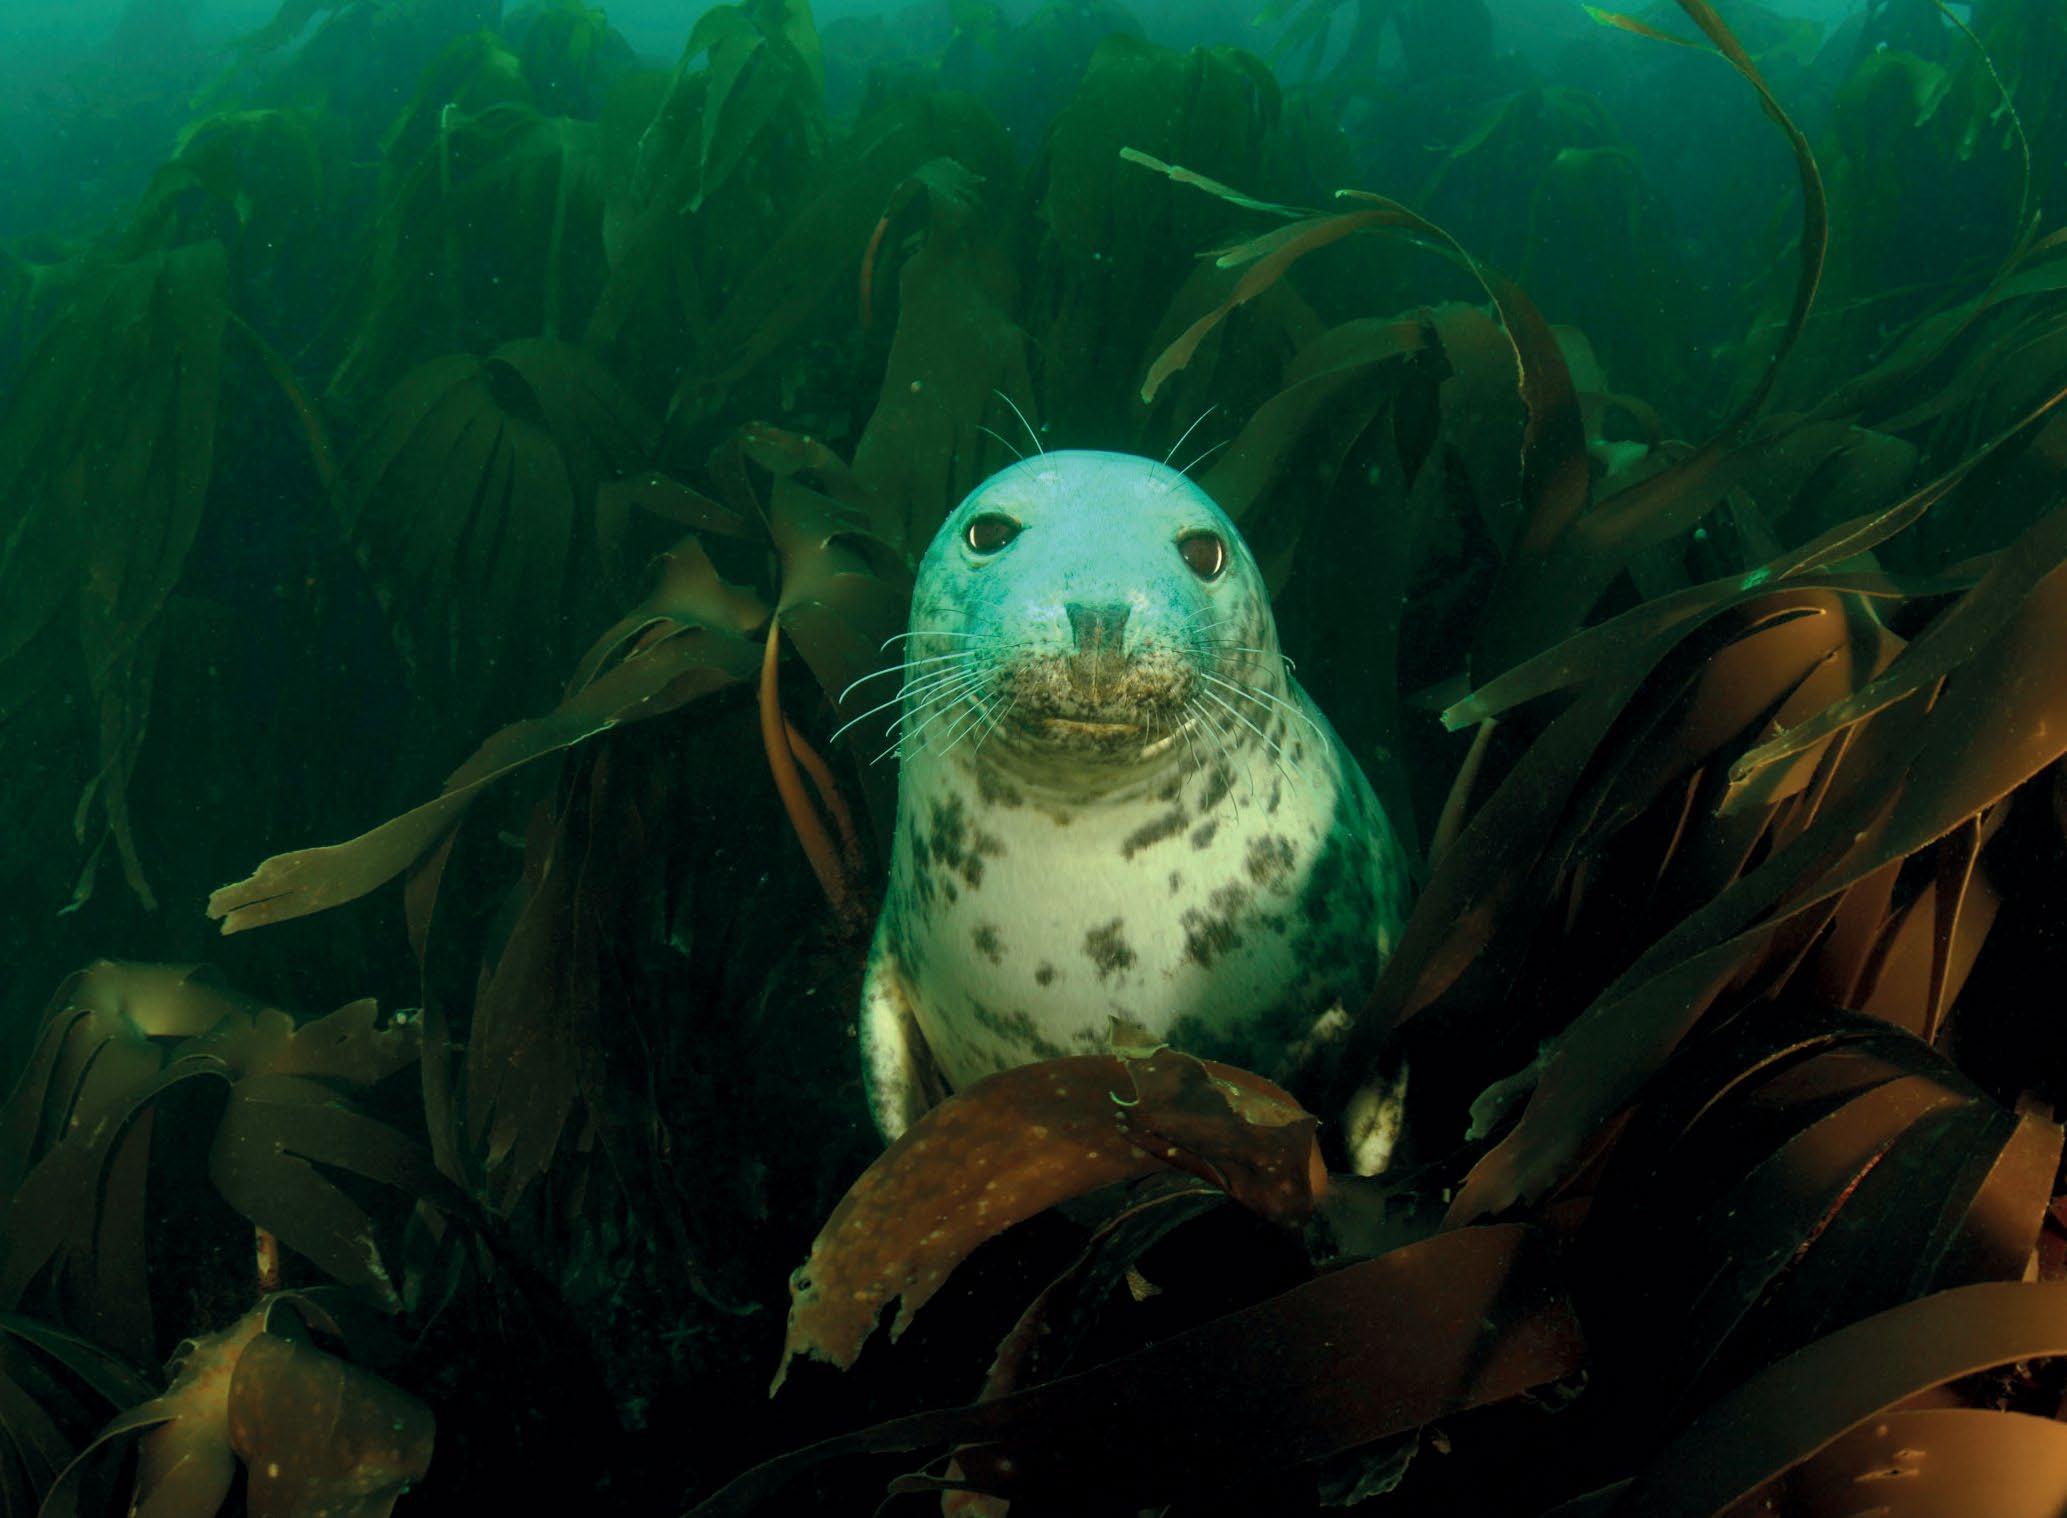 © OCEANA / Carlos Minguell
5.5 Case study: Ploughing the seafloor for scallops
The ecological impacts of scallop dredging on vulnerable habitats are well documented, ultimately leading to reduced biodiversity. The effects on seemingly more resilient areas of the seabed are less well understood but where bans are in place, biodiversity recovery has been observed including on areas of the seabed between sensitive reef habitats.
Given the economic importance of scallop fisheries to the UK and EU fishing industries, there remains a tug-o-war between environmental and political decision making. The UK’s departure from the EU poses the risk of expansion of this fishing activity without sufficient consideration of the longer-term impacts on the marine ecosystem.
An estimated 20,371 t of Great Atlantic, or King, scallops (Pecten maximus) worth over £47 million were harvested by UK vesselsddd in UK waters in 2019, making it the fourth most valuable fishery, with 38% of those landings arising from the English Channel and just 3% recorded as collected by commercial hand diving26. The scallop stocks are internationally exploited, primarily by the UK and France, with additional activity from Ireland, the Netherlands and Belgium, so the total removals are significantly higher
ddd Including Isle of Man and Guernsey
than these figures. Management of these fisheries is largely under the control of the Member States, except for EU set minimum sizes and an effort cap for vessels ≥15 m in ICES subarea 7119. UK management measureseee also involve effort restrictions through licence numbers for over 10m vessels plus gear restrictions and some inshore (<6nm) spatial restrictions, often related to Marine Protected Areasfff
Concerns over the environmental impacts from scallop dredging are largely related to the wider ecosystem effects, rather than on the scallops themselves120. That said, there was no routine assessment or monitoring of stocks prior to 2017 and recent assessments indicate that of the 7 identified stocks in English waters, 1 is overfished, 3 are data limited and the remaining are sustainably exploited from a population perspective
It is the methods used to extract the scallops from their typically semi-buried position in the seabed that is of concern120 (Figure 51). Relatively heavy bottom towed gear, trawls and in particular dredges, required to dislodge the scallops so they can be collected in the attached net or cage, physically disturb the seabed and have significant adverse impacts on the other associated species and seafloor habitats. Such effects occur both directly by physical damage or increased availability to
eee Scallop Orders (Scotland): https://www.legislation.gov.uk/ssi/2017/127/made, (England): https://www.legislation.gov.uk/uksi/2012/2283/ contents, (Wales): https://www.legislation.gov.uk/wsi/2010/269/made, (Northern Ireland): https://www.legislation.gov.uk/nisr/2008/430/made
fff In England, such spatial restrictions are often regulated through Inshore Fisheries and Conservation Authority (IFCA) byelaws, and may be accompanied by other local effort-based and technical measures, such as: https://www.cornwall-ifca.gov.uk/scalloping and http://www.ne-ifca.gov. uk/news/scallop-dredging/
84 UK FISHERIES AUDIT 2021
predators, and indirectly through reduction in habitat complexity and re-suspension of soft sediments, nutrients, eggs, etc. Suspended sediment can bury or smother surrounding marine life such as filterfeeding mussels. Long-lived, slow-growing, upright epifaunal species (such as maerl, pink sea fans, sponges, mussels and sabellaria) often have fragile body structures that can be destroyed by encounters with fishing gear, taking longer to recover, whereas smaller organisms with shorter lifespans (such as polychaete worms and encrusting bryozoans) tend to be more resilient. Maerl bedsggg are a particularly special and sensitive biogenic habitat found in UK (and wider) waters; supporting high levels of biodiversity, they are protected under national and international legislation and agreementshhh, and are extremely vulnerable to physical damage by scallop dredging as well as smothering121. Mobile megafauna, for example crabs, urchins, starfish and fish species such as monkfish, are also subject to the unintended
consequences of this fishing activity, either caught as bycatch or damaged or killed on the seafloor. Scallop dredging can therefore lead to changes in community composition and ultimately reduced biodiversity, whereby communities are comprised of fewer, more resistant species120.
The UK has made some progress in protecting some of the more obviously vulnerable habitats, such as seagrass, maerl, horse mussel (Modiolus modiolus) beds and reefs, from the impacts of scallop dredging as part of the Marine Protected Area (MPA) network 122. However, concerns remain that due to limited understanding of what levels of dredging are sustainable for more resilient habitats120 and their associated infauna and epifauna, including those also protected under environmental legislation, tailored management is still lacking in the majority of UK waters including MPAs for which effective management is still largely lacking123,124,125. In Wales
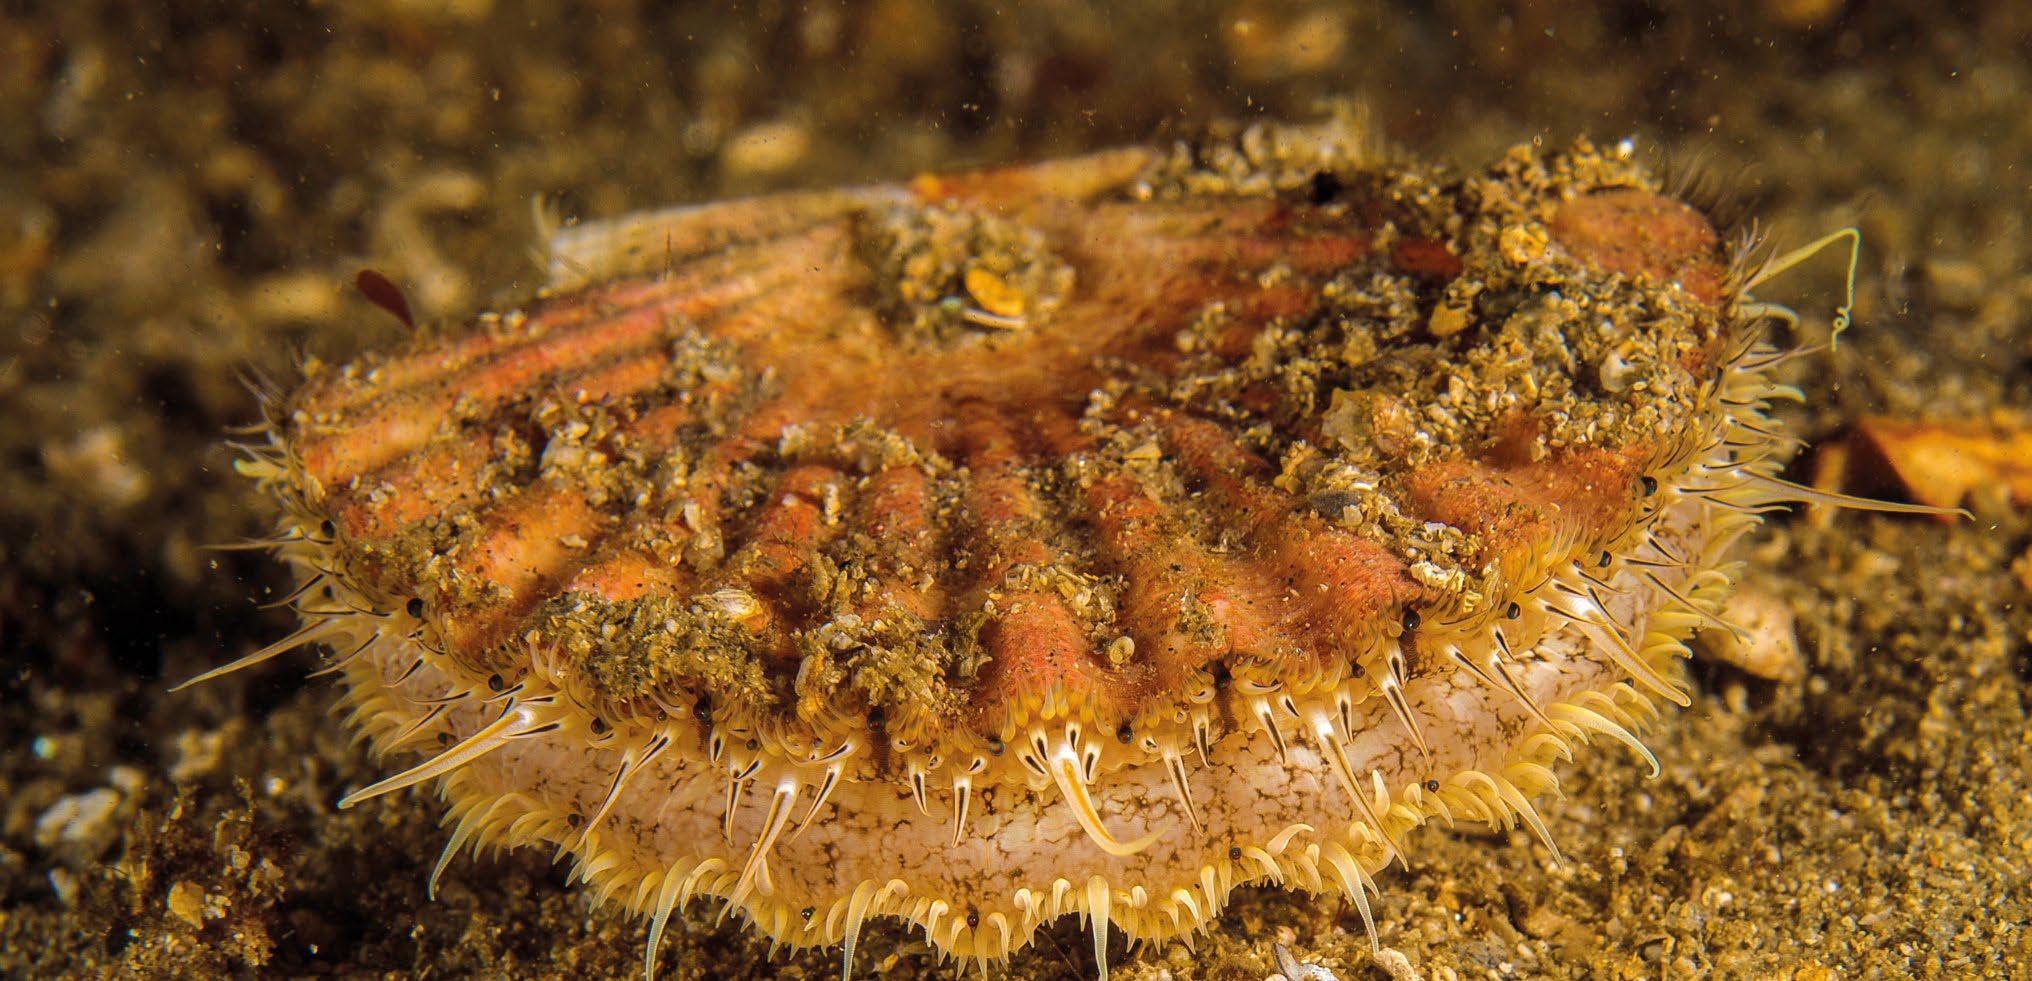
ggg https://www.marlin.ac.uk/habitats/detail/255/maerl_beds
hhh Including the UK’s Marine and Coastal Access Act (https://www.legislation.gov.uk/ukpga/2009/23/contents) through designation as a protected feature of Marine Conservation Zones (https://www.gov.uk/government/collections/marine-conservation-zone-designations-in-england), EU Habitats Directive (https://ec.europa.eu/environment/nature/legislation/habitatsdirective/index_en.htm) and OSPAR Habitats Convention for the Protection of the Marine Environment of the North-East Atlantic (https://www.ospar.org/convention)
85 UK FISHERIES AUDIT 2021
© OCEANA / Juan Cuetos
for example, there is ongoing conflict over a pending Welsh Government decision to allow scallop dredging in a larger area of Cardigan Bay Special Area of Conservationiii , including the potential impacts on Bottlenose dolphins as a protected feature of the MPA126.
What could the UK’s exit from the EU mean for the marine environment in relation to scallop dredging?
The risks arise from factors such as potential weakening of environmental legislation127, socioeconomic pressures to prioritise this valuable fishery under any restructuring of the UK’s fisheries management framework and displacement of activity from quota fisheries if negotiated quota and access arrangements are unfavourable for some UK fleets128 . The UK’s status as an independent coastal state could however offer opportunities for joint marine conservation and sustainable fishing initiatives. For example, the reefs of Lyme Bay in Dorsetjjj have been protected from bottom towed gear since 2008 with numerous studies reporting subsequent improvements in ecological indicators. These for
example include anticipated recovery in species richness and species abundance129, as well as the less predictable spread of reef associated species from the recognised areas of reef to the infilling sedimentary habitat, indicating that protection of the whole area from the damaging effects of bottom towed gear such as scallop dredging has had wider, unexpected benefits for the habitat’s recovery130. However, the benefits have also extended to ecosystem services and human wellbeing, in part due to the increased monthly landings and value of hand-dived scallops under the ‘Reserve Seafood’ brandingkkk,131.
Ultimately if scallop dredging is to become less impactful, it needs to be spatially managed with fishing grounds allocated outside of MPAs and other vulnerable or protected habitats. Defra are presently developing a Scallop fisheries management plan which will need to address these issues and should engage NGOs and other scientists as well as the industry in the process.
iii For example, see: https://gov.wales/written-statement-new-scallop-fishing-cardigan-bay-new-management-measures; https://www.clientearth.org/ scallop-dredging-cardigan-bay-legal-issue-not-economic-one/; https://www.bbc.co.uk/news/uk-wales-51402245
jjj http://www.dorsetmpas.uk/lyme-bay-reefs/
kkk https://lymebayreserve.co.uk/reserve-seafood/
86 UK FISHERIES AUDIT 2021
Figure 51: Illustration of the interaction of a scallop dredge with the seafloor (source: Colin Munro)
Direcction of travel
Scallop
Dredge teeth on toothbar
Sediment plume
Mesh bag
Chain link belly
 © OCEANA / Juan Cuetos
6.Audit conclusions
accounting for an additional 15% of landings (8% by value). On average, around 27% of EU catches in the North East Atlantic were also taken from UK waters between 2012 and 2016. In fact, EU vessels landed more fish from UK waters than the UK fleet, although the UK fleet’s landings had higher value.
In 2019, fish stocks managed by the EU through catch quotas caught in UK waters contributed around 387,000 tonnes and £572 million to the UK fishing industry’s annual production, or more than half of the total UK fisheries turnover of about £1 billion. The majority of fish were caught by over 24 m vessels operating from Scotland, with pelagic species such as mackerel and herring dominating UK catches by volume, and in the case of mackerel also by value, along with other key resources such as Nephrops and cod. To put this in national context, the GDP for fishing in 2019 was £747 million, representing 5.5% of the total for agriculture, forestry and fishing combined, whilst in terms of GVA marine fisheries represented about 0.04% of the UK’s non-financial sector in 2018. Heterogeneity, for example in geographical catch distribution, fleet composition, species diversity and devolved interests, is a key feature of the UK fishery sector.
The majority (>80%) of UK fisheries landings from the North East Atlantic in 2019 came from UK waters. The second most important source of fish for the UK fleet were EU waters, and the Irish EEZ in particular,
The UK is however a net importer of seafood. In 2019, 721,000 t of seafood valued at £3.5 billion was imported, and 452,100 t of seafood was exported, valued at £1.8 billion. EU Member States are important sources of seafood consumed in the UK and are critical markets for UK fishery exports. Asia, Iceland and Norway are also chief sources of seafood for the UK but are less important export destinations.
When the UK was part of the EU, TACs for stocks under exclusive and non-exclusive EU competence were set or negotiated by the EU Agriculture and Fisheries Council (AGRIFISH), which included the UK’s Fisheries Minister. The allocation of the agreed TACs among EU member states was subject to a fixed percentage known as the relative stability key. For 82 quota stocks fished by the UK and EU fleet (and other third parties in some cases, largely Norway and the Faroe Islands) and considered in this report, the UK received between a 2% and 98% relative stability share. For the shared stocks the UK will now directly negotiate bilateral and multilateral agreements over catch quotas and other management measures.
Despite the CFP commitment for fish stocks to be fished at levels compatible with MSY by 2020, 15.9% (n=13) of the 82 shared stocks were below MSY biomass reference points in recent assessments and
88 UK FISHERIES AUDIT 2021
The objective of this report was to provide an evidence-based snapshot of the status of UK fish stocks and the UK fishing sector’s recent exploitation history of those stocks, to provide a baseline for future evaluation of the UK’s progress and/or setbacks in the sustainable management of fish stocks.
25.6% (n=21) were being fished at levels which will not meet that objective. Data limitations mean there is lower confidence in the scientific assessment of stock and exploitation status for 14.3% and 19.6% (n=7 and 11), respectively, of those stocks. More worryingly, no stock status reference points have been defined for 36.6% (n=30) of quota stocks (n=23 or 28% have no fishing mortality reference points), including high value fisheries such as Nephrops and anglerfish (monkfish), leaving them at greater risk of unsuitable management decisions. TACs for three quota stocks were not based on any scientific advice.
Non-quota stocks, predominantly shellfish, typically managed through national effort and technical restrictions (input control measures), are very important resources for the UK fishing industry, particularly the 10 m and under coastal fleet. Shellfish comprise around 20% of landings by larger (over 10 m) vessels but >80% of 10 m and under vessel landings by value and volume, the result of the fleet’s limited (<2%) access to UK quota, despite their domination by number (74% of the UK fleet in 2019). The UK government do not intend to change the existing national quota allocation methodology following Brexit, which is based on Fixed Quota Allocation units, differentially associated with the three key groups – sector (vessels of any size that are part of a Producer Organisation), non-sector (over 10 m vessels only) and 10 m and under (majority of smaller vessels fall into this category). However, eNGOs are advocating that low-impact fishers are given preference when it comes to allocation of any additional negotiated UK quota. One key requirement for such an approach would be the definition of low impact fishing, a categorisation that is subject to ongoing debate.
management bodies has improved in recent years, there remain significant gaps in understanding and monitoring of sustainable levels of fishing; addressing these deficiencies should be a priority for the UK in the near term. Landings of lobsters, edible crabs and king scallops collectively contributed around 51,500 tonnes and £159 million to the UK fishing industry in 2019. Of the 17 stocks (or fishery units) of these three species included in the audit, 1 crab stock was considered to have a healthy stock size, although it was also categorised as overfished, and 3 scallop stocks were thought to be sustainably exploited, although their biological status could not be assessed. In contrast, 7 crab and lobster units were in a critical state due to overexploitation, plus 1 additional stock was classed as overfished. All assessments were based on proxy reference points, but for 5 stocks even these were not available.
Focusing on the 10 stocks which are economically most important to UK fisheries, 8 of which are shared with third parties - mainly the EU - and managed through quotas, 6 are overfished or their stock biomass is at a critical level: North Sea herring, North East Atlantic blue whiting, North Sea whiting, Eastern English Channel scallops, North Sea cod, Southern North Sea crab (the latter two are both overexploited and their biomass is below MSY reference points). Further, there is insufficient data to define reference points for North Sea anglerfish. Therefore, only 3 of the top 10 stocks upon which the UK fishing industry relies are considered to be healthy and sustainably exploited: North East Atlantic mackerel, North Sea haddock and West of Scotland Nephrops.
Whilst assessment of some of these non-quota species and stocks by UK scientific advisors and
The other cod stocks in European waters are also in a critical state according to scientific advice. Historically, cod has been one of the most important commercial fish stocks in the North Atlantic. A series of stock declines and collapses, linked primarily to
89 UK FISHERIES AUDIT 2021
unsustainable fishing pressure and more recently additive effects of unfavourable climatic conditions, have led to various management responses with variable - mainly unsuccessful – outcomes. Measures to once again rebuild cod in the North Sea are now being developed and implemented, but the results will take some time to emerge. The UK must continue its commitment to supporting the recovery of this iconic stock, which should in parallel demonstrate its progress towards meeting domestic duties within the new Fisheries Act to develop Fisheries Management Plans which maintain stocks at or below MSY or restore them to levels capable of producing MSY.
Alongside implementation of successful recovery plans, lagging full policy implementation and political decisions to set TACs above advised catch levels are still pending issues of fisheries management. There is evidence from this report that stocks where TACs are set according to scientific advice are in better health than those where TACs are repeatedly set above the advised catch. For many of the stocks in the most worrying state, predominantly gadoids (cod and whiting) in the Celtic Sea ecoregion, resolving this issue of misalignment between advised and agreed TACs is highly politically sensitive due to their status as bycatch species in economically important mixed fisheries.
Whilst the majority of the report refers to the sustainability of fishing activities in the context of stock and exploitation status in relation to MSY reference points, sustainable fisheries management has far wider-ranging considerations. The UK has an opportunity to fully integrate an ecosystembased approach to sustainability into its new domestic fishing regime by explicitly accounting for the environmental impacts of fishing activities in management decisions and regulation. Key
examples of where this is urgently required have been provided in this report, namely accommodating the ecological importance of sandeels to the wider marine ecosystem when implementing or influencing future management strategies, ensuring cetacean bycatch by vessels fishing in UK waters is reduced to an unavoidable minimum level, and introducing careful spatial management of scallop dredging to significantly reduce its impact on the UK’s marine environment, particularly within MPAs.
This audit indicates there are still rough seas ahead for sustainable management of fishery resources in European waters. Sub-optimal levels of scientific evidence, numerous examples of stocks not recovering from over-exploitation when fishing pressure is reduced, and climate change, mean application of the precautionary principle is as important as ever. But so is effective collaboration across borders, whether they are national or international. The UK’s approaching status as an independent coastal state with significant interests in these shared resources offers ecological and socioeconomic opportunities, as well as risks. Ultimately, the UK Government must ensure transparent decision-making that aligns with scientific advice is at the heart of the new fisheries management framework and that the long-term vision of setting ‘a gold standard for sustainable fishing around the world’ is achieved. This will undoubtedly require a shift in the balance from socio-economic priorities to ones that are actively fighting the corner of healthy ocean ecosystems, although if done successfully the longer-term benefits would be less selective.
90 UK FISHERIES AUDIT 2021
7.Oceana’s Policy Recommendations
The UK’s decision to leave the EU, and therefore also the CFP, has enormous consequences for the management of North East Atlantic fish stocks. So, the fisheries governance system for these stocks and the balance of power in the decision-making process has been altered. This new management framework should be settled, and its results, for which the UK has a great responsibility, will be evident in the years to come.
Within the last decade, thanks to a collaborative effort based on the ambitious EU fisheries policy, the overfishing rate in the North East Atlantic has dropped from 66% to 38%6. This progress, while insufficient, is a positive trend that must continue and accelerate so that overfishing finally becomes a thing of the past, and so that marine ecosystems are given the chance to rebound and build resilience to largescale threats such as climate change132.
The UK government has repeatedly stated its ambition to become a world leader with “gold standard fisheries management” following its departure from the EU4. The UK should maintain the ambition of achieving sustainable fishing and not backtrack on jointly established high standards on sustainable fisheries and the environment. To safeguard public, natural, and renewable fish resources for ours and future generations, the UK must take the lead in North East Atlantic fisheries management and act with credibility, consistency, and transparency.
Overfishing has been a major driver of marine biodiversity loss in the last 40 years133 and it also critically undermines fish populations’ resilience to the impacts and threats. UK fisheries must be managed in the wider context of the climate and ecological emergency and should be guided by international commitments: the Paris Agreement134 the Convention on Biodiversity (CBD), the United Nations Sustainable Development Goals136,lll (SDGs) and the United Nations Convention on the Law of the Sea137 (UNCLOS).
lll Specifically, SDG Goal 14: Conserve and sustainably use the oceans, seas and marine resources, with all its targets. Target 14.4 explicitly requires: ”By 2020, effectively regulate harvesting and end overfishing, illegal, unreported and unregulated fishing and destructive fishing practices and implement science-based management plans, in order to restore fish stocks in the shortest time feasible, at least to levels that can produce maximum sustainable yield as determined by their biological characteristics.”
91 UK FISHERIES AUDIT 2021
7.1 Management of UK domestic fisheries
The UK championed environmental changes in the last CFP reform in 2013, like the (missed) ambitious objective of ending overfishing by 2020, the international requirement of the MSY exploitation target for all stocks, and the prohibition of wasteful discards. Now that EU regulations no longer apply to the UK, it is time to build and implement a national management framework.
For the time being, the UK has adopted the Fisheries Act 20201, the first major domestic fisheries legislation in nearly four decades and which sets the basic legal framework for the management of UK fisheries. Despite securing some positive elements, the UK Fisheries Act fell short of Oceana aspirations for an ambitious legislation by failing, for example, to include a firm duty, not just objective, for all stocks to be fished at sustainable levels (MSY) in line with scientific advice.
The UK Government and Devolved Administrations continue developing further fisheries rules to provide a complete management framework, notably the fisheries statements and the fisheries management plans. The next months are critical for adding the needed legal requirements to ensure responsible fishing activity. The consequence of taking back control of UK waters should also mean assuming full responsibility and accountability for sustainable management of fisheries.
A transition to fully sustainable fisheries must encompass setting fishing opportunities in line with the scientific advice, stopping illegal fishing through a comprehensive fisheries control and sanction system, banning the use of non-selective and destructive fishing practices particularly in Marine Protected Areas (MPAs), and protecting Essential Fish Habitatsmmm by spatial and temporal fishing restrictions. In doing so, it will facilitate not only healthy fish stocks and marine ecosystems, but also will contribute to the cultural and economic prosperity of coastal communities by making sure the fishing industry can continue to thrive for years to come.
The UK should take urgent action to continue efforts to end overfishing of its stocks and ensure that the UK fishing activity is sustainable. Specific actions required to achieve this include:
• Fully implement the following Fisheries Act fisheries objectives: the sustainability, precautionary, ecosystem, scientific evidence, bycatch, and climate change objectives.
• Include the binding commitment to recover and/ or maintain all exploited stocks above biomass levels capable of producing MSY (in line with international commitments), with a timeframe to achieve it, when adopting the Joint Fisheries Statement and the Secretary of State Fisheries Statement.
mmm Habitat identified as crucial to the ecological and biological requirements for the critical life cycle of exploited fish species, like spawning or nursery grounds, and which may require special protection to improve stock status and long term sustainability crucial habitats in the life cycle of
92 UK FISHERIES AUDIT 2021
• Set fishing opportunities, catch limits and effort restrictions, which do not exceed the best available scientific advice. Ensure that fishing opportunities for mixed fisheries are consistent with the sustainable exploitation of the worstpreserved stocks, and that by-catch TACs for depleted stocks are not granted until rebuilding plans are implemented.
• Develop Fisheries Management Plans for fish stocks, starting with those in the worst state of conservation and those which are data deficient, containing clear management objectives and targets with a timeframe to achieve them.
• Improve the data collection, scientific assessment methods, and management of data deficient fisheries.
• Reform the allocation of fishing opportunities using environmental criteria that favour lowimpact fishing. Provide incentives to implement fishing practices with reduced environmental impacts whilst avoiding harmful subsidies.
• Improve fishing gear selectivity to minimize the bycatch of non-target species. Implement by-catch reduction plans for sensitive and vulnerable species/stocks.
• Phase out non-selective and destructive fishing practices (e.g. bottom contacted gears, like bottom trawling or dredges) starting in all the “paper park” MPAs where no fishing activity restrictions have been implemented.
• Establish a network of Essential Fish Habitats (spawning, nursery and feeding grounds) in UK waters to contribute to the rebuilding and sustainable exploitation of fish resources.
• Prevent illegal, unreported, and unregulated (IUU) fishing by ensuring adequate control and enforcement of fisheries in UK waters, of the UK fleet in international waters, and imports of fisheries products.
© OCEANA / Yuri Smishkewych
7.2 Management of stocks shared with third countries
Many important UK fish resources are shared stocks with third countries. So, joint agreement on management measures with those countries is crucial to ensure the sustainable exploitation of the stocks, which is impossible to achieve through unilateral action alone.
To facilitate the adoption of joint management measures for the shared stocks, the UK has become a NEAFC contracting party138, and established bilateral agreements and memorandums of understanding with the main North East Atlantic coastal fishing states, including Norway3, the Faroe Islands139 , Greenland140 and Iceland141, plus the EU2. While such arrangements provide the management and negotiation frameworks, relevant annual management measures to be agreed, like the setting of fishing opportunities, still depend on the results of the annual negotiations between the UK and the third countries.
The status of most North East Atlantic fish stocks, and hence the socio-economic performance of the European fleet, depends to a large extent on the collaboration and international agreements, for instance the UK shares over 100 fish stocks with the EU. Unfortunately, international agreements for North East Atlantic shared stocks do not always deliver the optimum utilisation of the fishery resources, such as the frequent lack of agreement on stock shares that lead to the setting of unilateral quotas which in turn exceed the agreed TAC and the scientific advice, leading to overfishing.
The UK and the third countries with which it shares fish resources must become constructive partners in the fight against overfishing, biodiversity loss and climate change. Only international cooperation with common objectives, transparency and accountability will address those transboundary challenges.
To facilitate the sustainable exploitation of shared fish stocks Oceana endorses the following recommendations:
• Condition the reciprocal access to waters and resources on sustainability, transparency and legality of the fisheries concerned. Science-based management must underpin all the international fisheries agreements and management decisions.
• Establish long-term political agreements on allocation keys for the respective quota shares to ensure that total catches do not exceed the agreed catch limits and to provide stability to the fishing sector.
• Manage shared stocks jointly according to the best available scientific advice and a common methodology of an independent, non-biased and widely acknowledged organisation such as ICES (of which the UK and North Atlantic coastal countries are members142). All parties should collaborate in the collection and sharing of data to elaborate the stock assessment.
94 UK FISHERIES AUDIT 2021
• Set fishing opportunities for shared stocks in line with the best available scientific advice and long-term management strategies that include precautionary harvest control rules. For fully assessed stocks, fishing opportunities must not exceed the FMSY. For data-limited and vulnerable stocks, the precautionary approach should be followednnn .
• The management of shared stocks should be consistent with the obligations and rights under the (Aarhus) Convention on Access to Information, Public Participation in Decision-Making and Access to Justice in Environmental Matters143. Management proposals and negotiation process should be made transparently, with access guaranteed for all stakeholders.
Oceana hopes that this UK Fisheries Audit report and above recommendations will contribute to UK policy-making and support UK progress on ending overfishing, international commitments, and switching to fully sustainable fisheries.
nnn Agreements on shared stocks must implement a genuine precautionary approach as defined by the United Nations Fish Stock Agreement (UNFSA, 1995; https://www.un.org/Depts/los/convention_agreements/texts/fish_stocks_agreement/CONF164_37.htm). When the available data and information are uncertain, unreliable, or inadequate, decision makers should engage in more cautious management, and a lack of scientific certainty cannot preclude management action.
95 UK FISHERIES AUDIT 2021
© OCEANA / Carlos Minguell
Appendices
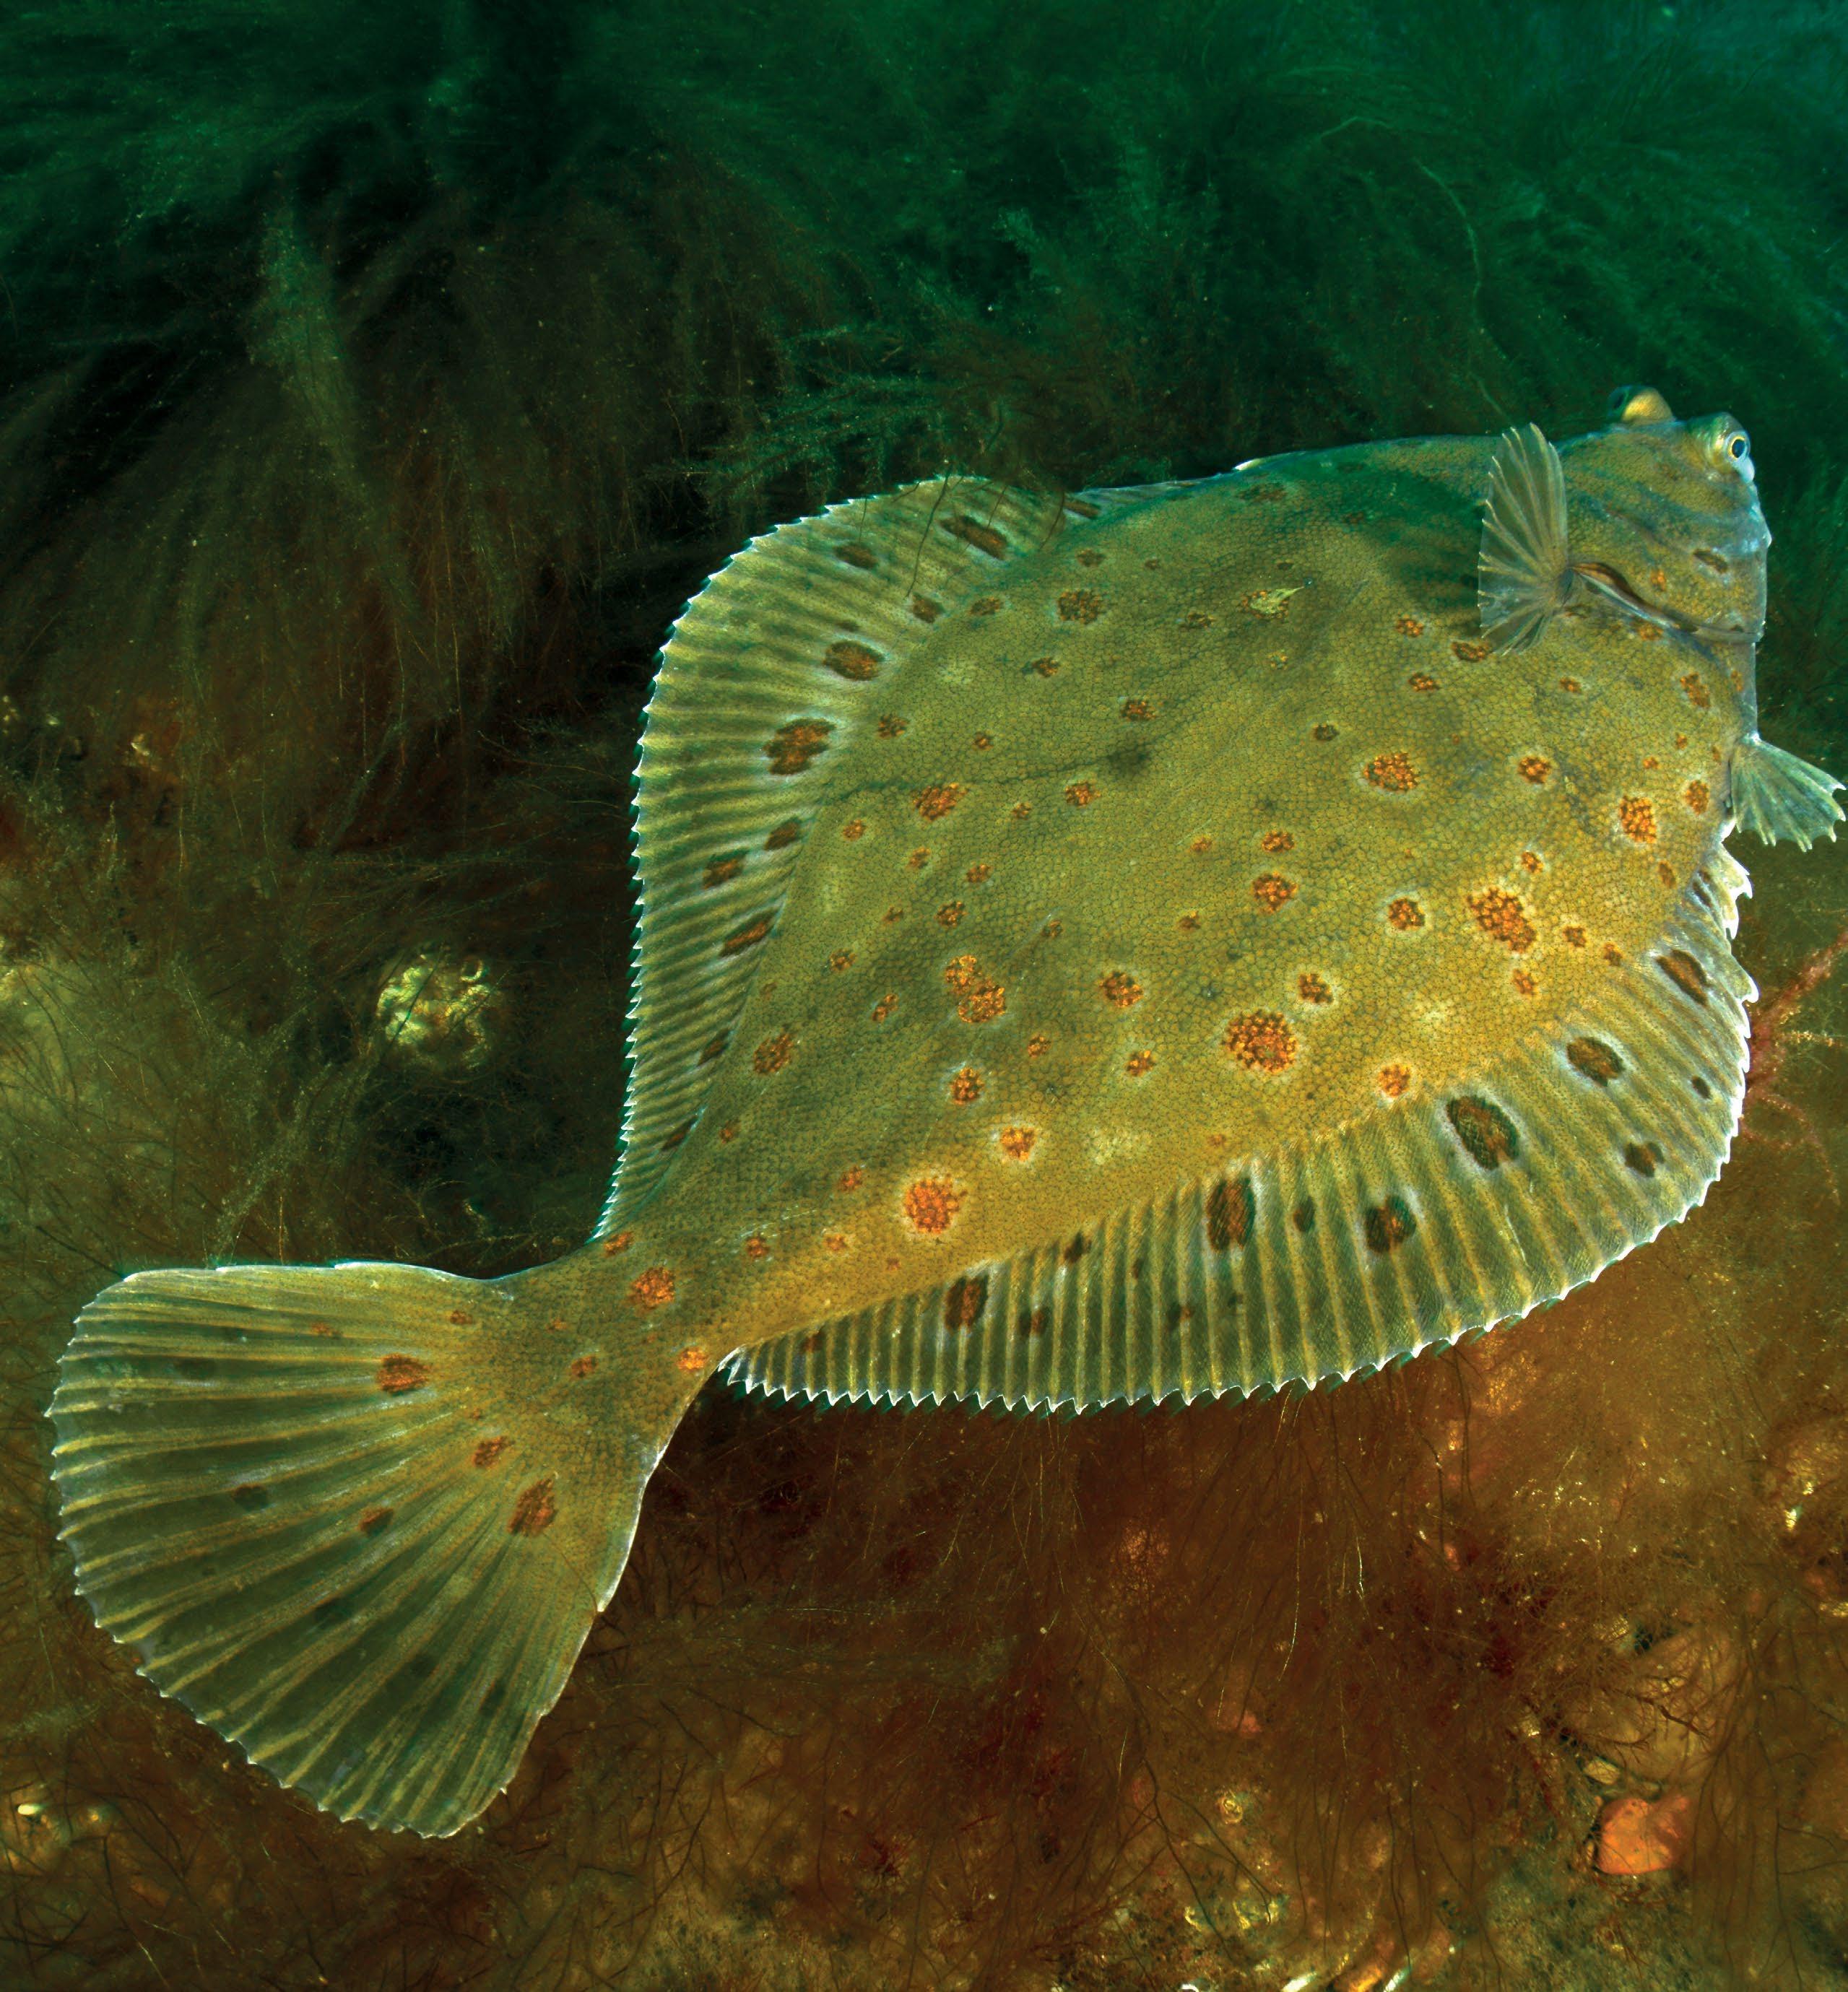
96 UK FISHERIES AUDIT 2021
Cod (Gadus morhua) in Division 6.a (West of Scotland)
Cod (Gadus morhua) in Division 7.a (Irish Sea)
Cod (Gadus morhua) in divisions 7.e–k (western English Channel and southern Celtic Seas)
Megrim (Lepidorhombus spp.) in divisions 4.a and 6.a (northern North Sea, West of Scotland)
Megrim (Lepidorhombus whiffiagonis) in divisions
7.b–k, 8.a–b, and 8.d (west and southwest of Ireland, Bay of Biscay)
Anglerfish (Lophius budegassa, Lophius piscatorius) in subareas 4 and 6 and in Division 3.a (North Sea, Rockall and West of Scotland, Skagerrak and Kattegat)
White anglerfish (Lophius piscatorius) in Subarea 7 and in divisions 8.a–b and
8.d (southern Celtic Seas, Bay of Biscay)
Black-bellied anglerfish (Lophius budegassa) in Subarea 7 and divisions
8.a–b and 8.d (Celtic Seas, Bay of Biscay)
Haddock (Melanogrammus aeglefinus) in Subarea 4, Division 6.a, and Subdivision 20 (North Sea, West of Scotland, Skagerrak)
cod.27.6a
West of Scotland
6a; EU and int. waters of 5b east of 12º 00' W (by-catches)
COD/5BE6A West of Scotland
cod.27.7a Irish Sea 7a COD/07A Irish Sea
cod.27.e-k Celtic Sea, English Channel
lez.27.4a6a North Sea, West of Scotland
meg.27.7bk8abd Celtic Sea, English Channel
7b, 7c, 7e-k, 8, 9 and 10; Union waters of CECAF 34.1.1
COD/7XAD34 Celtic Sea, English Channel
EU waters of 2a and 4 LEZ/2AC4-C North Sea
EU and int. waters of 5b; 6 LEZ/56-14 West of Scotland
7 LEZ/07 Celtic Sea, English Channel, Irish Sea
EU waters of 2a and 4
anf.27.3a46 North Sea, West of Scotland
mon.27.78abd Celtic Sea, English Channel
ank.27.78abd Celtic Sea, English Channel
had.27.46a20 North Sea, West of Scotland
Haddock (Melanogrammus aeglefinus) in Division 6.b (Rockall) had.27.6b
Haddock (Melanogrammus aeglefinus) in divisions 7.b–k (southern Celtic Seas and English Channel) had.27.7b-k
Haddock (Melanogrammus aeglefinus) in Division 7.a (Irish Sea) had.27.7a
Whiting (Merlangius merlangus) in Subarea 4 and Division 7.d (North Sea and eastern English Channel)
Whiting (Merlangius merlangus) in Division 6.a (West of Scotland)
West of Scotland
Celtic Sea, English Channel
Irish Sea
whg.27.47d
ANF/2AC4-C North Sea
6; EU and int. waters of 5b; int. waters of 12 and 14 ANF/56-14 West of Scotland
Megrims Lepidorhombus spp.
whg.27.6a
7 ANF/07 Celtic Sea, English Channel, Irish Sea
4; EU waters of 2a
HAD/2AC4 North Sea
5b,6a HAD/5BC6A West of Scotland
EU and int. waters of 6b, 12 and 14
7b-k, 8, 9 and 10; EU waters of CECAF
34.1.1
7a
North Sea, English Channel
West of Scotland
HAD/6B1214
West of Scotland
HAD/7X7A34
HAD/07A
4; EU waters of 2a
6; EU and int. waters of 5b; int. waters of 12 and 14 (by-catches)
Celtic Sea, English Channel
Irish Sea
WHG/2AC4
North Sea
Anglerfish Lophiidae
WHG/56-14
West of Scotland
Haddock Melanogrammus aeglefinus
Whiting Merlangius merlangus
98 UK FISHERIES AUDIT 2021
Advice stock area (ICES/ other) Advice code (ICES) Sea
stock Management
(EU) Sea
-
Species
basin(s)
area Management unit code
basin(s)
management unit
Norway lobster (Nephrops norvegicus) in Division 4.b, Functional Unit 6 (central North Sea, Farn Deeps)
Norway lobster (Nephrops norvegicus) in Division 4.b, Functional Unit 8 (central North Sea, Firth of Forth)
Norway lobster (Nephrops norvegicus) in Division 4.a, Functional Unit 9 (central North Sea, Moray Firth)
Norway lobster (Nephrops norvegicus) in Division 6.a, Functional Unit 11 (West of Scotland, North Minch)
Norway lobster (Nephrops norvegicus) in Division 6.a, Functional Unit 12 (West of Scotland, South Minch)
Norway lobster (Nephrops norvegicus) in Division 6.a, Functional Unit 13 (West of Scotland, the Firth of Clyde, and the Sound of Jura)
Norway lobster (Nephrops norvegicus) in Division 7.a, Functional Unit 14 (Irish Sea, East)
Norway lobster (Nephrops norvegicus) in Division 7.a, Functional Unit 15 (Irish Sea, West)
Norway lobster (Nephrops norvegicus) in Division 7.b, Functional Unit 17 (west of Ireland, Aran grounds)
Norway lobster (Nephrops norvegicus) in divisions 7.a,
7.g, and 7.j, Functional Unit 19 (Irish Sea, Celtic Sea, eastern part of southwest of Ireland)
Norway lobster (Nephrops norvegicus) in divisions
7.b–c and 7.j–k, Functional Unit 16 (west and southwest of Ireland, Porcupine Bank)
Norway lobster (Nephrops norvegicus) in divisions 7.g and 7.f, Functional Unit 22 (Celtic Sea, Bristol Channel)
Norway lobster (Nephrops norvegicus) in divisions 7.g and 7.h, functional units 20 and 21 (Celtic Sea)
Plaice (Pleuronectes platessa) in Subarea 4 (North Sea) and Subdivision 20 (Skagerrak)
nep.fu.6 North Sea
nep.fu.8 North Sea
nep.fu.9 North Sea
nep.fu.11
West of Scotland
nep.fu.12 West of Scotland
nep.fu.13 West of Scotland
6; EU and int. waters of 5b NEP/5BC6 West of Scotland
nep.fu.14 Irish Sea
nep.fu.15 Irish Sea
nep.fu.17 Celtic Sea
nep.fu.19 Celtic Sea, Irish Sea
nep.fu.16 Celtic Sea
7 NEP/07 Celtic Sea, Irish Sea
Norway lobster Nephrops norvegicus
nep.fu.22 Celtic Sea
nep.fu.2021 Celtic Sea
ple.27.420
North Sea
4; EU waters of 2a; that part of 3a not covered by the Skagerrak and the Kattegat
100 UK FISHERIES AUDIT 2021
North
Advice
Advice
Sea
Species
PLE/2A3AX4
Sea
stock area (ICES/ other)
code (ICES) Sea basin(s)stock Management area Management unit code (EU)
basin(s) - management unit
Advice stock area (ICES/ other) Advice code (ICES) Sea basin(s)stock Management area Management unit code (EU) Sea basin(s) - management unit
Blonde ray (Raja brachyura) in divisions 4.c and 7.d (southern North Sea and eastern English Channel)
Thornback ray (Raja clavata) in Subarea 4 and in divisions 3.a and 7.d (North Sea, Skagerrak, Kattegat, and eastern English Channel)
Spotted ray (Raja montagui) in Subarea 4 and in divisions 3.a and 7.d (North Sea, Skagerrak, Kattegat, and eastern English Channel)
rjh.27.4c7d English Channel, North Sea
rjc.27.3a47d English Channel, North Sea
rjm.27.3a47d English Channel, North Sea
Species
Raja brachyura
EU waters of 2a and 4 SRX/2AC4-C North Sea Raja clavata
7d SRX/07D English Channel Raja montagui
EU waters of 2a and 4 SRX/2AC4-C North Sea Raja microocellata
7d SRX/07D English Channel Skates and rays
7d SRX/07D English Channel Raja undulata
EU waters of 2a and 4 SRX/2AC4-C North Sea Reinhardtius hippoglossoides
Small-eyed ray (Raja microocellata) in divisions 7.d and 7.e (English Channel) rje.27.7de English Channel 7d SRX/07D English Channel Raja microocellata
Undulate ray (Raja undulata) in divisions 7.d–e (English Channel) rju.27.7de English Channel EU waters of 7d and 7e RJU/7DE English Channel Undulate ray Raja undulata
Greenland halibut (Reinhardtius hippoglossoides) in subareas 5, 6, 12, and 14 (Iceland and Faroes grounds, West of Scotland, North of Azores, East of Greenland)
ghl.27.561214 West of Scotland
EU waters of 2a and 4; EU and int. waters of 5b and 6
Mackerel (Scomber scombrus) in subareas 1–8 and 14, and in Division 9.a (the Northeast Atlantic and adjacent waters)
mac.27.nea
GHL/2A-C46
North Sea, West of Scotland Greenland halibut
Reinhardtius hippoglossoides
3a and 4; EU waters of 2a, 3b, 3c and Subdivisions 22-32
Celtic Sea, West of Scotland, Irish Sea, English Channel
MAC/2A34
North Sea
Sole (Solea solea) in Division
(Irish Sea)
Sole (Solea solea) in Division 7.d (eastern English Channel)
Sole (Solea solea) in Division
(western English Channel)
Sole (Solea solea) in divisions 7.f and 7.g (Bristol Channel, Celtic Sea)
Sole (Solea solea) in divisions 7.h–k (Celtic Sea South, southwest of Ireland)
Sprat (Sprattus sprattus) in divisions 7.d and 7.e (English Channel)
Spurdog (Squalus acanthias) in the Northeast Atlantic dgs.27.nea
EU and intern. waters of 1, 5, 6, 7, 8, 12 and 14
MAC/2CX14
Celtic Sea, West of Scotland, Irish Sea, English Channel
Mackerel Scomber scombrus 6, 7, 8a, 8b, 8d and 8e; EU and int. waters of 5b; int. waters of 2a, 12 and 14
Common sole Solea solea
102 UK FISHERIES AUDIT 2021
7.a
sol.27.7a Irish Sea 7a SOL/07A Irish Sea
sol.27.7d English Channel 7d SOL/07D English Channel
sol.27.7e English Channel 7e SOL/07E English Channel
7.e
sol.27.7fg Celtic Sea 7fg SOL/7FG Celtic Sea
sol.27.7h-k Celtic Sea 7hjk SOL/7HJK Celtic Sea
spr.27.7de English Channel 7de SPR/7DE English Channel Sprat Sprattus sprattus
Celtic Sea, West of Scotland, Irish Sea, English Channel DGS/15X14
Celtic Sea, West of Scotland, Irish Sea, English Channel Spurdog Squalus acanthias
Horse mackerel (Trachurus trachurus) in divisions 3.a, 4.b–c, and 7.d (Skagerrak and Kattegat, southern and central North Sea, eastern English Channel)
hom.27.3a4bc7d
North Sea, English Channel EU waters of 4b, 4c and 7d JAX/4BC7D
North Sea, English Channel
hom.27
.2a4a5b6a7a-ce-k8
Celtic Sea, West of Scotland, Irish Sea, English Channel, North Sea
The Wash no ICES advice North Sea
Thames Estuary no ICES advice North Sea
ICES Subdivision 27.7.eInshore Cornwall no ICES advice English Channel
EU waters of 2a, 4a; 6, 7a-c,7e-k, 8abde; EU and intern. waters of 5b; intern. waters of 12 and 14
JAX/2A-14
Celtic Sea, West of Scotland, Irish Sea, English Channel, North Sea
Horse mackerel Trachurus spp. Horse mackerel (Trachurus trachurus) in Subarea 8 and divisions 2.a, 4.a, 5.b, 6.a, 7.a–c, and 7.e–k (the Northeast Atlantic)
The Wash non-quota North Sea
Thames Estuary non-quota
ICES Subdivision 27.7.e
North Sea
Cockles Cerastoderma edule
103 UK FISHERIES AUDIT 2021
- Inshore Cornwall non-quota Celtic Sea King scallops Pecten maximus ICES Subdivision 27.7.eOffshore Cornwall no ICES advice English Channel ICES Subdivision 27.7.e - Offshore Cornwall non-quota Celtic Sea ICES Subdivision 27.7.eLyme Bay no ICES advice English Channel ICES Subdivision 27.7.e - Lyme Bay non-quota English Channel ICES Subdivision 27.7.dSouth no ICES advice English Channel ICES Subdivision 27.7.d - South non-quota English Channel ICES Subdivision 27.7.f.IBristol Channel no ICES advice Celtic Sea ICES Subdivision 27.7.f.I - Bristol Channel non-quota Celtic Sea ICES Subdivision 27.4.bNorth Sea South no ICES advice North Sea ICES Subdivision 27.4.b - North Sea South non-quota North Sea ICES Subdivision 27.4.b no ICES advice North Sea Central North Sea non-quota North Sea Edible crab Cancer pagurus ICES Subdivision 27.4.b,c no ICES advice North Sea Southern North Sea non-quota North Sea ICES Subdivision 27.7.e,f,h no ICES advice English Channel, Celtic Sea Western English Channel non-quota English Channel, Celtic Sea ICES Subdivision 27.7.f,g,a no ICES advice Celtic Sea, Irish Sea Celtic Sea non-quota Celtic Sea, Irish Sea ICES Subdivision 27.7.d, 4.c no ICES advice English Channel, North Sea Eastern English Channel non-quota English Channel, North Sea Advice stock area (ICES/ other) Advice code (ICES) Sea basin(s)stock Management area Management unit code (EU) Sea basin(s) - management unit Species
104 UK FISHERIES AUDIT 2021 ICES Subdivision 27.4.b no ICES advice North Sea Northumberland and Durham non-quota North Sea Lobster Homarus gammarus ICES Subdivision 27.4.b no ICES advice North Sea Yorkshire Humber non-quota North Sea ICES Subdivision 27.4.c no ICES advice North Sea East Anglia non-quota North Sea ICES Subdivision 27.7.d,e no ICES advice English Channel Southeast South Coast non-quota English Channel ICES Subdivision 27.7.e,f no ICES advice English Channel, Celtic Sea Southwest non-quota English Channel, Celtic Sea Seabass (Dicentrarchus labrax) in divisions 4.b–c, 7.a, and 7.d–h (central and southern North Sea, Irish Sea, English Channel, Bristol Channel, and Celtic Sea) bss.27.4bc7ad-h North Sea, Irish Sea, English Channel, Celtic Sea 4bc, 7 non-quota North Sea, Irish Sea, English Channel, Celtic Sea Seabass Dicentrarchus labrax EIFCA district no ICES advice North Sea Eastern IFCA District non-quota North Sea Whelks Buccinum undatum K&EIFCA district no ICES advice North Sea Kent and Essex IFCA District non-quota North Sea Advice stock area (ICES/ other) Advice code (ICES) Sea basin(s)stock Management area Management unit code (EU) Sea basin(s) - management unit Species
Appendix 2 – Stock and Exploitation status indicator methodology
Indicators of stock size and stock exploitation status were derived from the most recent ICES advice or alternative (‘other’) stock assessments. These indicators are based on assessments of the stock size
and fishing rates against MSY reference points, where available. The categorisation in Table 3 and Table 4 was applied to form the indicators.
ICES/Otherooo Stock size (SSB) indicator Stock Size Indicator (UK Fisheries Audit)
Table 3: Stock size status indicators
ICES/Otherooo Fishing pressure (F) indicator Exploitation Indicator (UK Fisheries Audit)
Table 4: Exploitation status indicators
ooo Applies to non-quota stocks, such as crabs and lobsters, assessed by Cefas
105 UK FISHERIES AUDIT 2021
SSB at or above Btrigger or Btrigger proxy or BMSY target ooo Healthy SSB below Btrigger or Btrigger proxy or BMSY target ooo Critical No reference point / exploitation status unknown Data limited Not assessed Unknown
F at or below FMSY or FMSY proxy or FMSY target ooo Sustainably exploited F above FMSY or FMSY proxy or FMSY target ooo Overfished No reference point / exploitation status unknown Data limited Not assessed Unknown
For data sufficientppp quota stocks, the exploitation status indicator evaluates the estimated level of recent fishing mortality relative to FMSY, defined as the maximum fishing mortality that would enable the stock to reach or maintain BMSY – the biomass reference point that enables a stock to deliver its MSY.
Stock size status is based on the ICES biomass reference point ‘MSY Btrigger’, defined as the parameter in the ICES advice framework which triggers a more cautious response, typically reduced fishing mortality (F) to allow the stock to rebuild to levels compatible with MSY (F<FMSY)9. Whilst this reference point reflects the lower bound of stock size fluctuation around BMSY, therefore with limited scope for an arguably more precautionary management response
(e.g. management action is triggered when the stock is <BMSY rather than at or approaching it), it is widely established as an appropriate reference for MSY62. It is therefore used as the basis of the stock status indicator for ease of understanding, acceptance and repetition.
For stocks that are more data limitedqqq , ICES classify stock and exploitation status relative to MSY proxies (MSY Btrigger proxy or FMSY proxy) under the precautionary approach to advice provision. Assessment of the status of the non-quota stocks is also based on a proxy MSY level (European lobster144 ; Edible crab145 ) or MSY candidate harvest rate (King scallop34). The proportion of stocks for which the indicators are based on these proxy reference points is stated to show the relative distribution of lower and higher confidence assessments.
https://www.ices.dk/sites/pub/Publication%20Reports/Advice/2019/2019/Introduction_to_advice_2019.pdf
ppp ICES categories 1 or 2 stocks:
qqq ICES category 3 or 4 stocks 106 UK FISHERIES AUDIT 2021
Appendix 3 – Focus stock analysis methodology
In addition to the data sources and analyses described in Section 3.3, information was collated on the stock specific TACs advised by ICES and agreed TACs (by EU AGRIFISH Council) for the corresponding management units, for a five-year (2016-2020) period and the percentage difference calculated. These analyses also inform Case Study 1 (in Section 5). For some management units, this was not possible due to an advised zero TAC (see Case study 2) or incompatible ICES advice (stock) and management units.
Landings data for 2019 for each focus stock (management unit) for UK vessels in the UK EEZ by fisheries administration were sourced from the MMO26. Analyses based on vessel size category (10 m and under, over 10 m) required exclusion of records with no specified vessel length. Information on quota uptake in 201919 is provided to add additional context to the contribution of the focus stocks to the UK fishing industry. These uptake figures are based on EU landings data for each Member State in relation to the final or adjusted TAC for each country. That TAC may be higher or lower than the initial relative stability share, due to for example international quota swaps, banking or borrowing of quota, in-year TAC adjustments, etc, as described in brief in Section 2. For the purposes of the report, the percentage uptake is also calculated relative to the initial quota allocation for the UK, based on the UK landings figures for 2019 held by the EUrrr .
To provide an estimate of the volume of unsustainable catches in 2019, for those focus stocks where the exploitation status was categorised as ‘overfished’, the total catch (based on ICES landings and discard figures in the advice sheetssss) in excess of the advised TAC was calculated. To determine an approximate value for the UK fleet, the UK’s percentage quota sharettt was applied to the estimate of total unsustainable catch. In turn, the UK unsustainable catch estimate was provided as a percentage of the UK’s 2019 landings (in all applicable areas, not just UK waters)19. These estimates are only indicative as there are various likely sources of inaccuracies in the calculation. These include errors in the catch data that cannot be quantified, for example arising from underestimation due to unreported discarding or from misalignment between advised TACs at the stock level and catches at the management unit level. Also, differences between the UK’s (or any nation’s) initial relative stability share and final share of the total catches are likely, due to quota movement processes described above.
Where applicable, the proportional allocation of the UK’s quota between the devolved countries is presented (based on the MMO’s allocations in 2020146).
rrr Table 2.12 of Section 2 Landings file; differences between Member State and EU landings records often exist due to time lags in reporting and/or discrepancies between data sources (see methodology): https://www.gov.uk/government/statistics/uk-sea-fisheries-annual-statisticsreport-2019
sss Where the ICES stock unit aligns with >1 management unit (TAC area) the catches for all management units were used in the calculation. tttRelative stability share (North Sea whiting), average % share as the advised TAC applied to >1 TAC area (North Sea cod) or % share of overall TAC received by UK (NE Atlantic blue whiting)
107 UK FISHERIES AUDIT 2021
Appendix 4 – Glossary
Stock unit refers to a part of a fish population usually with a particular migration pattern, specific spawning grounds, and subject to a distinct fishery. In theory, a stock unit comprises all the individuals of fish in an area, which are part of the same reproductive process. It is self-contained, with no emigration or immigration of individuals from or to the stock .
Management unit is the component of the stock unit that is considered a ‘stock’ for the purposes of fisheries managementuuu .
Total Allowable Catch (TAC) is a catch limit set for a particular fishery, typically for a fishing year or season. TACs set by the European Commission are typically for a given management unit.
Fixed Quota Allocation (FQA) is a system designed to allocate quota as a percentage of total available quota, to a certain fishing licence, based on historical average landings
ICES is the International Council for the Exploration of the Sea (www.ices.dk): ‘an intergovernmental marine science organization, meeting societal needs for impartial evidence on the state and sustainable use of our seas and oceans’.
Landings mean the part of the total catch that is physically landed at a port. Landed fish may be whole, gutted and headed or filleted.
Catches mean all fish taken from the sea regardless of whether they are landed (also referred to as wanted catch) or discarded (known as unwanted catch) back into the sea.
Maximum Sustainable Yield (MSY) is a theoretical maximum yield (catch) that can be taken from a stock in the long term under constant environmental conditions when that stock is at the biomass reference point BMSY
Blim is the limit biomass reference point, below which the stock has reduced reproductive capacity and an increased risk of stock collapse.
BMSY is a biomass reference point which in theory represents the stock size at maximum population growth rate and therefore the biomass of a stock at which it could deliver its MSY.
Fishing mortality (F) is a parameter used in fisheries population dynamics (which forms the basis of stock assessments) to account for the rate of loss of organisms from a population due to removals associated with fishing
108 UK FISHERIES AUDIT 2021
uuu Taken from:
http://www.ices.dk/community/Documents/Advice/Acronyms_and_terminology.pdf
Flim is the fishing mortality which will result in an average stock size of Blim in the long term.
FMSY is the fishing mortality rate that should, on average (all other things being equal) lead to a stock reaching BMSY
Btrigger is a biomass reference point defined as the parameter in the ICES advice framework which triggers a more cautious response, typically reduced fishing mortality, to allow the stock to rebuild to levels compatible with MSY (F<FMSY)
Spawning Stock Biomass (SSB) is typically the metric used to indicate the status of a stock. SSB represents the reproductive capacity of the stock as it is an estimate of the combined weight of all (mature) individuals which are capable of reproducing.
Demersal refers to fish species living on or near the sea floor.
Pelagic refers to fish species found mainly in shoals in midwater or near the sea surface
Shellfish covers all crustaceans (such as crabs and lobsters) and molluscs (such as scallops and mussels)
109 UK FISHERIES AUDIT 2021
8.References
1. Fisheries Act. 2020. UK Public General Acts, 23 November 2020. Available from: https://www.legislation.gov.uk/ ukpga/2020/22/enacted/data.pdf
2. UK Government. 2020. Trade and Cooperation Agreement between the United Kingdom of Great Britain and Northern Ireland and the European Union. Available from: https://assets. publishing.service.gov.uk/government/uploads/system/uploads/ attachment_data/file/948119/EU-UK_Trade_and_Cooperation_ Agreement_24.12.2020.pdf
3. UK Government. 2020. Framework Agreement on Fisheries between the United Kingdom of Great Britain and Northern Ireland and the Kingdom of Norway. Norway No. 1 (2020). London, 30 September 2020. Available from: https://assets. publishing.service.gov.uk/government/uploads/system/uploads/ attachment_data/file/927151/CS_Norway_1.2020_UK_Norway_ Framework_Agreement_on_Fisheries.pdf
4. Department for Environment, Food and Rural Affairs (DEFRA). 2018. Fisheries white paper: Sustainable fisheries for future generations. 25 October 2018. Available from: https://www.gov. uk/government/consultations/fisheries-white-paper-sustainablefisheries-for-future-generations/sustainable-fisheries-for-futuregenerations-consultation-document
5. Department for Environment, Food and Rural Affairs (DEFRA). 2019. Marine Strategy Part One: UK updated assessment and Good Environmental Status. October 2019. Available from: https://assets.publishing.service.gov.uk/government/uploads/ system/uploads/attachment_data/file/921262/marine-strategypart1-october19.pdf
6. Scientific, Technical and Economic Committee for Fisheries (STECF). 2020. Monitoring the performance of the Common Fisheries Policy (STECF-Adhoc-20-01). Publications Office of the European Union, Luxembourg, 2020. Available from: https:// publications.jrc.ec.europa.eu/repository/bitstream/JRC120481/ kj-ax-20-002-en-n.pdf
7. Scientific, Technical and Economic Committee for Fisheries (STECF). 2020. The 2019 Annual Economic Report on the EU Fishing Fleet (STECF 19-06). Carvalho N, Keatinge M, Guillen Garcia J. editor(s), EUR 28359 EN, Publications Office of the European Union, Luxembourg, 2019. Available from: https:// stecf.jrc.ec.europa.eu/documents/43805/2483556/STECF +19-06+-+AER+-+2019.pdf/db370547-4405-416db2e3-76f8276edae2
8. European Parliament, Council of the European Union. 2013. Regulation (EU) No 1380/2013 of the European Parliament and of the Council of 11 December 2013 on the Common Fisheries Policy, amending Council Regulations (EC) No 1954/2003 and (EC) No 1224/2009 and repealing Council Regulations (EC) No 2371/2002 and (EC) No 639/2004 and Council Decision 2004/585/EC. Available from: https://eur-lex.europa.eu/legalcontent/EN/ALL/?uri=CELEX:32013R1380
9. ICES. 2019. Advice basis. In Report of the ICES Advisory Committee, 2019, section 1.2. Available from: https://www. ices.dk/sites/pub/Publication%20Reports/Advice/2019/2019/ Introduction_to_advice_2019.pdf
10. Client Earth. 2020. Taking stock 2020 - are TACs set to achieve MSY? October 2020. Available from: https://www.documents. clientearth.org/wp-content/uploads/library/2020-10-12-takingstock-2020-are-tacs-set-to-achieve-msy-ce-en.pdf
11. European Commission. 2020. Towards more sustainable fishing in the EU: state of play and orientations for 2021. Available from: https://eur-lex.europa.eu/legal-content/EN/TXT/ PDF/?uri=CELEX:52020SC0112&from=EN
12. European Commission. 2020. Discarding and the Landing Obligation. Available from: https://ec.europa.eu/fisheries/cfp/ fishing_rules/discards_en
13. European Parliament and of the Council of 11 December 2013 on the Common Fisheries Policy, amending Council Regulations (EC) No 1954/2003 and (EC) No 1224/2009 and repealing Council Regulations (EC) No 2371/2002 and (EC) No 639/2004 and Council Decision 2004/585/EC. Available from: https://eur-lex.europa.eu/legal-content/EN/TXT/ PDF/?uri=CELEX:32013R1380&from=EN
14. European Parliament and of the Council of 4 July 2018 establishing a multiannual plan for demersal stocks in the North Sea and the fisheries exploiting those stocks, specifying details of the implementation of the landing obligation in the North Sea and repealing Council Regulations (EC) No 676/2007 and (EC) No 1342/2008. Available from: https://eur-lex.europa.eu/legalcontent/EN/TXT/PDF/?uri=CELEX:32018R0973&from=en
15. European Parliament and the council of 19 March 2019 establishing a multiannual plan for stocks fished in the Western Waters and adjacent waters, and for fisheries exploiting those stocks, amending Regulations (EU) 2016/1139 and (EU) 2018/973, and repealing Council Regulations (EC) No 811/2004, (EC) No 2166/2005, (EC) No 388/2006, (EC) No 509/2007 and (EC) No 1300/2008. Available from: https://eur-lex.europa.eu/legal-content/EN/TXT/ PDF/?uri=CELEX:32019R0472&from=en
16. European Parliament. 2008. Commission answers in response to Parliamentary questions. Available from: https://www. europarl.europa.eu/sides/getAllAnswers.do?reference=E-20080139&language=EN
17. UK Government. 2015. Rules for the management of the UK’s fisheries quotas in areas I, II, IV, VI and VII (and associated areas) and in the Faroese waters (Vb) for 2015. Department for Environment, Food and Rural Affairs, Marine Management Organisation, Marine Scotland, Welsh Government and the Department of Agriculture and Rural Development. Available from: https://assets.publishing.service.gov.uk/government/uploads/ system/uploads/attachment_data/file/914714/UK_2015_Quota_ management_rules.pdf
18. New Economics foundation. 2018. A Fair and Sustainable Fisheries Bill and Post-Brexit Legislation. Available from: https:// neweconomics.org/uploads/files/fisheries-briefing.pdf
19. Marine Management Organisation. 2020. UK Sea Fisheries Annual Statistics Report 2019. Available from: https://www. gov.uk/government/statistics/uk-sea-fisheries-annual-statisticsreport-2019
20. New Economics Foundation. 2017. Not in the Same Boat. Available from: https://neweconomics.org/uploads/files/Not-inthe-Same-Boat-PDF.pdf
21. Hoefnagel E, De Vos B, Buisman E. 2015. Quota swapping, relative stability, and transparency. Marine Policy. vol. 57. pp. 111-119, https://doi.org/10.1016/j.marpol.2015.03.012
110 UK FISHERIES AUDIT 2021
22. Marine Management Organisation. 2019. Guidance for dealing with choke scenarios under the landings obligation. Available from: https://assets.publishing.service.gov.uk/government/ uploads/system/uploads/attachment_data/file/755157/Dealing_ with_choke_scenarios.pdf
23. Dowler C. 2018. Revealed: the millionaires hoarding UK fishing rights. Available from: https://unearthed.greenpeace. org/2018/10/11/fishing-quota-uk-defra-michael-gove/
24. UK Government. 2020. FQA Register. Department for Environment, Food and Rural Affairs, Marine Management Organisation, Marine Scotland, Welsh Government and the Department of Agriculture, Environment and Rural Affairs. Available from: https://www.fqaregister.service.gov.uk/
25. Greenpeace. 2018. Uncovered: the Rich List “Codfathers” dominating the UK’s fishing industry. Available from: https:// www.greenpeace.org.uk/news/uncovered-rich-list-codfathersdominating-uks-fishing-industry/
26. Marine Management Organisation. 2020. UK Commercial Sea Fisheries Landings by Exclusive Economic Zone of Capture Report 2019. Available from: https://www.gov.uk/government/ statistics/uk-commercial-sea-fisheries-landings-by-exclusiveeconomic-zone-of-capture-report-2019
27. ICES. 2020. Advice 2020. Available from: https://www.ices.dk/ advice/Pages/Latest-Advice.aspx
28. Quintana MM, Miliken K, Motova A. 2020. Economics of the UK fishing fleet 2019. Seafish Report No. SR749. Seafish, Edinburgh, 2020. Available from: https://www.seafish.org/ document/?id=C0640CF9-A9C8-4D03-8C35-6F7A966AD056
29. UK Government. 2019. Co-designing the principles for defining low impact fishing. Available from: https://www. contractsfinder.service.gov.uk/Notice/c568cdaf-7231-40a1-acc3276a704951d6
30. Countryside and Community Research Institute. 2019. Co-Designing the principles for defining low impact fishing. Available from: http://www.ccri.ac.uk/lowimpactfishing/
31. Eurostat. 2020. Catches in all fishing regions. Available from: https://ec.europa.eu/eurostat/databrowser/view/tag00076/ default/table?lang=en
32. Uberoi E, Hutton G, Ward M, Ares E. 2020. UK Fisheries Statistics. Available from: https://researchbriefings.files. parliament.uk/documents/SN02788/SN02788.pdf
33. Rutherford J. 2009. "Sea fish" in Feeding Britain, Bridge J & Johnson N, eds., The Smith Institute, London.
34. Lawler A, Nawri N. 2019. Assessment of scallop stock status for selected waters around the English Coast 2018/2019. Cefas Project Report for Defra. Available from: https://www.gov.uk/ government/publications/assessment-of-scallops-stocks-201819
35. The Fishing Daily. 2020. Nurturing Green Shoots for Haddock in the Irish Sea – Dr Ronán Cosgrove, 15 May 2020. Available from: https://thefishingdaily.com/latest-news/nurturing-greenshoots-for-haddock-in-the-irish-sea-dr-ronan-cosgrove
36. Seafish. 2019. Market Insight Factsheet: Cod (2019). Available from: https://www.seafish.org/document/?id=5ee125a5-e7cb4215-ab04-80e174a5098e
37. ICES. 2020. Cod (Gadus morhua) in Division 7.a (Irish Sea). In Report of the ICES Advisory Committee, 2020. ICES Advice 2020, cod.27.7a. Available from: http://ices.dk/sites/pub/ Publication%20Reports/Advice/2020/2020/cod.27.7a.pdf
38. ICES. 2019. Cod (Gadus morhua) in Division 7.a (Irish Sea). In Report of the ICES Advisory Committee, 2019. ICES Advice 2019, cod.27.7a. Available from: http://ices.dk/sites/pub/ Publication%20Reports/Advice/2019/2019/cod.27.7a.pdf
39. Kelly CJ, Codling EA, Rogan E. 2006. The Irish Sea cod recovery plan: some lessons learned. ICES Journal of Marine Science, vol. 63, pp. 600–610, https://doi.org/10.1016/j.icesjms.2005.12.001
40. Council Regulation (EC) No 1342/2008 of 18 December 2008 establishing a long-term plan for cod stocks and the fisheries exploiting those stocks and repealing Regulation (EC) No 423/2004. Available from: https://eur-lex.europa.eu/eli/ reg/2008/1342/oj
41. Marine Management Organisation. 2019. Technical Conservation 2019 – Rules and regulations. Available from: https://www.gov.uk/government/publications/technicalconservation-2019-rules-and-regulations
42. Commission Delegated Regulation (EU) 2019/2239 of 1 October 2019 specifying details of the landing obligation for certain demersal fisheries in North Western waters for period 2020-2021. Available from: https://eur-lex.europa.eu/legalcontent/EN/TXT/PDF/?uri=CELEX:32019R2239&from=en
43. ICES. 2020. Cod (Gadus morhua) in Division 6.a (West of Scotland). In Report of the ICES Advisory Committee, 2020. ICES Advice 2019, cod.27.6a. Available from: http://ices.dk/sites/ pub/Publication%20Reports/Advice/2020/2020/cod.27.6a.pdf
44. ICES. 2020. EU standing request on catch scenarios for zero TAC stocks 2020; cod (Gadus morhua) and whiting (Merlangius merlangus) in Division 6.a (West of Scotland), and whiting in Division 7.a (Irish Sea). In Report of the ICES Advisory Committee, 2020. ICES Advice 2020, sr.2020.05d. Available from: http://ices.dk/sites/pub/Publication%20Reports/ Advice/2020/Special_Requests/eu.2020.05d.pdf
45. Open Seas. 2019. Evidence of continued illegal and unreported fish discarding in West Scotland Nephrops (Scampi) Trawl Fishery. Available from: https://www.openseas.org.uk/wp/wpcontent/uploads/2019/11/OpenSeas_Discard_Dossier_2019_ FINALweb-1.pdf
46. European Commission. 2019. Proposal for a Council Regulation fixing for 2020 the fishing opportunities for certain fish stocks and groups of fish stocks, applicable in Union waters and, for Union fishing vessels, in certain non-Union waters. Available from: http://europeanmemoranda.cabinetoffice.gov.uk/ files/2019/10/st13438.en19_.pdf
47. Client Earth. 2019. Joint NGO letter to the Commission on bycatch reduction plans. Available from: https://www.documents. clientearth.org/library/download-info/joint-ngo-letter-to-thecommission-on-bycatch-reduction-plans/
48. Batmap. 2020. A pioneering approach for reducing bycatch and discards. Available from: https://info.batmap.co.uk/
49. Gear Innovation and Technology Advisory Group. 2020. Development trial of a 300mm square mesh panel for bycatch reduction in the West of Scotland Nephrops fishery. Available from: https://www.sff.co.uk/wp-content/uploads/2020/02/ GITAG_MV-Eilidh-BRD-149.pdf
111 UK FISHERIES AUDIT 2021
50. ICES. 2020. Cod (Gadus morhua) in divisions 7.e–k (Western English Channel and southern Celtic Seas). In Report of the ICES Advisory Committee, 2020. ICES Advice 2020, cod.27.7e–k. Available from: http://ices.dk/sites/pub/Publication %20Reports/Advice/2020/2020/cod.27.7e-k.pdf
51. Marine Management Organisation. 2020. Fishing gear requirements and Landing Obligation exemptions 2020. Available from: https://assets.publishing.service.gov.uk/ government/uploads/system/uploads/attachment_data/ file/874420/07_-_2020_GN_-_Celtic_Sea_-_Demersal_Towed_ gears_v_2.pdf
52. ICES. 2007. EU request on Trevose closure. Available from: http://www.ices.dk/sites/pub/Publication%20Reports/ Advice/2007/Special%20Requests/EC%20Trevose% 20closure.pdf
53. ICES. 2020. Stock Annex: Cod in 7.e–k Celtic Sea cod. Available from: https://www.ices.dk/sites/pub/Publication%20Reports/ Stock%20Annexes/2020/cod-7e-k_SA_2020.pdf
54. ICES. 2020. Cod (Gadus morhua) in Subarea 4, Division 7.d, and Subdivision 20 (North Sea, eastern English Channel, Skagerrak). In Report of the ICES Advisory Committee, 2020. ICES Advice 2020, cod.27.47d20. Available from: http://ices.dk/sites/pub/ Publication%20Reports/Advice/2020/2020/cod.27.47d20.pdf
55. Marine Stewardship Council. 2019. North Sea cod to lose sustainability certification. Available from: https://www.msc.org/ media-centre/press-releases/north-sea-cod-to-lose-sustainabilitycertification
56. Kraak SBM, Bailey N, Cardinale M, et al. 2013. Lessons for fisheries management from the EU cod recovery plan. Marine Policy, vol. 37, pp. 200-213, https://doi.org/10.1016/j. marpol.2012.05.002
57. Froese R, Quaas M. 2012. Mismanagement of the North Sea cod by the European Council. Ocean & Coastal Management, vol. 70, pp. 54-58, https://doi.org/10.1016/j. ocecoaman.2012.04.005
58. The National Federation of Fisherman’s Organisations. 2019. Industry Initiative on North Sea cod. Available from: http://nffo. org.uk/news/industry-initiative-on-north-sea-cod.html
59. Engelhard G, Righton D, Pinnegar J. 2013. Climate change and fishing: A century of shifting distribution in North Sea cod. Global change biology. vol. 20, pp. 2473-2483, https://doi. org/10.1111/gcb.12513
60. European Commission. 2019. Climate change linked with declining North Sea cod populations. Available from: https:// climate.copernicus.eu/climate-change-linked-declining-north-seacod-populations
61. The PEW Charitable Trusts. 2020. Analysis of Fisheries Council agreement on fishing opportunities in the north-east Atlantic for 2020. Available from: https://www.pewtrusts.org/-/media/ assets/2020/05/080520_analysis_of_fisheries_council_ agreement_on_fishing_opportunities_in_the_nea_for_2020.pdf
62. Nimmo F, Cappell R. 2017. Taking Stock – Progress towards ending overfishing in the EU. Report produced by Poseidon Aquatic Resource Management Ltd for The Pew Charitable Trusts. Available from: https://consult-poseidon.com/fisheryreports/Poseidon_Taking_Stock_2017.pdf
63. New Economics Foundation. 2020. Landing the Blame: Overfishing in the Northeast Atlantic 2020. Available from: https://neweconomics.org/2020/03/landing-the-blameoverfishing-in-the-northeast-atlantic-2020
64. Marine Conservation Society. 2020. Sustainability and science stripped from the Fisheries Bill by the House of Commons. Available from: https://www.mcsuk.org/news/fisheries_bill_ committee
65. UK Parliament. 2020. Fisheries Act 2020. Available from: https://services.parliament.uk/Bills/2019-21/fisheries.html
66. Department for Environment, Food and Rural Affairs (DEFRA). 2018. Government publishes plan for an independent fisheries policy. Available from: https://www.gov.uk/government/news/ government-to-publish-plan-for-an-independent-fisheries-policy
67. Cosgrove R, Browne D, Minto C, et al. 2019. A game of two halves: Bycatch reduction in Nephrops mixed fisheries. Fisheries Research, vol. 210, pp. 31-40, https://doi.org/10.1016/j. fishres.2018.09.019
68. Crowder LB, Murawski SA. 1998. Fisheries Bycatch: Implications for Management. Fisheries, vol. 23, pp. 8-17
69. Diamond B, Beukers-Stewart BD. 2011. Fisheries discards in the North Sea: waste of resources or a necessary evil? Reviews in Fisheries Science, vol. 19, pp. 231-245
70. Hall MA, Alverson DL, Metuzals KI. 2000. By-catch: problems and solutions. Marine Pollution Bulletin, vol. 41, pp. 204-219
71. UK Parliament. 2020. EU Committee Reports: EU Fisheries Landing Obligation. Available from: https://lordslibrary. parliament.uk/research-briefings/lln-2020-0014/
72. European Parliament. 2018. Research for PECH Committee – Landing Obligation and Choke Species in Multispecies and Mixed Fisheries – The North Western Waters. Available from: https://www.europarl.europa.eu/RegData/etudes/ STUD/2018/617472/IPOL_STU(2018)617472_EN.pdf
73. ICES. 2020. Fisheries Overviews. Available from: http://ices.dk/ advice/Fisheries-overviews/Pages/fisheries-overviews.aspx
74. ICES. 2019. EU request to provide likely catches in 2020 of specific bycatch / non-targeted stocks that have zero catch advice (cod in divisions 7.e–k and 6.a and in Subdivision 21, whiting in divisions 6.a and 7.a, and plaice in divisions 7.h and 7.j–k). In Report of the ICES Advisory Committee, 2019. ICES Advice 2019, sr.2019.23. Available from: http://ices.dk/sites/ pub/Publication%20Reports/Advice/2019/Special_Requests/ eu.2019.23.pdf
75. Joint NGO response to the Commission consultation on the setting of fishing opportunities for 2020. Available from: https:// europe.oceana.org/sites/default/files/20190819_joint_ngo_ response_to_commission_consultation_on_the_setting_of_fishing_ opportunities_for_2020.pdf
76. Catchpole TL, Revill AS. 2008. Gear technology in Nephrops trawl fisheries. Reviews in Fish Biology and Fisheries, vol. 18, pp. 17–31, https://doi.org/10.1007/s11160-007-9061-y
77. CEFAS. 2015. Developing the selective Net Grid trawl in the NE Nephrops trawl fishery 2015/16 – Fisheries Science Partnership. Available from: http://data.cefas.co.uk/#/ View/18684
112 UK FISHERIES AUDIT 2021
78. BIM. 2018. Assessment of a SELTRA sorting box with 90mm codend mesh size in the Irish Sea Nephrops fishery. Available from: http://www.bim.ie/media/bim/content/publications/ fisheries/BIM-Assessment-of-a-SELTRA-Sorting-Box-Report.pdf
79. Agri-Food and Biosciences Institute. 2018. Patterns of whiting discards by Northern Irish otter trawlers targeting Nephrops. Available from: http://www.nwwac.org/_fileupload/ Discards/2018/Annex%20XIb%20-%20DM%20request%20 Irish%20Sea%20whiting%20Annex%20II%20Selectivity%20 review%20for%20Irish%20Sea%20w___.pdf
80. Alverson DL , Freeberg MH, Murawski SK, Pope JG. 1994. A global assessment of fisheries by-catch and discards. FAO, Rome.
81. Bergmann M, Wieczorek SK, Moore PG, Atkinson RJA. 2002. Discard composition in the Clyde Sea Nephrops fishery. Fisheries Research, vol. 57. pp. 169-183, https://doi. org/10.1016/S0165-7836(01)00345-9
82. Catchpole TL, Frid CLJ, Gray TS. 2005. Discarding in the English north-east coast Nephrops norvegicus fishery: the role of social and environmental factors. Fisheries Research, vol. 72, pp. 4554, https://doi.org/10.1016/j.fishres.2004.10.012
83. Southworth LK, Ratcliffe FC, Bloor ISM, et al. 2020. Artificial light improves escapement of fish from a trawl net. Journal of the Marine Biological Association of the United Kingdom, vol. 100, pp. 267-275, https://doi.org/10.1017/ S0025315420000028
84. Catchpole TL, Tidd AN, Kell LT, et al. 2007. The potential for new Nephrops trawl designs to positively effect North Sea stocks of cod, haddock and whiting. Fisheries Research, vol. 86, pp. 262-267, https://doi.org/10.1016/j.fishres.2007.06.023
85. Agri-Food and Biosciences Institute. 2016. Sustainability of the Northern Ireland Nephrops Fishing Fleet – an analysis of the balance between fishing capacity and fishing opportunities. Available from: https://www.afbini.gov.uk/sites/afbini.gov.uk/files/ publications/Aurelia%20Briefing%20paper.pdf
86. Commission Delegated Regulation (EU) 2018/2034 of 18 October 2018 establishing a discard plan for certain demersal fisheries in North-Western waters for the period 2019-2021. Available from: https://eur-lex.europa.eu/legal-content/EN/ TXT/?uri=uriserv:OJ.L_.2018.327.01.0008.01.ENG
87. ICES. 2019. Whiting (Merlangius merlangus) in Division 7.a (Irish Sea). In Report of the ICES Advisory Committee, 2019. ICES Advice 2019, whg.27.7a. Available from: http://www. ices.dk/sites/pub/Publication%20Reports/Advice/2019/2019/ whg.27.7a.pdf
88. Fauchald P, Skov H, Skern-Mauritzen M, et al. 2011. Wasp-Waist interactions in the North Sea ecosystem. PLoS One, https://doi. org/10.1371/journal.pone.0022729
89. MacDonald A, Speirs DC, Greenstreet S, et al. 2019. Trends in sandeel growth and abundance off the east coast of Scotland. Frontiers in Marine Science, vol. 6, https://doi.org/10.3389/ fmars.2019.00201
90. ICES. 2020. Stock Annex: Sandeel (Ammodytes marinus) in the North Sea area 2 (SA2). Available from: http://ices.dk/sites/ pub/Publication%20Reports/Stock%20Annexes/2020/san.sa.2r_ SA.pdf
91. Engelhard GH, Peck MA, Rindorf A, et al. 2014. Forage fish, their fisheries, and their predators: who drives whom?. ICES Journal of Marine Science, vol. 71, pp. 90–104, https://doi.org/10.1093/icesjms/ fst087
92. ICES. 2020. Report of the Benchmark Workshop on Sandeel (WKSand 2016). Available from: http://www.ices.dk/sites/pub/ Publication%20Reports/Expert%20Group%20Report/acom/2016/ WKSAND/WKSAND_2016.pdf
93. Daunt F, Wanless S, Greenstreet SPR, et al. 2008. The impact of the sandeel fishery closure on seabird food consumption, distribution, and productivity in the northwestern North Sea. Canadian Journal of Fisheries and Aquatic Sciences, vol. 65, pp. 362–381, https:// doi.org/10.1139/F07-164
94. Greenstreet S, Fraser H, Armstrong E, Gibb I. 2010. Monitoring the Consequences of the Northwestern North Sea Sandeel Fishery Closure. Marine Scotland – Science, April 2010. Available from: https://www.webarchive.org.uk/wayback/archive/3000/https:// www.gov.scot/Resource/Doc/295194/0099668.pdf
95. Dourmad JY, Ryschawy J, Trousson T, Bonneau M, et al. 2014. Evaluating environmental impacts of contrasting pig farming systems with life cycle assessment. Animal, 8:12, pp. 2027–2037
96. CE Delft. 2011. The environmental impact of mink fur production. Available from: https://www.cedelft.eu/publicatie/the_environmental_ impact_of_mink_fur_production/1131
97. Changing Markets Foundation. 2019. Until the Seas Run Dry – How industrial Aquaculture is plundering the Oceans. Available from: https://www.ciwf.org.uk/media/7436097/until-the-seas-dry.pdf
98. ICES. 2020. Herring Assessment Working Group for the Area South of 62° N (HAWG). ICES Scientific Reports. 2:60. 1151 pp. Available from: http://www.ices.dk/sites/pub/Publication%20Reports/Expert% 20Group%20Report/Fisheries%20Resources%20Steering%20 Group/2020/HAWG/01%20HAWG%20Report%202020.pdf
99. ICES. 2020. Sandeel (Ammodytes spp.) in divisions 4.a–b, Sandeel Area 4 (northern and central North Sea). In Report of the ICES Advisory Committee, 2020. ICES Advice 2020, san.sa.4. Available from: http://ices.dk/sites/pub/Publication%20Reports/ Advice/2020/2020/san.sa.4.pdf
100. Carroll MJ, Bolton M, Owen E, et al. 2017. Kittiwake breeding success in the southern North Sea correlates with prior sandeel fishing mortality. Aquatic Conservation: Marine and Freshwater Ecosystems, vol. 27, pp. 1164-1175.
101. Dolman S, Baulch S, Evans PGH, et al. 2016. Towards an EU Action Plan on Cetacean Bycatch. Marine Policy, vol. 72, pp. 67-75, https:// doi.org/10.1016/j.marpol.2016.06.020
102. Wildlife and Countryside Link. 2020. Gearing up to eliminating crosstaxa bycatch in UK fisheries. A wildlife and Countryside Link (WCL) technical briefing. Available from: https://www.wcl.org. uk/docs/Gearing%20up%20to%20eliminating%20cross-taxa%20 bycatch%20in%20UK%20fisheries%20FINAL.pdf
103. Northridge S, Kingston A, Thomas L, 2017. Annual report on the implementation of Council Regulation (EC) No 812/2004 during 2016. Available from: http://randd.defra.gov.uk/Document. aspx? Document=14086_UK812Reportfor2016.pdf
104. UK Marine Online Assessment Tool 2019. Available from: https:// moat.cefas.co.uk/
113 UK FISHERIES AUDIT 2021
105. ICES. 2020. Working Group on Bycatch of Protected Species (WGBYC). ICES Scientific Reports. 2:81. 209 pp. Available from: http://www.ices.dk/sites/pub/Publication%20Reports/ Expert%20Group%20Report/HAPISG/2020/WGBYC_2020.pdf
106. UK Cetacean Strandings Investigation Programme. Available from: http://ukstrandings.org/
107. ICES. 2018. Report from the Working Group on Bycatch of Protected Species (WGBYC), 1-4 May 2018, Reykjavik, Iceland. ICES CM 2018/ACOM:25. 128 pp. Available from: http://www.ices.dk/sites/pub/Publication%20Reports/ Expert%20Group%20Report/acom/2018/WGBYC/wgbyc_2018. pdf
108. ICES. 2020. Bycatch of protected and potentially vulnerable marine vertebrates – review of national reports under Council Regulation (EC) No. 812/2004 and other information. In Report of the ICES Advisory Committee, 2020. ICES Advice 2020, byc.eu. Available from: http://www.ices.dk/sites/pub/ Publication%20Reports/Advice/2020/2020/byc.eu.pdf
109. European Commission. 2020. The Habitats directive. Available from: https://ec.europa.eu/environment/nature/legislation/ habitatsdirective/index_en.htm
110. European Commission. 2020. The Marine Strategy Framework Directive. Available from: https://ec.europa.eu/environment/ marine/eu-coast-and-marine-policy/marine-strategy-frameworkdirective/index_en.htm
111. Luck C, Jessopp M, Tully O, et al. 2020. Estimating protected species bycatch from limited observer coverage: A case study of seal bycatch in static net fisheries. Global Ecology and Conservation, vol. 24, https://doi.org/10.1016/j.gecco.2020. e01213
112. Department for Environment, Food and Rural Affairs (DEFRA). 2004. Explanatory Memorandum to The South-West territorial Waters (Prohibition of Pair Trawling) Order 2004. Available from: https://www.legislation.gov.uk/uksi/2004/3397/ pdfs/uksiem_20043397_en.pdf; https://www.legislation.gov.uk/ uksi/2004/3397/contents
113. Omeyer LCM, Doherty PD, Dolman S, et al. 2020. Assessing the Effects of Banana Pingers as a Bycatch Mitigation Device for Harbour Porpoises (Phocoena phocoena). Frontiers in Marine Science, https://www.frontiersin.org/article/10.3389/ fmars.2020.00285
114. Scientific, Technical and Economic Committee for Fisheries (STECF). 2019. Review of the implementation of the EU regulation on the incidental catches of cetaceans (STECF-19-07). Publications Office of the European Union, Luxembourg, 2019. Available from: https://stecf.jrc. ec.europa.eu/documents/43805/2489016/STECF+19-07++Incid+catches+cetaceans.pdf/3485bafd-4350-40af-8d720226a68cb86e
115. Tindall C, Hetherington S, Bell C, et al. (Eds). 2019. Hauling Up Solutions: Reducing Cetacean Bycatch in UK Fisheries. Final Workshop Report. 31 pp. https://www.cefas.co.uk/cetaceanbycatch-workshop/.
116. UK Parliament. 2017. Cetaceans: Conservation. Available from: https://questions-statements.parliament.uk/writtenquestions/detail/2017-11-23/115502
117. Politics Home. 2018. Michael Gove to unveil plan to ‘take back control’ of fisheries after Brexit. Available from: https://www. politicshome.com/news/article/michael-gove-to-unveil-plan-totake-back-control-of-fisheries-after-brexit
118. Wildlife and Countryside Link. 2019. We need to get tough on tacking bycatch. Available from: https://www.wcl.org.uk/weneed-to-get-tough-on-tackling-bycatch.asp
119. Marine Management Organisation. 2020. Manage your fishing effort: Western Waters crabs and scallops. Available from: https://www.gov.uk/guidance/manage-your-fishing-effortwestern-waters-crabs
120. Stewart B, Howarth L. 2016. Quantifying and Managing the Ecosystem Effects of Scallop Dredge Fisheries. Developments in Aquaculture and Fisheries Science, vol. 40, pp. 585-609, https://doi.org/10.1016/B978-0-444-62710-0.00018-3
121. Hall-Spencer JM, Moore PG 2000. Scallop dredging has profound, long-term impacts on maerl habitats. ICES Journal of Marine Science, vol. 57, pp. 1407–1415, https://doi. org/10.1006/jmsc.2000.0918
122. JNCC. 2020. MPA network assessments. Available from: https://jncc.gov.uk/our-work/mpa-network-assessments/
123. The Ferret. 2020.Government leak reveals destruction of marine wildlife. Available from: https://theferret.scot/marinewildlife-destruction-government-leak/
124. Langton R, Stirling DA, Boulcott P, Wright PJ. 2020. Are MPAs effective in removing fishing pressure from benthic species and habitats?. Biological Conservation, Volume 247, https://doi. org/10.1016/j.biocon.2020.108511
125. Greenpeace. 2020. Bright Blue Seas: The need to properly protect our offshore marine protected areas. Available from: https://www.greenpeace.org.uk/wp-content/uploads/2020/09/ Bright-Blue-Seas-Greenpeace-report.pdf
126. Sea Watch Foundation. 2015. Scallop Dredging in Cardigan Bay. Available from: https://www.seawatchfoundation.org.uk/ scallop-dredging-in-cardigan-bay/
127. Client Earth. 2016. What happens when countries break EU environmental law? Available from: https://www.clientearth.org/ what-happens-to-eu-nature-laws-after-brexit/
128. Cappell R, Huntington T, Nimmo F, MacNab S. 2018. UK scallop fishery: current trends, future management options and recommendations. Report produced by Poseidon Aquatic Resource Management Ltd
129. Sheehan E, Stevens T, Gall S, et al. 2013. Recovery of a Temperate Reef Assemblage in a Marine Protected Area following the Exclusion of Towed Demersal Fishing. PloS one, https://doi.org/10.1371/journal.pone.0083883
130. Sheehan EV, Cousens SL, Nancollas SJ, et al. 2013. Drawing lines at the sand: Evidence for functional vs. visual reef boundaries in temperate Marine Protected Areas. Marine Pollution Bulletin, vol. 76, pp.194-202, https://doi. org/10.1016/j.marpolbul.2013.09.004
114 UK FISHERIES AUDIT 2021
131. Rees SE. Ashley M, Evans L, et al. 2016. An evaluation framework to determine the impact of the Lyme Bay Fisheries and Conservation Reserve and the activities of the Lyme Bay Consultative Committee on ecosystem services and human wellbeing. A report to the Blue Marine Foundation by research staff the Marine Institute at Plymouth University, Exeter University and Cefas. Available from: https://www. bluemarinefoundation.com/wp-content/uploads/2018/05/ Evaluation-framework-to-determine-the-impact-of-the-LymeBay-Fisheries-and-Conservation-Reserve-on-ecosystem-servicesand-human-wellbeing_Final-1.pdf
132. IPCC. 2019. IPCC’s Special Report on the Ocean and Cryosphere 2019. Available from: https://www.ipcc.ch/srocc/
133. IPBES. 2019. UN IPBES Global Assessment Report on Biodiversity and Ecosystem Service, 2019. Available from: https://ipbes.net/global-assessment
134. United Nations. What is the Paris Agreement? Available from: https://unfccc.int/process-and-meetings/the-paris-agreement/ what-is-the-paris-agreement
135. Convention on Biological Diversity. 2020. Available from: https://www.cbd.int/
136. United Nations. 2020. Available from: https://www.un.org/ sustainabledevelopment/sustainable-development-goals/
137. United Nations. 1982. United Nations Convention on the Law of the Sea of 10 December 1982. Available from: https://www. un.org/Depts/los/convention_agreements/convention_overview_ convention.htm
138. The North East Atlantic Fisheries Commission. 2020. The United Kingdom becomes the 6th Contracting Party to NEAFC. Available from: https://www.neafc.org/system/files/ UK%20accession%20from%20Jacques%20Verborgh.pdf
139. UK Government. 2020. Framework Agreement on Fisheries between the Government of the United Kingdom of Great Britain and Northern Ireland and the Government of the Faroes. Available from: https://assets.publishing.service.gov. uk/government/uploads/system/uploads/attachment_data/ file/933792/CS_Faroe_Islands_1.2020_UK_Faroes_Framework_ Agreement_on_Fisheries.pdf
140. UK Government. 2020. Memorandum of Understanding between the Government of the United Kingdom of Great Britain and Northern Ireland and the Government of Greenland on enhancing cooperation on fisheries and related issues. Available from: https://assets.publishing.service.gov. uk/government/uploads/system/uploads/attachment_data/ file/934649/fisheries-mou-uk-greenland-201103.pdf
141. UK Government. 2020. Memorandum of Understanding between the Government of the United Kingdom of Great Britain and Northern Ireland and the Government of Iceland on enhancing cooperation on fisheries and related issues. Available from: https://assets.publishing.service.gov. uk/government/uploads/system/uploads/attachment_data/ file/934643/fisheries-mou-uk-iceland-201111.pdf
142. ICES. 2020. Member countries. Available from: https://www.ices.dk/ about-ICES/who-we-are/Pages/Member-Countries.aspx
143. UNECE, Convention on Access to Information, Public Participation in Decision‐Making and Access to Justice in Environmental Matters, Aarhus Convention, 1998. Available from: https://www. unece.org/env/pp/treatytext.html
144. Cefas. 2017. Lobster (Homarus gammarus). Cefas Stock Status Report 2017. Available from: https://assets.publishing.service. gov.uk/government/uploads/system/uploads/attachment_data/ file/722748/2017_Lobster_assessments.pdf
145. Cefas. 2017. Edible crab (Cancer pagurus). Cefas Stock Status Report 2017. Available from: https://assets.publishing.service.gov.uk/ government/uploads/system/uploads/attachment_data/file/722904/ Cefas_Crab_Stock_Assessment_2017.pdf
146. Marine Management Organisation. 2020. Fishing quota allocations for 2020 for England and the UK. Available from: https://www.gov. uk/government/publications/these-are-the-fishing-quota-allocationsfor-2020-for-england-and-the-uk
115 UK FISHERIES AUDIT 2021
www.macalister-elliott.com
europe.oceana.org