


APRIL 2024, OECD-ECB WORKSHOP
Maximilian Konradt (Geneva Graduate Institute), Thomas McGregor (ECB), Frederik Toscani (IMF)
The views expressed here are those of the authors and do not necessarily represent the views of any of the authors’ institutions, including the IMF, its Executive Board, or IMF management.
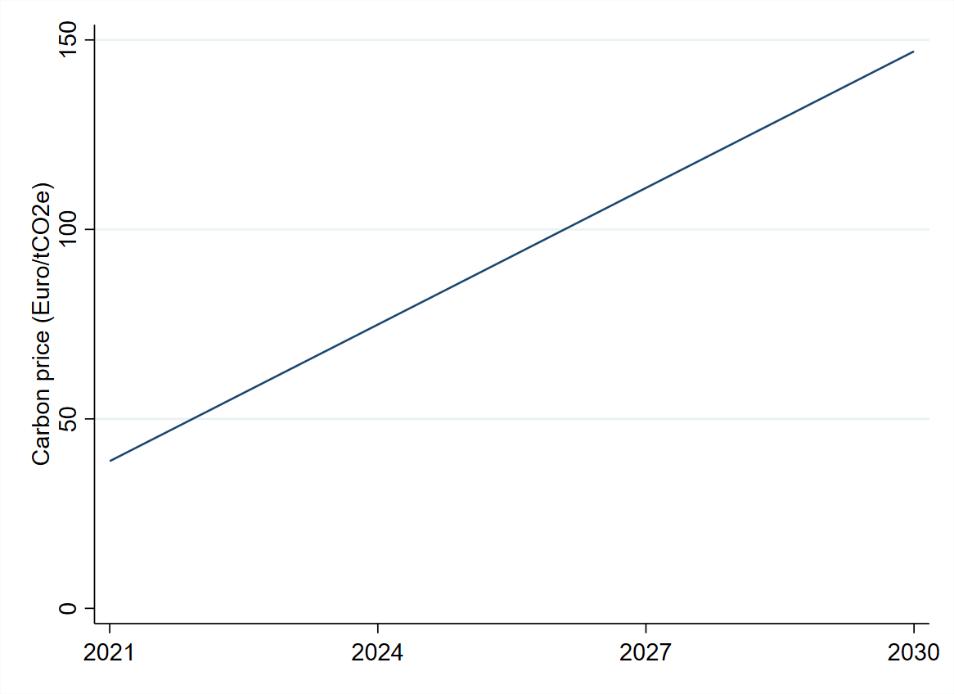
• Effective carbon price of ca. 40 Eur/tCO2e at end-2021 in the euro area (own calculations, data on price and coverage from the World Bank and European Commission)
• De-carbonization commitments (e.g., EU’s Fit-for-55) will require substantial further increases (150 Eur/tCO2e?)
• Inflation related to climate policy could force a policy reaction by the ECB (Schnabel 2022).
• Large literature studying macro impact through rich models (including OECD, ECB, IMF),also some prior empirical assessments of past developments
• This paper: Has carbon pricing lead to inflation? And what can we say about the outlook?
1. Cross-country panel local projections, based on carbon taxes and ETS 2000-2020.
Minimal effect on headline inflation but increase in the relative price of energy
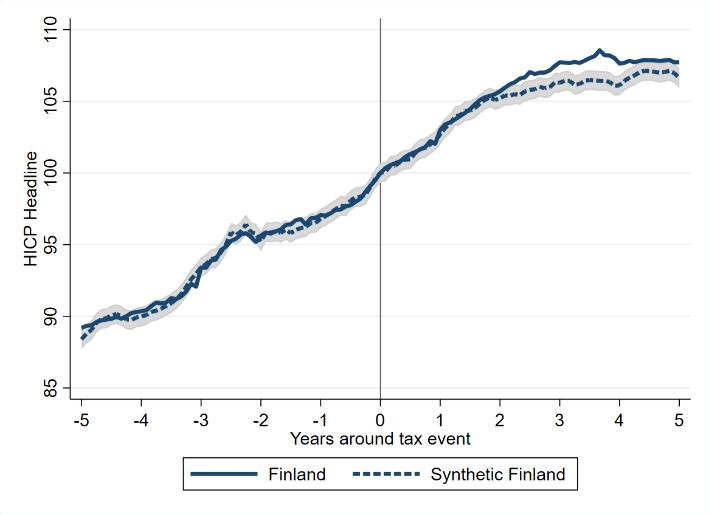
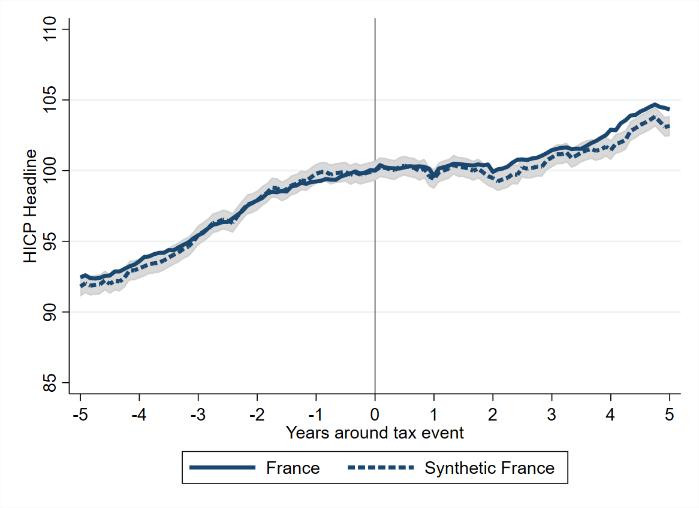
2. Event studies of large carbon tax changes in France and Finland, based on synthetic controls methods.
Limited effects of carbon tax changes on inflation in both countries.
3. Forward-looking simulations based on input-output tables, covering 65 sectors with 5 energy inputs.
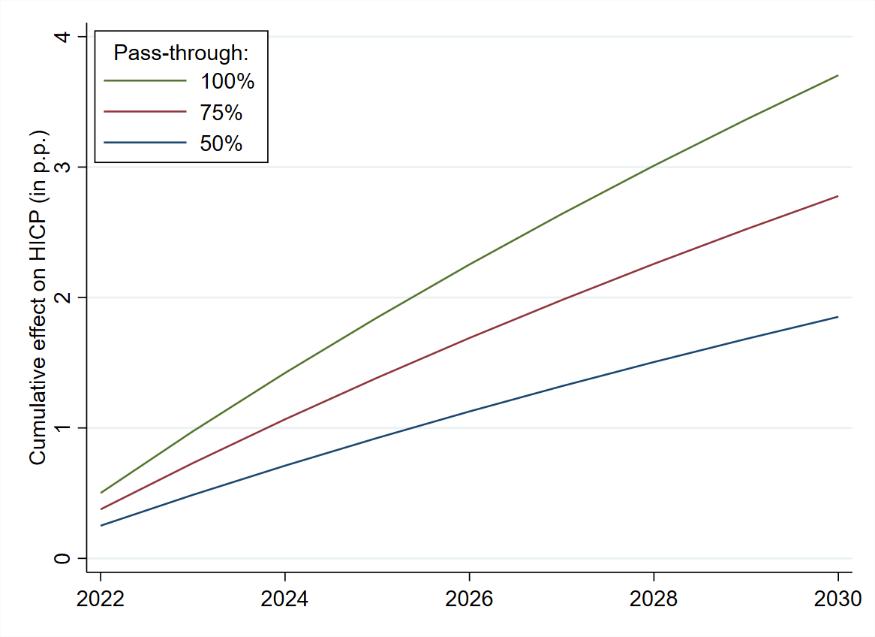
Carbon tax consistent with Fit-for-55 leads to increase in annual inflation of 0.2 to 0.4 pp until 2030, depending on pass-through, with heterogeneous effects by country.
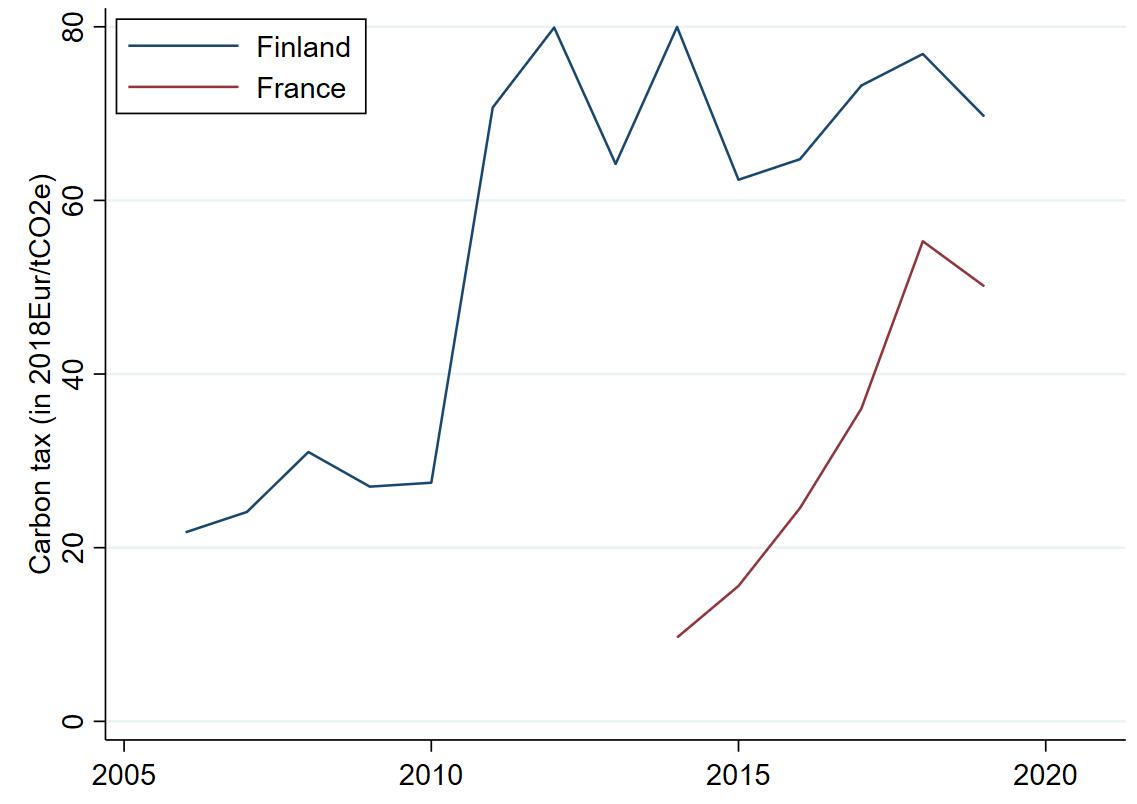
National carbon taxes – substantial variation in prices and coverage

Notes: National carbon taxes, in 2018 euro per ton of CO2e emissions. These are not effective tax rates. Source: World Bank Carbon Pricing Dashboard.
Variation in EU ETS (prices and coverage)
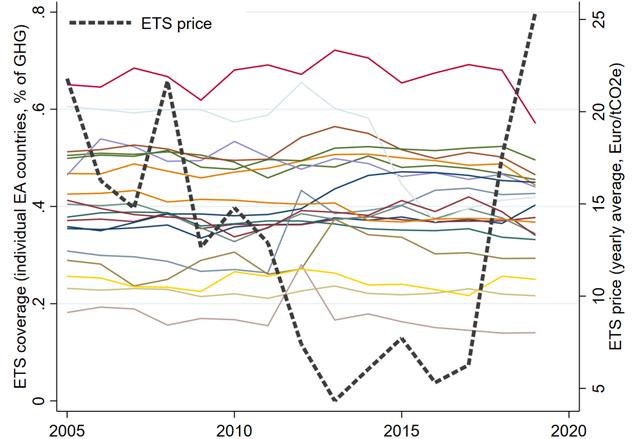
Notes: Colored lines (LHS) show the coverage of the EU ETS in each euro area country. The dashed black line (RHS) shows the average annual emission certificate price, expressed in 2018 Euro per ton of CO2e emissions. Source: European Commission.
Δ����ICP���� ,���� +ℎ = α���� + Θℎ τ���� ,���� + β ���� τ���� ,���� −1 + δ ���� Δ������������ �������� ,���� −1 + μ ���� �������� ,���� −1 + π ���� �������� −1 + ϵ���� ,����
• Δ������������ �������� ,���� +h is the (log) change in country i’s HICP h years ahead.
• τ���� ,���� = �������� �������� × ������������ ���������������������������� �������� ,���� + ���� �������� ,���� × �������� ���������������������������� �������� ,���� real (effective) carbon tax rate.
• �������� ,���� , is a vector of country controls, including GDP growth and energy price changes.
• �������� −1 is a vector of EU/euro area level controls
• α���� are country fixed effects.
• Θℎ is the h-year ahead cumulative impulse response function.
• Exogeneity condition: E ϵ����
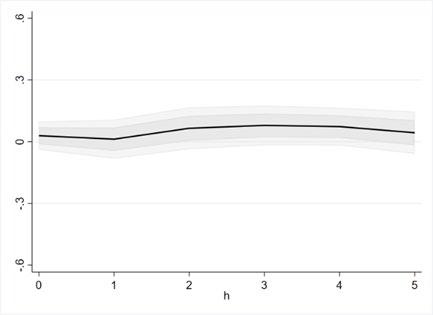
Dynamic Impulse Responses of Inflation (in p.p.) to National Carbon Taxes and ETS
Headline inflation
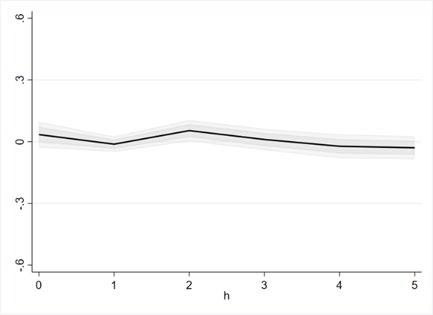
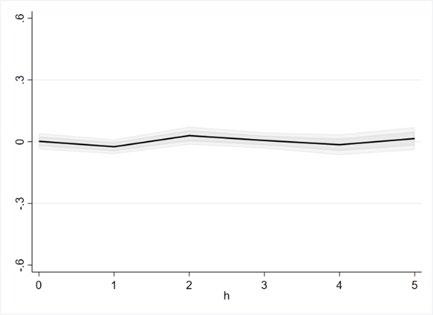
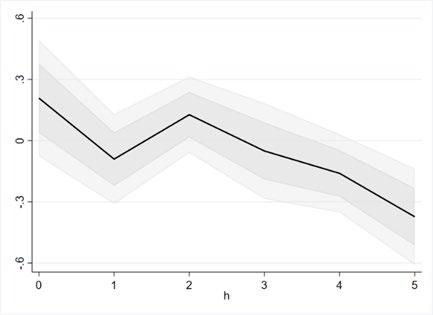
Notes: All dynamic responses are expressed in percentage points, shaded gray bounds denote 68 and 90 percent confidence bands. Standard errors are clustered by country. Sample EA19, 2000-2019, based on an effective tax rate including national carbon taxes only. Horizontal axis shows years while vertical axis shows change in inflation or price level relative to t = 0.
Dynamic Impulse Responses of Price Level (in p.p.) to National Carbon Taxes and ETS
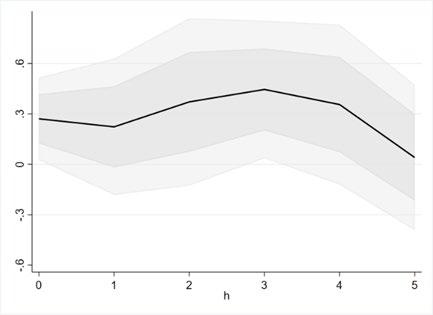
Notes: All dynamic responses are expressed in percentage points, shaded gray bounds denote 68 and 90 percent confidence bands. Standard errors are clustered by country. Sample EA19, 2000-2019, based on an effective tax rate including national carbon taxes only. Horizontal axis shows years while vertical axis shows change in inflation or price level relative to t = 0.
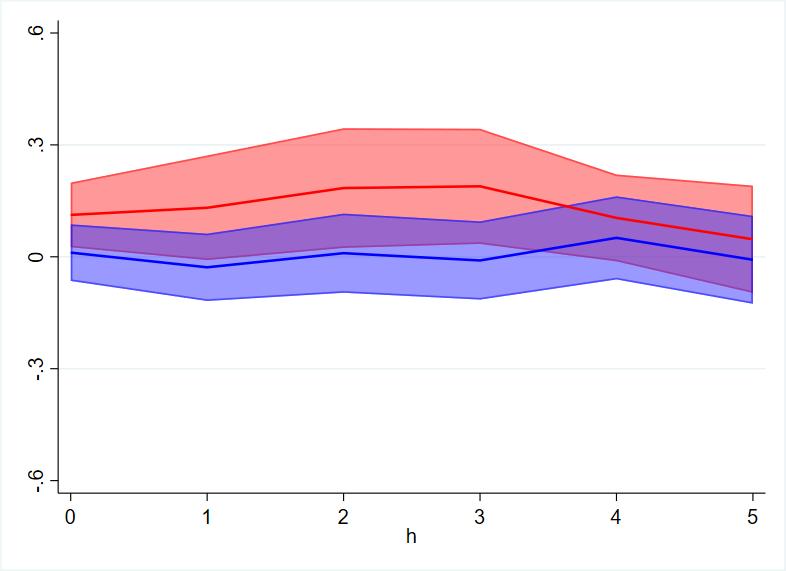
Positive output gap
Negative output gap
Notes: Red (blue) lines represent the IRFs when the output gap is positive (negative). All dynamic responses are expressed in percentage points, shaded bounds denote 90 percent confidence bands. Standard errors are clustered by country. Sample EA19, 2000-2019, based on an effective tax rate including national carbon taxes only. Horizontal axis shows years while vertical axis shows change in inflation or price level relative to t = 0.
• Limited effects of carbon pricing on inflation in the data.
Close to zero aggregate effect, relative price changes from higher energy prices
• Consistent with results in Konradt and Weder di Mauro (2023), Metcalf and Stock (2020): carbon prices change relative prices, lead to reallocation of capital, labor, reduce emissions but do not have aggregate economic effects.
• Robust to other specifications:
Additional controls (fiscal stance, environmental regulation, 10-year bond yields), different sub-samples.
Tax rates in differences.
Non-linear effects (in the tax rate, carbon intensity of the economy)
• Events:
French tax enactment (0 to 45 Eur/t in 5 yrs).
Finnish tax revision (27 to 67 Eur/t in 1 yr).
• Synthetic control method (Abadie et al. 2010):
• Construct counterfactuals from donor pool of other euro area economies without a carbon tax.
• Minimize pre-tax differences, based on 60 monthly (seasonally-adjusted) HICP observations.
• Compare actual with counterfactual economy HICP to assess the response of consumer prices to carbon tax changes.
• Synthetic counterfactuals provide an accurate fit pre-tax (small error bands).
• Finland: Slight increase in HICP 3-4 years post-tax, difference of about 1 pp after 5 years.
• France: No effect initially, difference of about 1 pp after 5 years.
Finland (2011)
France (2014)
• Broad agreement that carbon prices will have to increase substantially further to meet climate targets
• Scenario: 150 Eur/t tax by 2030 from 40 Eur/t in 2021. We take this as given -> clearly a much-debated research area in its own right
• Simulate the effects of carbon pricing on EA consumer prices based on input-output tables.
GTAP data:
• 65 sectors, 5 energy inputs (year = 2014).
• Merge energy input carbon intensities and prices.
• Compute the implied (mechanical) change in consumer prices from carbon tax changes.
• Aggregate at the euro area level based on consumption expenditure weights.
• Between 0.2 to 0.4 pp increase in inflation annually, 0.3 pp in baseline scenario.
• Similar magnitude as in comparable studies, as well as WEO.
• By 2030: Cumulative increase of consumer prices between 1.8 to 3.7 pp, depending on pass -through.
Carbon price path
Euro area effects
Substantial variation across euro area countries
1. Energy intensity of production
2. Energy mix of production
3. Initial level of carbon pricing
4. Carbon intensity of electricity
5. Differences in HICP basket weights
Tentative estimates suggest price level effect for Estonia, Greece and Lithuania over 5 percentage points by 2030 relative to less than 1 percentage point in Luxembourg
-> Possible higher dispersion of inflation across the euro area
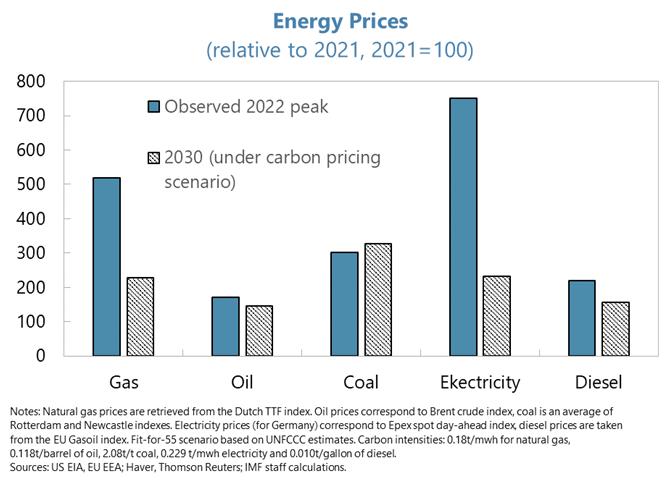
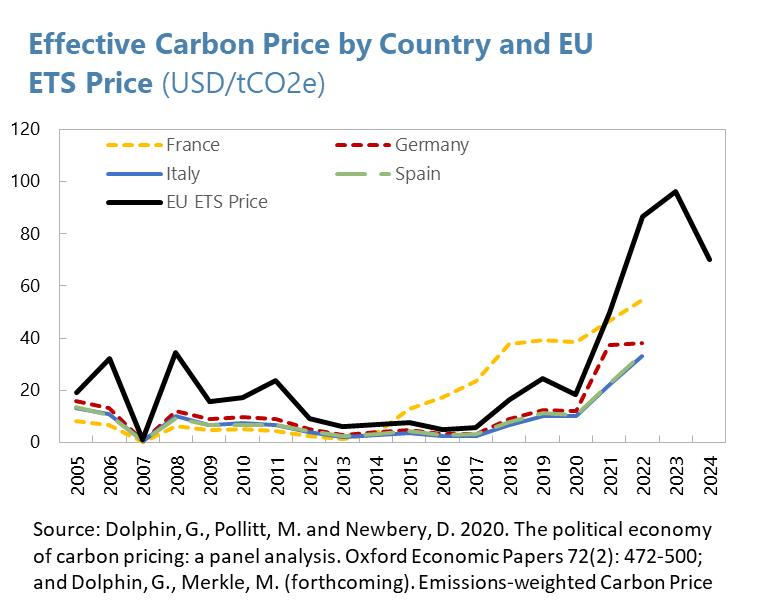
• Additional national taxes/ETS introduced since 2021 (eg Austria, Germany)
• ETS prices reached a high of over 100 Euro in early 2023
• Estimate that in both 2022 and 2023 prices were roughly on the path assumed in the prior simulations
• But ETS prices have fallen significantly from their peak over the past year
• Developments could provide a case for introducing an (escalating) carbon price floor in the EU ETS.
• Climate change and technological change: We capture the inflationary effect of carbon pricing here, but If there are economies of scale in the transition, then over a longer horizon might expect some deflationary pressures too
• Political economy pressures: At face value small inflationary effect points to less danger of political backlash, energy price effects much lower than 2022 shock.
But there is cross-country heterogeneity and heterogeneity across households
We didn’t comment on possible adverse GDP/employment effects at all here
Makes sense to build income distribution concerns into the design of climate policies from the start
Clear from economic analysis that cost of delaying action just increases
• Permanent vs temporary
• Lower (rather than higher) net prices for fossil fuel producers
• Relative price changes based on carbon content (note role of coal)
• Generate fiscal revenues which can be re-used
Elasticity of substitution of fossil fuels for renewables in electricity generation plays an important role
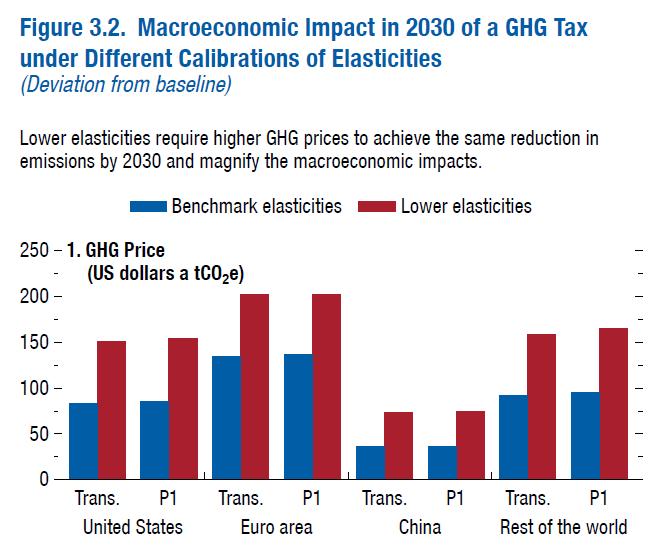
Negative real GDP impact manageable, depends on policy package
Inflation effects same order of magnitude we calculate in the paper
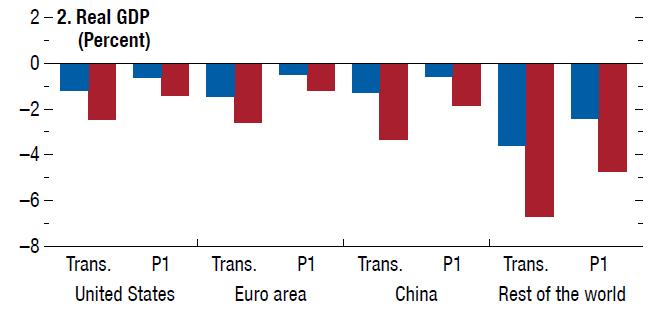
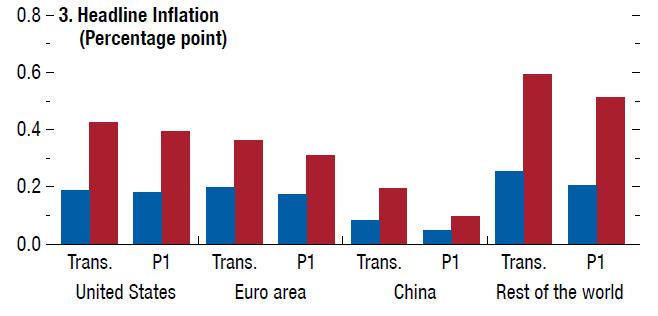
Sources: Global Macroeconomic Model for the Energy Transition; and IMF staff estimates. Note: P1 = Policy Package 1: two-thirds labor tax cuts and one-third transfers to households; GHG = greenhouse gas; tCO2e = metric ton of carbon dioxide equivalent; Trans. = recycling GHG tax revenue as transfers to households.
Notes: National carbon taxes, in 2018 euro per ton of CO2e emissions. Tax coverage is expressed as a percent of total greenhouse gas emissions, in 2018. Source: World Bank Carbon Pricing Dashboard.
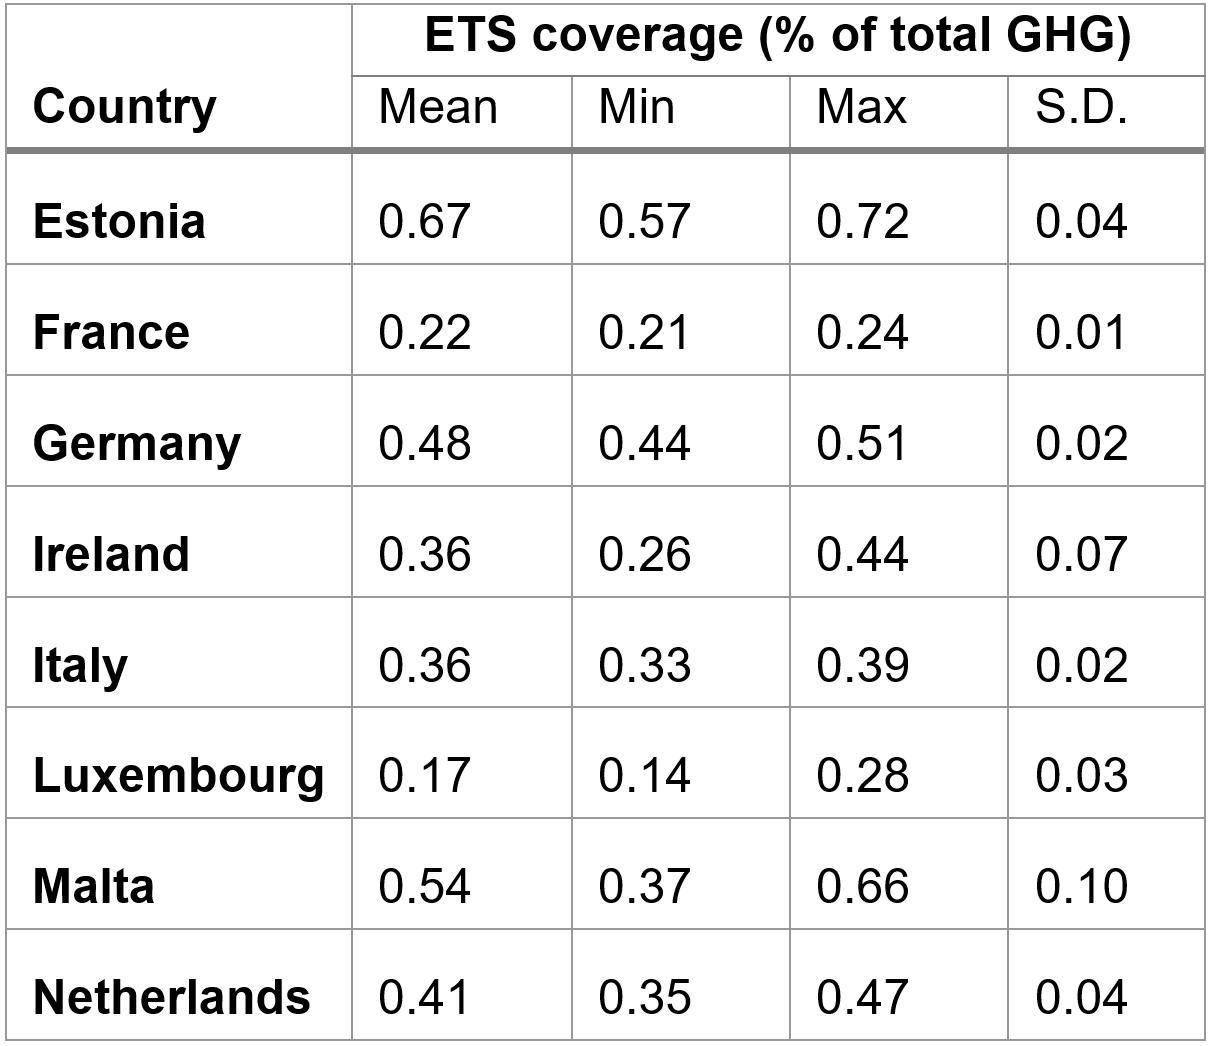
Source: World Bank
Source: European Environment Agency
• Two main determinants in our simulations: pass-through and demand side adjustments.
• Empirical literature on pass-through:
100% in (Spanish) power sector (Fabra and Reguant 2014).
60% in manufacturing (Ganapati et al. 2020).
We use 75% in our baseline scenario.
• Demand elasticity of carbon pricing for producers:
Estimated from the data based on local projections approach, with data from Eurostat.
Coal (-0.25 pp), electricity (-0.17 pp), natural gas (-0.27 pp), oil/petroleum (0.001 pp).
(No adjustments by households)