2022 OECD ECONOMIC SURVEY OF IRELAND

Dublin, 14 December 2022


@OECD @OECDeconomy https://www.oecd.org/economy/ireland-economic-snapshot/
reforms
Prosperity for all through effective
Robust export growth continues to support the economy
A. Real GDP
B. Exports of goods and services
Index 2019Q4 = 100
140
130
120
110
100
Ireland OECD Modified domestic demand¹
90
150 Dec-19 Jun-20 Dec-20 Jun-21 Dec-21 Jun-22
80
140
130
120
Ireland OECD
110
100
90
Index 2019Q4 = 100 70

Source: OECD National Accounts database and Central Statistical Office.
80
70
150 Dec-19 Jun-20 Dec-20 Jun-21 Dec-21 Jun-22
1. Excludes those large transactions of foreign companies that do not have a sizeable impact on the domestic economy.
2
The labour market remains resilient
3
Number of occupied posts plus number of job vacancies.
0 2 4 6 8 10 12 14 CZE POL DEU NOR HUN NLD SVN IRL DNK AUT LTU EST BEL SVK PRT LVA EA SWE FRA FIN ITA GRC ESP
Unemployment rate 2022Q3 % of labour force, s.a. 0 1 2 3 4 5 6 7 ESP SVK GRC POL PRT IRL LTU ITA EST CHE FRA LVA HUN SVN EA SWE FIN NOR DNK DEU AUT CZE NLD BEL
2019
posts¹
1.
Source: Eurostat.
A.
B. Job vacancy rate 2022Q3
% of all
Growing uncertainties will dent the pace of the recovery
40
30
20
10
0
-10
-20
-30
Consumer and business confidence Balance of answers¹ -40
Consumer confidence Business confidence
1. Difference between the percentages of respondents giving positive and negative replies.
Source: Eurostat.
4
Jan-19 Jul-19 Jan-20 Jul-20 Jan-21 Jul-21 Jan-22 Jul-22
Rising
prices have pushed inflation up
5
Excluding energy, food, alcohol and tobacco. 2. Preliminary estimates for November; light blue bars
October values.
-20 -10 0 10 20 30 40 50 60 -4 -2 0 2 4 6 8 10 12 2019 2020 2021 2022 % % A. Inflation developments ←Headline inflation ←Core inflation¹ Energy inflation→ 0 5 10 15 20 25 CHE ESP FRA LUX NOR IRL GRC FIN SWE EA PRT BEL SVN AUT NLD DEU DNK ITA SVK CZE POL EST LVA HUN LTU Y-o-y % changes
Harmonised headline inflation November or latest available month²
energy
1.
are
Source: Eurostat.
B.
Inflation has become more broad-based
Percentage of items
Ireland, inflation above 4% Euro area, inflation above 4% Ireland, inflation above 10%
Note: Calculations based on a common set of 213 sub-indices.
Eurostat.
6
Source:
0 10 20 30 40 50 60 70 80 Sep-20 Dec-20 Mar-21 Jun-21 Sep-21 Dec-21 Mar-22 Jun-22 Sep-22
7
activity
slow
Excludes those large transactions of foreign companies that do not have a sizeable impact on the domestic economy.
macroeconomic indicators Annual percentage changes, unless noted 2021 2022 2023 2024 Gross domestic product 13.4 10.1 3.8 3.3 Modified total domestic demand1 5.9 8.0 0.9 3.1 Consumer price index (harmonised) 2.4 8.4 7.2 2.9 Core inflation (harmonised) 1.7 4.8 4.6 3.0 Unemployment rate (% of labour force) 6.2 4.7 5.3 5.1
Economic
is projected to
1.
Source: OECD (2022), Economic Outlook 112 (database). Selected
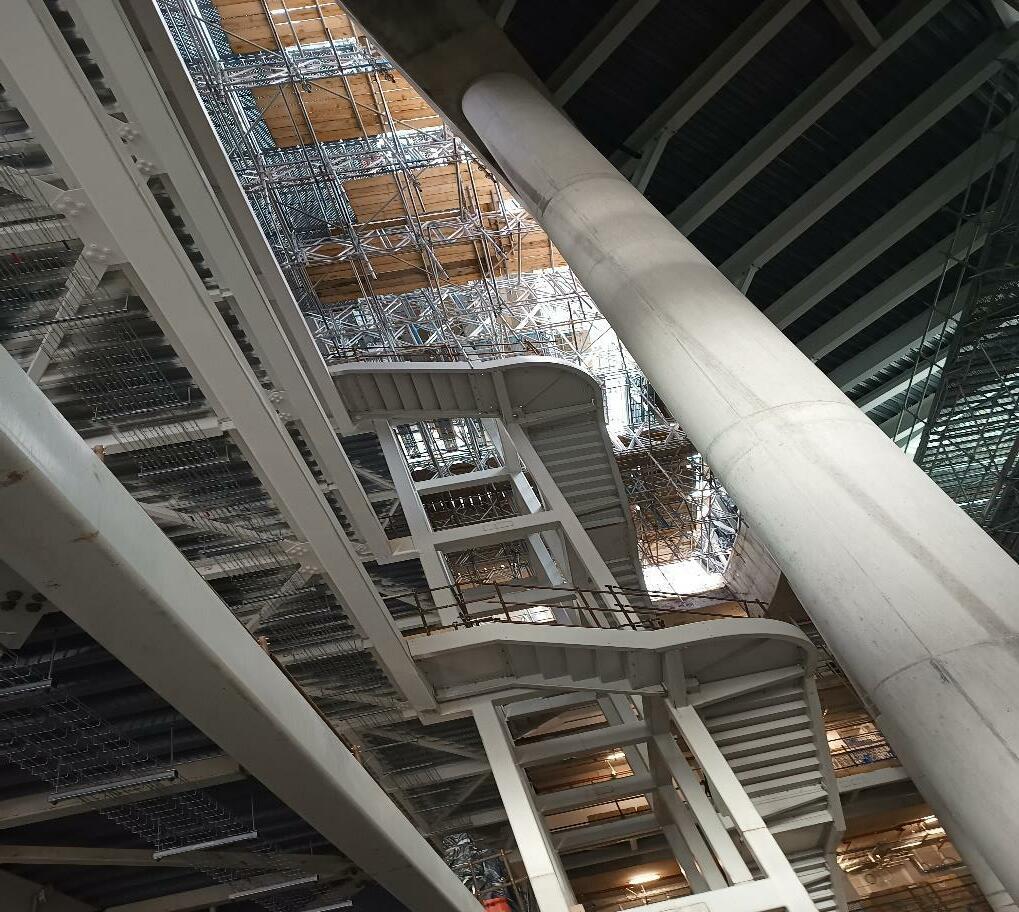
PROMOTING FISCAL SUSTAINABILITY IN THE FACE OF LONG-TERM CHALLENGES
Detail of the inner building structure of Dublin’s New Children Hospital, currently under construction.
8
Corporate
9
tax
Tax receipts and disbursements, general government 0 20 40 60 80 100 120 140 2014 2015 2016 2017 2018 2019 2020 2021 2022 2023 2024 Projections Corporate tax receipts Other tax receipts Total disbursements EUR billion
receipts have helped improve public finances Source: OECD (2022), Economic Outlook (database).
The global financial crisis has left a legacy of underinvestment
Nominal spending, general government
Index 2008 = 100
Gross fixed capital formation
Total spending
Source: Central Statistical Office.
10
0 20 40 60 80 100 120 140 160 2000 2005 2010 2015 2020
Public debt is elevated
Gross government debt per capita Current USD PPPs (thousands), 2021
11
0 10 20 30 40 50 60 70 EST LVA CZE LTU POL SVK SWE DNK HUN NOR SVN LUX NLD FIN EU DEU PRT ESP AUT FRA IRL GRC BEL
Source: OECD calculations based on the OECD National Accounts database.
An ageing population will substantially increase fiscal spending
based on
Department Long-term Model.
12
-4 -2 0 2 4 6 8 10 12 GRC PRT LVA NLD ISR LTU NOR EST CAN CHE GBR HUN AUS DEU USA NZL FIN DNK SWE ISL IRL ESP BEL FRA CZE JPN SVN LUX ITA AUT KOR SVK POL Health and long-term care expenditure Pension expenditure
Source: Simulations
the OECD Economics
Percentage change in expenditures from 2021 to 2060 % points of potential GDP
Structural reforms are needed to ensure fiscal sustainability
General government gross debt
cent of GNI*
Baseline Adverse trend scenario Reform scenario
Note: The baseline scenario is calibrated on OECD long-term model simulations and Irish Fiscal Advisory Council (2020) spending assumptions, adjusted for recent fiscal outturns. The adverse trend scenario assumes a gradual erosion of tax revenue (EUR 4 billion per year by 2032, at 2020 constant prices). The reform scenario embodies the adverse trend and assumes pension reforms following package 4 proposed by the Pension Commission, an improvement in public sector cost efficiency (mainly in the health sector phasing in a 15% gain in spending efficiency over 20 years). All scenarios include ageing costs.
Source: OECD secretariat calculations.
13
Per
0 50 100 150 200 2020 2025 2030 2035 2040 2045 2050
Recommendations to promote fiscal sustainability
• Target support on the most vulnerable households, while keeping the impact on domestic activity broadly neutral.
• Continue to put excess windfall tax receipts in the National Reserve Fund.
• Consider strengthening the expenditure rule by giving it legislative status.
• Re-introduce the planned rise in the state pension age and link changes to life expectancy.
14
ENHANCING VALUE FOR MONEY IN HEALTHCARE

15
Gains in life expectancy have been impressive
Life expectancy at birth Years
Source: OECD, Health Statistics database.
16
72 74 76 78 80 82 84 1985 1990 1995 2000 2005 2010 2015 2020
Ireland OECD EU
Public spending on healthcare is high
Government health spending as a share of total public spending
Source: OECD, National Accounts database.
17
0 5 10 15 20 25 LVA POL FIN SVK ITA LTU SWE ESP FRA EST PRT BEL OECD AUT NOR NLD DNK DEU AUS JPN GBR CZE IRL USA %
2020
Decision-making power on health spending is highly centralised
Spending autonomy in the health sector
On a scale of 0 to 10, from fully centralised to fully decentralised
Note: Spending autonomy is considered across four different categories of rules and regulations: policy, budget, inputs and output and monitoring autonomy.
Source: OECD (2022), OECD Fiscal Decentralisation Statistics (database).
18
0.0 0.5 1.0 1.5 2.0 2.5 3.0 GRC ISL SVN LUX ISR IRL NLD JPN CHL LTU POL DEU NOR LVA OECD CZE BEL MEX DNK AUT GBR NZL CHE TUR AUS ITA ESP CAN
Waiting times for key
services are substantial
19
of persons waiting for a scheduled date for outpatient, inpatient and day case appointments
% of
0 2 4 6 8 10 12 14 16 2014 2015 2016 2017 2018 2019 2020 2021 2022 0-6 months 6-12 months 12+ months
healthcare
1. After first referral. End-December data for all years except 2022, for which the latest data available refer to end-October. Source: National Treatment Purchase Fund. Number
By duration,
population¹
In Ireland, institutional long-term care is costlier than home support services for those with severe needs
Total costs of long-term care as a % share of over-65s’ disposable income
Individuals at the median income
Ireland OECD
Home care for severe needs Institutional care
Note: Severe needs correspond to 41.25 hours of care per week. The costs of institutional care include the provision of food and accommodation, so are overestimated relative to home care.
Source: OECD analysis based on the Long-Term Care Social Protection questionnaire and the OECD Income Distribution database.
20
0
150 200 250
50 100
300 350 400
Recommendations on improving health sector performance
• Implement the reforms to create Regional Health Areas and rebalance healthcare delivery across primary, community and long-term care and hospitals.
• Introduce a Population-Based Resource Allocation funding model, as planned.
• Prioritise reforms to enhance the adoption of a unique health identifier and centralise data governance within a single independent body.
• Establish integrated funding and service delivery to offer home care and admission to long-term residential care when needed.
• Accelerate the implementation of the Single Assessment Tool to facilitate more effective person-centred care services.
21
ENSURING AFFORDABLE HOUSING

22
The
market is facing pressures
23
60 80 100 120 140 160 180 200 2013 2014 2015 2016 2017 2018 2019 2020 2021 2022
Real house prices Ireland OECD Index 2013 = 100, s.a. 0 100 200 300 400 500 600 700 GRC FRA ITA FIN ESP LVA AUT EST LTU CHE DEU DNK EU NOR BEL SWE OECD NLD GBR CAN IRL CZE ISL NZL LUX POL
dwellings
thousand inhabitants 2020
latest year
housing
Source: OECD, Analytical House Price Indicators; and OECD, Affordable Housing database.
A.
B. Number of
per
or
available
Housing affordability is a concern
Source: OECD, Affordable Housing database.
24
0 5 10 15 20 25 30 35 KOR EST USA PRT POL SVN OECD HUN NOR LVA GRC AUS ITA BEL CHE DEU ESP CAN JPN AUT NLD ISL LUX GBR SWE FRA CZE IRL DNK ISR FIN SVK %
expenditure as a share of final consumption expenditure of households 2021 or latest available year
Housing
Housing
constrained by high
25
construction
0 5 10 15 20 25 30 35 2011 2012 2013 2014 2015 2016 2017 2018 2019 2020 2021
New dwelling completions Thousands Policy objective of the “Housing for all” plan: 33 000 new homes per year up to 2030 Single house Scheme house¹ Apartment 95 100 105 110 115 120 125 130 135 2015 2016 2017 2018 2019 2020 2021 2022
Construction costs²
2015
100
supply is
construction costs, skills shortages and burdensome regulations 1. Houses forming part of a multi-unit development of two or more houses connected to a single Electricity Supply Board network. 2. Industrial Price index (excluding VAT), building and
materials and wages. Source: Central Statistical Office.
A.
B.
Index,
=
Recommendations to enhance the provision of housing
• Prioritise supply-side housing policies in the implementation of the Housing for All Strategy.
• Expedite the streamlining of planning and judicial review processes, for example by establishing a special division in the High Court to reduce delays.
• Address capacity issues in the planning system and sufficiently resource local planning authorities.
26
LOWERING GREENHOUSE GAS EMISSIONS
27
Meeting Ireland’s emission reduction targets hinges on bold and efficient policies
Total greenhouse gas emissions, including LULUCF
CO2 equivalent emissions, thousands of tonnes Linear path Actual emissions 2050 target 2030 target
Note: The linear path is the interpolated path to the emission reduction targets relative to 2018 levels for 2030 (-51%) and 2050 (net zero emissions) as stated in the 2021 Climate Action Plan. LULUCF refers to land use, land-use change and forestry.
Source: Environmental Protection Agency and OECD secretariat calculations.
28
15 000 30 000 45 000 60 000 75 000 90 000 1990 1995 2000 2005 2010 2015 2020 2025 2030 2035 2040 2045 2050
0
The supply of renewable energy has risen
Share of renewables in primary energy supply
Per cent
Ireland OECD
Source: OECD, Green Growth Indicators.
29
5 10 15 2000 2002 2004 2006 2008 2010 2012 2014 2016 2018 2020
0
Emissions come mostly from the agriculture and transport sectors
GHG emissions shares, excluding LULUCF Per cent
Agriculture Transport
Source: OECD, Greenhouse Emissions database.
30
0 10 20 30 40 50 60 70 80 90 100 POL NLD DEU BEL AUS ITA EST OECD EU GBR FIN USA PRT ESP FRA SWE LVA LTU IRL DNK NZL
•
Recommendations to lower greenhouse gas emissions
Expedite the planning process to reduce uncertainty concerning major investments in wind turbine capacity.
• Realign transport policies to reduce private car ownership and facilitate the provision and use of low or no carbon travel alternatives.
• Ensure that farmers face stronger economic incentives to reduce emissions, such as by pricing methane emissions.
31
For more information

https://www.oecd.org/economy/ireland-economic-snapshot/
Disclaimers:
The statistical data for Israel are supplied by and under the responsibility of the relevant Israeli authorities. The use of such data by the OECD is without prejudice to the status of the Golan Heights, East Jerusalem and Israeli settlements in the West Bank under the terms of international law. This document and any map included herein are without prejudice to the status of or sovereignty over any territory, to the delimitation of international frontiers and boundaries and to the name of any territory, city or area.
OECD OECD Economics
32
