


Activity has recovered from the COVID-19 pandemic and remains strong
Source: OECD Economic Outlook database.


Source: OECD Economic Outlook database.

Indonesia
Source: World Bank World Development Indicators. Gross
Average of Malaysia, Philippines, Thailand, Viet Nam
Note: Gross domestic product is expressed in current international dollars converted by purchasing power parity (PPP) conversion factors.




Source: OECD Economic Outlook 116 (preliminary) and OECD calculations.



Note: The baseline scenario assumes government spending to increase by 0.5 percentage points of GDP annually between 2026 and 2030 as green investments increase substantially, and by 0.3 percentage points annually over the following fifteen years, with the deficit rising by 1 percentage points of GDP over the next five years. In the reform scenario, stronger revenues (increased taxation and efficiency savings) help to absorb new spending without increasing the deficit. With additional growthenhancing reforms, GDP growth converges to 7% over the next decade. Source: OECD Economic Outlook, No. 115; IMF, World Economic Outlook database; and OECD calculations.




Note: The OECD’s Programme for International Student Assessment (PISA) measures 15-year-olds’ ability to use their reading, mathematics and science knowledge in tests based on real-life scenarios. The OECD aggregate covers 23 OECD countries. It does not include Austria, Chile, Colombia, Costa Rica, Estonia, Israel, Lithuania, Luxembourg, the Netherlands, the Slovak Republic, Slovenia, Spain, Türkiye, the United Kingdom, and the United States.
Source: OECD PISA databases.

Note: The information used to build all the PMR indicators refers to the laws and regulations into force on 1 January 2023 or 2024. When the regulatory issues included in the PMR indicators are not set at the federal level for Indonesia, the information refers to the Special Capital Region of Jakarta.
Source: OECD PMR database and OECD-WBG PMR database for 2023/2024.

Note: EMERG20 refer to G20 emerging countries excluding Indonesia (Argentina, Brazil, China, India, Mexico, Türkiye, and South Africa). Data for this group are calculated as an unweighted average.
Source: Transparency International.

Female labour force participation rate (%), 15-64 years, 2022
Note: 2019 for Indonesia. The gender gap corresponds to the percentage-point difference between male and female labour force participation rate. Source: OECD Employment database.

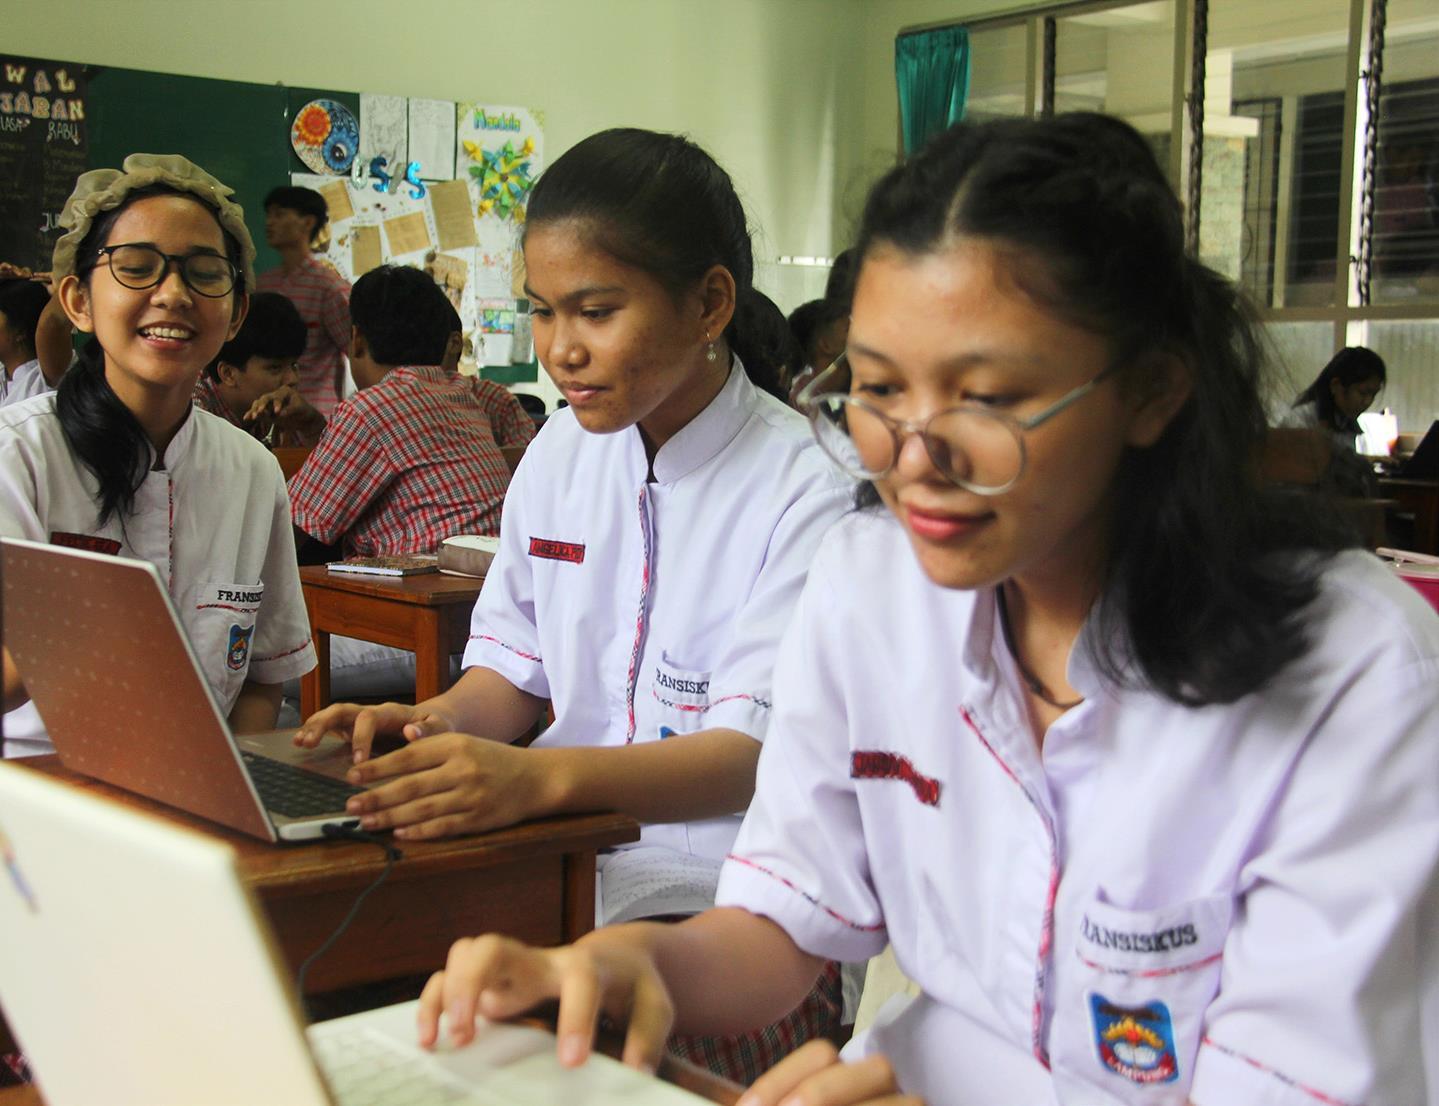

Note: Data refer to 2022 for India, 2020 for South Africa and 2019 for Malaysia and Türkiye. The surveyed firms respond to the following question: at the present time, does this establishment use its own website?
Source:

Note: The fibre penetration rate is the share of the number of subscribers for Fibre to the Home (FTTH) and Fibre to the Building (FTTB) in the total households.
Source: FTTH Council Europe, FTTH/B Global Ranking 2024.

Note: The fixed broadband basket (5GB) refers to the cheapest plan providing at least 5GB of monthly high-speed data (above 256Kbit/s) from the operator with the largest market share in each economy. It is calculated as a percentage of a country’s average monthly GNI per capita. OECD refers to the unweighted average of data for 38 member countries.
Source: ITU World Telecommunication/ICT
Database.

Scale from 0 to 1 (highest)
Note: The EGDI is a composite indicator that measures the readiness and capacity of national institutions to use ICTs to deliver public services. It is the weighted average of three normalised indices: 1) telecommunications Infrastructure Index; 2) Human capital Index; and 3) Online Service Index. The higher the EGDI is, the higher is the level of e-government development in a country.
Source: UN e-Government Knowledgebase (UNeGovKB).


Note: Based on CRED/UCLouvain (2024), the International Disaster Database (EM-DAT, www.emdat.be). Other events include drought, mass movement, storm and wildfire.
Source: OECD, “Adapting infrastructure to changing climatic conditions: The case of Indonesia”, OECD
s (forthcoming).

GHG emissions: trends and targets, 2005-60 Million Tonnes of CO2 equivalent
Note: The 2030 target is relative to Business-as-usual (BAU) projections where no countermeasure is implemented, and is based under countermeasure (conditional mitigation scenarios, CM2) from the Enhanced Nationally Determined Contribution Report by Indonesia to the UNFCCC (2022).
Source: Laporan Inventarisasi Gas Rumah Kaca (GRK) Dan Monitoring, Pelaporan, Verifikasi (MPV) 2023, Volume 9, Januari 2024; and MoEF (2022), Enhanced Nationally Determined Contribution (NDC) under the United Nations Framework Convention on Climate Change (UNFCCC).

Note: Other renewables include hydro, wind, solar, geothermal and other energies.
Source: IEA, Electricity Information (database).

Note: EMERG20 refers to G20 emerging economies excluding Indonesia: Argentina, Brazil, China, India, Mexico, South Africa, Saudi Arabia, Russia, and Türkiye.
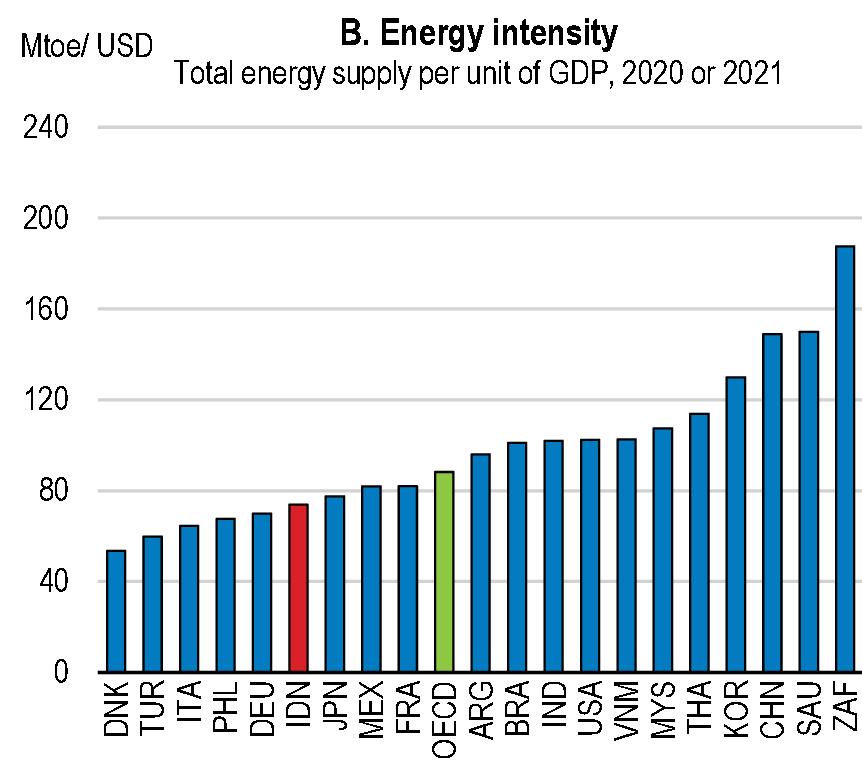
Source: IEA (2023), GHG emissions from energy; and World Bank (2024), World Development Indicators.



Disclaimers:
The statistical data for Israel are supplied by and under the responsibility of the relevant Israeli authorities. The use of such data by the OECD is without prejudice to the status of the Golan Heights, East Jerusalem and Israeli settlements in the West Bank under the terms of international law. This document and any map included herein are without prejudice to the status of or sovereignty over any territory, to the delimitation of international frontiers and boundaries and to the name of any territory, city or area.