Tracking Economic Instruments and Finance for Biodiversity 2024
Tracking economic instruments and finance for biodiversity
The UN Convention on Biological Diversity’s (CBD) Kunming-Montreal Global Biodiversity Framework (KMGBF), adopted in December 2022, sets out four long-term goals to 2050 and 23 action-orientated targets to be achieved by 2030. The 23 targets are intended to achieve the mission of the Framework, which is to halt and reverse biodiversity loss and put nature on a path to recovery by 2030
Target 18 of the Kunming-Montreal Global Biodiversity Framework calls for governments to scale up positive incentives for the conservation and sustainable use of biodiversity
The role of positive incentives in addressing biodiversity loss was also recognised in the CBD 2011-2020 Strategic Plan for Biodiversity under Aichi Target 3, which called for governments to develop and apply positive incentives for the conservation and sustainable use of biodiversity.
Positive incentives for biodiversity encompass the economic policy instruments (also referred to as
“incentive-based” instruments) that provide incentives to conserve and sustainably use biodiversity. They include taxes, fees, environmentally-motivated subsidies, tradable permit schemes, payments for ecosystem services, and biodiversity offsets. These incentives provide price signals to both producers and consumers to behave in a more environmentally-sustainable way. In economic terms, biodiversity-positive incentives are key to addressing the market failures associated with the use of biodiversity and its ecosystem services. Compared to more traditional regulatory (command-and-control) instruments, economic instruments provide continuous incentives to help achieve a given environmental objective in a more cost-effective way.
Positive incentives for biodiversity can be applied to address a wide range of pressures on biodiversity, such as land- and sea-use change, over-exploitation of natural resources, and pollution. They are therefore a key tool to mainstreaming biodiversity across sectors and can help to align public and private activities and fiscal and financial flows with the goals and targets of the KMGBF, as called for in Target 14. By helping to reflect the true value of biodiversity and ecosystem services in economic decision-making, biodiversity-positive incentives can play a role in unlocking private finance and investment for biodiversity.
Moreover, these incentives are able to generate revenue (e.g., as in the case of taxes and fees) and mobilise finance for biodiversity. Revenue generated from biodiversity-relevant taxes and fees is, in cases, also
earmarked to help finance biodiversity conservation and sustainable use. These incentives are therefore also relevant to Target 19 of the KMGBF on resource mobilisation, which calls on governments to increase finance from all sources, public and private, to more than USD 200 billion a year.
The OECD Environmental Policy Committee (EPOC), through its database on Policy Instruments for the Environment (PINE), collects quantitative and qualitative information on policy instruments relevant to the environment, with data currently spanning 146 countries worldwide. This 2024 update of Tracking Economic Instruments and Finance for Biodiversity presents data on the biodiversity-relevant economic instruments and the finance they mobilise, based on currently available data in PINE.
Key highlights – 2024
l The number of biodiversity-positive taxes has increased since 1980, though uptake has slowed since about 2015. There are a total of 227 biodiversitypositive taxes in force today across 70 countries. In OECD countries, these biodiversity-relevant taxes generate approximately USD 9.96 billion a year (average 2020-2022) in revenue. Across all the countries with available data, the revenue from these taxes amounted to approximately USD 10.86 billion a year.
l The number of biodiversity-positive fees has also been on the rise, with 301 fees in force covered in the PINE database, across 75 countries.
l The number of biodiversity-relevant tradable permit schemes has been relatively stable over the past decade, with 34 tradable permit schemes currently active in 25 countries.
l According to data reported in PINE, the number of biodiversity-positive subsidies currently in force is 240, in place in 34 countries.
l As of 2022, the PINE database also allows for the collection of data on two additional types of biodiversity-positive incentives, namely payments for ecosystem services (PES) and biodiversity offsets As of 2024, 51 PES schemes and 17 biodiversity offset programmes are recorded in PINE, across 28 and 9 countries respectively.
POLICY INSTRUMENTS FOR THE ENVIRONMENT (PINE) DATABASE
The OECD PINE database contains more than 4 590 policy instruments relevant to the environment - of which more than 4000 are active in 2024, from across 146 countries. The policy instruments covered include:
l taxes
l fees (including charges)
l tradable permits
l environmentally-motivated subsidies
l payments for ecosystem services
l biodiversity offsets
For each policy instrument, the following information is collected:
l when it was introduced
l what it applies to
l the geographical coverage
l the relevant environmental domains (e.g. biodiversity, climate change, air pollution)
l the industries concerned
l revenue, cost or rates, exemptions, etc.
Environmental domains represent the focal issues (environmental externalities) covered by a certain policy instrument. Instruments can have both a direct and an indirect effect on several environmental domains; however, only the domain to which the instrument has a direct effect is indicated in the database. Multiple domains can be indicated for a single instrument. For example, a water effluent charge will have both chemicals management and biodiversity as its environmental domains.
In reality, every domain could be related indirectly; hence, the classification by domain is most valuable if only used in a direct narrow sense. For instance, a tax on motor vehicle fuel will have a direct effect on climate change, energy efficiency and air pollution. Through its effect on climate change, it may also have an indirect effect on biodiversity. In this case, biodiversity is not indicated as an environmental domain.
Biodiversity-positive taxes
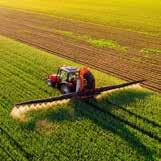
Taxes that provide incentives to conserve and sustainably use biodiversity include those on pesticides, fertilisers, forest products and timber harvests. Based on the polluter pays principle, these biodiversity-positive taxes place an additional cost on the use of the natural resource or the emission of a pollutant, to reflect the negative environmental externalities that they generate. As such, they incentivise producers and consumers to adopt more environmentally-sustainable practices.
According to data reported in the OECD PINE database, 70 countries have active biodiversity-positive taxes. While the number of countries with biodiversity-positive taxes has increased substantially from 1980, uptake has been slower since about 2015 (Figure 1). Across these countries, 227 biodiversity-positive taxes are in place in 2024 (Figure 2).
REVENUE GENERATED FROM BIODIVERSITY-POSITIVE TAXES
Biodiversity-relevant taxes generated USD 9.96 billion a year in revenue across OECD countries (2020-22 average). While this might be considered a substantial amount, it only constitutes 1.3% of all environmentally-related tax revenue or about 0.06% of total tax revenue. The total revenue generated by biodiversity-relevant taxes across all countries for which data are available amounted to USD 10.86 billion per year (2020-22 average).
Countries with biodiversity-positive taxes
Total countries (including countries with taxes with unknown start date)
Note: Total countries, in 2024, includes eight countries with biodiversity-positive taxes for which start dates are unknown.
Source: OECD PINE database, accessed 27 August 2024.
Figure 2. NUMBER OF BIODIVERSITY-POSITIVE TAXES
Figure 1. NUMBER OF COUNTRIES WITH BIODIVERSITY-POSITIVE TAXES
Biodiversity-positive fees
Biodiversity-positive fees (also referred to as charges) include entrance fees to national parks, fees on hunting and fishing licenses, charges on land-based sewage discharge and for groundwater abstraction and biodiversity-relevant non-compliance fines.
Currently, 75 countries have biodiversity-positive fees in place. Figure 3 depicts the trend in the number of countries with biodiversity-positive fees over 1980-2024. The number of active biodiversity-positive fees is 301. Figure 4 shows the trend over time for those instruments where data on the year they were introduced are available.
REVENUE GENERATED FROM BIODIVERSITY-POSITIVE FEES
In a number of cases, revenue generated from these fees is earmarked to finance biodiversity protection.
For example, 100% of the revenue generated by the visitor fee to the Australian Great Barrier Marine Park is used to finance its management, including education, research, ranger patrols and policy development.
What is the difference between a tax and a fee (or charge)?
A fee (or charge) is a requited payment to general government, meaning that the payer of the fee gets something in return, more or less in proportion to the payment made, whereas a tax is a compulsory unrequited payment. For example, a wastewater payment that varies according to the volume of water consumed would constitute a fee (sometimes called a charge), while a wastewater payment that varies according to the amount of pollution generated would be classified as a tax. In the OECD PINE database, the terms “fees” and “charges” are used interchangeably.
BIODIVERSITY-POSITIVE
Total countries (including countries with taxes with unknown start date)
Note: Total countries, in 2024, includes nine countries with biodiversity-positive fees for which start dates are unknown.
Source: OECD PINE database, accessed 27 August 2024.
OF BIODIVERSITY-POSITIVE FEES
Note: 2 inactive instruments with unknown start date are not reflected in the figure.
Source: OECD PINE database, accessed 27 August 2024.
Figure 4. NUMBER
Figure 3. NUMBER OF COUNTRIES WITH
FEES
Biodiversity-positive tradable permits and biodiversity offset schemes
BIODIVERSITY-POSITIVE TRADABLE PERMITS
Biodiversity-relevant tradable permits include individual transferable quotas (ITQs) for fisheries, tradable development rights, and tradable hunting rights. These policy instruments set an aggregate limit on the total amount of a natural resource that can be exploited, and then allocate individual permits to users that they can trade. The allocation of these permits can be grandfathered (i.e. allocated to existing users of the resource free of charge, typically in perpetuity) or auctioned. If they are auctioned, tradable permits can also generate revenue.
Currently, 25 countries have biodiversity-positive tradable permits, with a total of 34 schemes (Figures 5 and 6 respectively). According to the PINE data, in 2024, ITQs for fisheries are the main type of biodiversitypositive tradable permit schemes.
BIODIVERSITY OFFSETS
Biodiversity offsets are defined as measurable conservation outcomes resulting from actions designed to compensate for significant residual adverse biodiversity impacts arising from project development after appropriate prevention and mitigation measures have been taken. They are applicable to a wide range of sectors (e.g. mining, wind power, property development) and can be used to compensate for impacts on a variety
Note: 1 country with at least one biodiversity-positive subsidies is not included in this figure as starting date is not available. Source: OECD PINE database, accessed 27 August 2024.
Biodiversity-positive tradable permit schemes
Total (including tradable permit schemes with unknown start date)
Note: 8 inactive instrument with unknown start date are not reflected in the figure. Source: OECD PINE database, accessed 27 August 2024.
Figure 6. NUMBER OF BIODIVERSITY-POSITIVE
Figure 5. NUMBER OF
of ecosystems. Biodiversity offset schemes operate with an overall objective of no net loss of biodiversity, with some schemes adopting a more ambitious objective of a net gain in biodiversity. By imposing additional costs on developers whose activities have adverse impacts on biodiversity, biodiversity offsets are thus in line with the polluter pays approach.
Since 2022, the PINE database also allows for the reporting of information on biodiversity offset schemes, thereby providing a platform where data on biodiversity
offset schemes can be collected in a structured and harmonised way across countries. While comprehensive data on biodiversity offsets is not yet available, the PINE database contains 9 countries with biodiversity offsets programmes in 2024 (Figure 7), covering a total of 17 active biodiversity offset schemes (Figure 8). Biodiversity offset programmes are generally implemented in one of three ways: as one-off offset projects; bio-banking; or inlieu fee programmes (OECD, 2016).
While recent data on finance mobilised by biodiversity offsets is not yet available, previous studies have estimated that the finance mobilised by biodiversity offset schemes was in the order of USD 6.3-9.2 billion per year (Deutz et al. 2020).
Figure 8. NUMBER OF BIODIVERSITY OFFSET SCHEMES
Figure 7. NUMBER OF COUNTRIES WITH BIODIVERSITY OFFSETS)
Biodiversity-positive subsidies
A subsidy is defined as environmentally beneficial if it reduces directly or indirectly the use of something that has a proven, specific negative impact on the environment. Biodiversity-positive subsidies include, for example, grants or loans to help finance sustainable forest management and reforestation, organic or pesticide-free agriculture, and land conservation.
There are currently 34 countries that have biodiversitypositive subsidies with a total of 240 biodiversity-positive subsidies, as reported in the PINE database (Figure 9 and 10 respectively).
Countries with biodiversity-positive subsidies
Total countries (including countries with subsidies with unknown start date)
Note: 1 country with at least one biodiversity-positive subsidies is not included in this figure as starting date is not available.
Source: OECD PINE database, accessed 27 August 2024.
Total
Note: 8 inactive instrument with unknown start date are not reflected in the figure.
Source: OECD PINE database, accessed 27 August 2024.
Figure 10. NUMBER OF BIODIVERSITY-POSITIVE SUBSIDIES
Figure 9. NUMBER OF COUNTRIES WITH BIODIVERSITY-POSITIVE SUBSIDIES
Payments for ecosystem services (PES) programmes
Payments for ecosystem services (PES) have been defined as: (1) voluntary transactions (2) between service users (3) and service providers (4) that are conditional on agreed rules of natural resource management (5) for generating offsite services (Wunder, 2015). PES are based on the user- or beneficiary-pays approach.
Since 2022, the PINE database also allows for the collection of information on PES programmes, thereby providing a platform where data on PES schemes can be collected in a structured and harmonised way across countries. While comprehensive data on PES programmes is not yet available, the PINE database contains 28 countries with active PES programmes in 2024 (Figure 11), covering a total of 51 PES programmes (Figure 12).
Figure 12. NUMBER OF PAYMENTS FOR ECOSYSTEM SERVICES (PES)
Figure 11. NUMBER OF COUNTRIES WITH PAYMENTS FOR ECOSYSTEM SERVICES (PES)
Overview of biodiversity-positive incentives
The trends in the uptake of biodiversity-positive incentives since 1980 are depicted in Figure 13 illustrating that there has been a gradual increase in the number of biodiversity-
positive incentives over time. In 2024, the total number of active biodiversity-positive incentives (i.e. including those where their starting date is not available) is 869.
Figure 13. NUMBER OF ACTIVE BIODIVERSITY-POSITIVE INCENTIVES 1980-2024
Taxes Fees Subsidies Payments for ecosystem services
Tradable permits schemes Biodiversity offsets
Total (including incentives with unknown start date)
Note: 16 inactive instruments with unknown start date are not reflected in the figure.
Source: OECD PINE database, accessed 27 August 2024.
Mainstreaming biodiversity across sectors
Each policy instrument in the PINE database can be tagged with one or more of the 54 industry codes using the United Nations’ International Standard Industrial Classification of All Economic Activities (ISIC) Rev. 4. Currently, 72.6% of the biodiversity-positive incentives in the PINE database include data on the ISIC codes.
Analysis of the industry codes offers insights on where these incentives are used to mainstream biodiversity
across different sectors. As illustrated in Figure 14 (Panel A), the largest proportion of biodiversity-positive incentives are applied in the agriculture, forestry and fishing sector (30.8%), followed by the water supply, sewerage, waste management and remediation activities (12.2%) and manufacturing (8.2%). Within the agriculture, forestry and fishing industry code, the biodiversity-positive incentives are approximately equally distributed (Panel B).
Figure 14. SECTORAL COVERAGE OF BIODIVERSITY-POSITIVE INCENTIVES
More on the PINE methodology and how to contribute
Information for the PINE database is collected via a network of 500 country experts, from government agencies (Ministries of Finance and Environment, statistical institutes) as well as research institutes and international organisations. Data are collected systematically for the 38 OECD members as well as the active accession countries. A growing number of non-member countries also provide information. Registered experts are asked to update data at least once a year, typically in January or February, through a password-protected interface. The data collection method may result in some reporting bias, as OECD members and active accession countries are likely to report more data on a regular basis, and all figures should be interpreted in this context.
The OECD Secretariat, in consultation with countries, validates the data before they are published online. The
management of PINE is overseen by OECD Committees and Working Parties such as the Working Party on Environmental Information (WPEI) and the Joint Meetings of Tax and Environment Experts (JMTEE). Please contact pinedatabase@oecd.org if you have any feedback on the database, or if you would like to contribute on a regular basis.
The PINE database classifies instruments into 5 broad categories and allows for tagging the instruments by 22 environmental domains (Figure 15). For the purposes of this analysis, the categories have been further disaggregated as shown below. While the PINE database currently covers policy instruments from across 146 countries, the policy instruments in the database should not be considered to be exhaustive.
Figure 15. POLICY INSTRUMENTS BY ENVIRONMENTAL DOMAIN
Further reading
Chhun, B., et al. (2024), “Environmental domain tagging in the OECD PINE database”, OECD Environment Working Papers, No. 232, OECD Publishing, Paris, https://doi.org/10.1787/be984b0a-en
Deutz, A., et al. (2020), Financing Nature: Closing the global biodiversity financing gap. The Paulson Institute, The Nature Conservancy, and the Cornell Atkinson Center for Sustainability.
Wunder, S., (2015). “Revisiting the concept of payments for ecosystem services”, Ecological Economics, Vol. 117. https://doi.org/10.1016/j.ecolecon.2014.08.016
Tracking Economic Instruments and Finance for Biodiversity 2024
This brochure provides the latest data on biodiversity-relevant economic instruments (known as positive incentives under the Convention on Biological Diversity Kunming-Montreal Global Biodiversity Framework) and the finance they mobilise, across more than 140 countries. It covers biodiversity-positive taxes and fees, tradable permits, environmentally-motivated subsidies, payments for ecosystem services (PES) and biodiversity offsets –key instruments to mainstream biodiversity across sectors and incentivise more sustainable behaviour.