Costa Rica HIGHLIGHTS 2023


The Organisation for Economic Co-operation and Development (OECD) provides its 38 member countries with a forum to work together to address the economic, social and environmental challenges of globalisation. The OECD is also at the forefront of efforts to help governments respond to new developments and concerns. The Organisation provides a setting where governments can compare policy experiences, seek answers to common problems, identify good practice and work to co-ordinate domestic and international policies.
The OECD Environmental Performance Reviews (EPRs) provide evidence-based analysis and assessment of countries’ progress towards their environmental policy objectives. They promote peer learning, enhance government accountability and provide targeted recommendations to help countries improve their environmental performance. They are supported by a broad range of economic and environmental data. Over the last 30 years, the OECD has conducted over 100 Reviews of OECD members and selected non-member countries.
All reports, and more information, are available on the EPR website: http://oe.cd/epr.
This is the first Environmental Performance Review of Costa Rica. It reviews the country’s environmental performance in the last decade. The process involved a constructive and mutually beneficial policy dialogue between Costa Rica and the countries participating in the OECD Working Party on Environmental Performance, which approved the Review’s Assessment and Recommendations on 12 May 2023. The OECD is grateful to the two examining countries: Colombia and New Zealand.
The Review provides 52 recommendations. They aim to help Costa Rica advance towards sustainable development and implement ambitious policies for environmental management and climate mitigation. The Review includes a special chapter on biodiversity conservation and sustainable use.


http://oe.cd/epr
KEY ENVIRONMENTAL INDICATORS 2021 (or latest available year)
GHG intensity – GHG emissions per capita
2.9 t CO2 eq. per capita (OECD average is 10.5)
Energy intensity – Total energy supply per capita
1 toe per capita (OECD average is 3.8)
Renewables (% of total energy supply)
51.5% (OECD average is 12)
Mean population exposure to PM2.5
14.3 μg/m3 (OECD average is 13.9)
Municipal waste per capita
313 kg per capita (OECD average is 534)
Material recovery of municipal waste (% of composting and recycling in total treatment)
6.7% (OECD average is 37.6)
Sanitation services (% of population using safely managed sanitation services)
30% (OECD average is 84)
Drinking water supply (% of population connected to safely managed drinking water services)
81% (OECD average is 94)
Environmental protection expenditure (% of GDP)
0.4% (OECD average is 0.6)
Environmental taxes (% of GDP)
2.3% (OECD average is 1.4)
Share of CO2 emissions priced above EUR 60/tCO2 (including emissions from biomass)
40% (2021, OECD average 27.3)
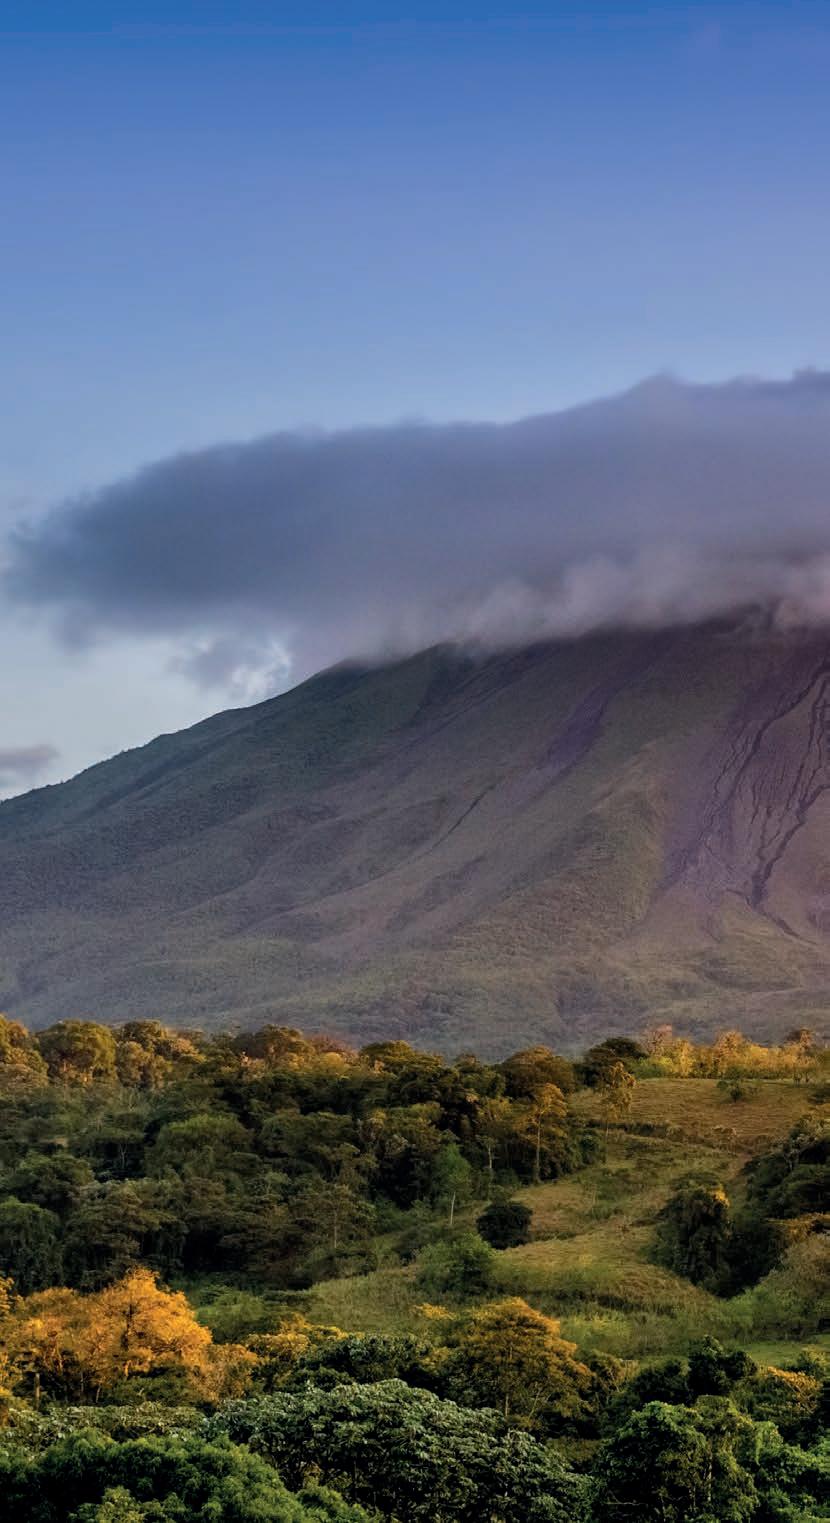
Costa Rica is globally known as a green country and ecotourism destination. Its environmental and natural resources are a pillar of the country’s development model, underpinning prominent tourism and agro-food sectors. Its open economy grew faster than on average in the OECD and in Latin America and the Caribbean in the last two decades. As in other upper middle-income economies, income per capita has increased significantly, but poverty and inequality remain stubbornly high. Population has grown, and urbanisation has intensified. Over 70% of the population live in the Greater Metropolitan Area around the capital San José.
A megadiverse tropical county, Costa Rica should be commended for reversing deforestation, producing all its electricity from renewables and committing to net zero by 2050. However, energy use and related greenhouse gas emissions increased in the last decade. Private cars are a major and growing source of emissions affecting climate and air quality. Waste disposal still relies on landfills, and much wastewater is untreated. Costa Rica’s long-standing biodiversity policy has helped protect the country’s forest ecosystems and wildlife. However, more should be done to tackle pressures on biodiversity from development of infrastructure and settlements, tourism, farming and fishing. The scale of investment needed to achieve the Sustainable Development Goals and carbon neutrality is daunting. It calls for improving the efficiency of public spending, mobilising private finance, strictly enforcing regulations and providing adequate incentives.

(or latest available year)
Population: 5.2 million
GDP per capita: USD 24 800 (current purchasing power parities) (OECD average is 53 900)
Total land area: 51 000 km2
Population density: 101 inhabitants/km2 (OECD average is 37)
Currency: USD 1 = CRC 647.1
l Fully implement the measures outlined in the National Decarbonisation Plan 2018-50 in all sectors according to a concrete timeline.
l Upgrade the power grids and their operating efficiency to support expansion of renewables and electrification of transport, industry and buildings.

l Introduce stringent mandatory energy standards for new buildings and renovations; strengthen the minimum energy performance standards for appliances.
l Accelerate implementation of an integrated public transport system in the Greater Metropolitan Area.
l Ensure that local land-use plans integrate sustainable mobility concerns.
l Pursue the electrification of motorcycles and urban buses in addition to that of private cars; continue to extend the charging points for electric vehicles across the road network.
l Strengthen pollutant emission standards for all passenger and freight road vehicles; adopt fuel efficiency or CO2 emission standards for vehicles; reinforce mandatory vehicles’ technical inspections.
l Reinforce capacity to invest in waste treatment and provide sound waste management services.
l Reform waste collection fees to ensure cost recovery and encourage waste sorting at source.
l Accelerate and scale up investment in water infrastructure.
l Ensure adequate supervision of the construction, operation and maintenance of septic tanks to minimise risks of contamination.

l Enforce the legislation requiring all municipalities to adopt adequate and sufficiently up-to-date land-use plans that consider environmental concerns; develop spatial marine plans and integrated management plans for the maritime terrestrial zones.
l Continue to strengthen the protected area system and improve its ecological representativeness and connectivity.
l Develop and systematically review management plans for all protected areas, Ramsar wetlands and biological corridors.
l Adopt a consistent methodology for setting entrance fees to protected areas, with a view to increasing cost recovery.
l Extend use of concession contracts for tourismrelated services in protected areas.
l Reinforce the Programme of Payments for Environmental Services (PPSA) and extend it to other ecosystems beyond forests.
l Broaden the sources of finance, including fiscal resources, for the PPSA, with a view to delinking the financial viability of the programme from fuel tax revenue.
l Remove tax exemptions for agrochemicals; ensure all pesticides are submitted to an appropriate environmental risk assessment.
l Continue to phase out market-price support for agricultural products; replace it with time-bound payments targeted to producers in need, as well as to encourage green farming practices.
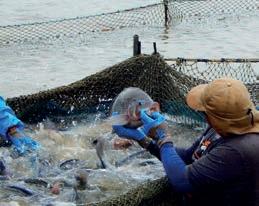
l Continue to remove fishery support linked to input use, primarily fuel use; repurpose the saved financial resources for targeted direct income support to fishers in need and for improving the environmental sustainability of fishing.
l Build on the legislative proposal on strengthening the environment ministry’s competencies to develop a plan for rationalising the environmental governance system.
l Swiftly implement integrated environmental permitting and inspections.
l Improve production, collection and dissemination of environmental statistics; update the GHG emission inventory more frequently; expand the ambient air monitoring network; strengthen water quality monitoring; and improve the knowledge base on the country’s biodiversity, particularly on marine and freshwater ecosystems.
l Scale up and accelerate environment- and climaterelated investment; increase private participation in infrastructure projects; ensure timely execution and quality of infrastructure projects.
l Expand the use of innovative financing mechanisms such as green bonds, conservation trust funds and debt-for-nature swaps to finance investment in decarbonisation and biodiversity.

l Accelerate the development and implementation of a comprehensive green tax reform, as foreseen by the National Decarbonisation Plan 2018-50. As part of the reform:
– Introduce carbon pricing; progressively raise the fuel tax rate on diesel; increase taxes on conventional vehicles and modulate them according to the vehicles’ weight, fuel efficiency and levels of local pollutant emissions; update road tolls and differentiate them according to vehicles’ emission parameters; consider introducing congestion charges in critical zones of the Greater Metropolitan Area.
– Use part of the revenue from increased environment-related taxes to mitigate their impact on low-income households and most affected economic sectors, as well as to finance policies and investment for the green transition; periodically review revenue-earmarking arrangements in a transparent way.
l Develop the regular stocktaking of tax expenditure into a systematic screening of actual and proposed subsidies; prepare a plan to phase out fossil fuel and other environmentally harmful subsidies.
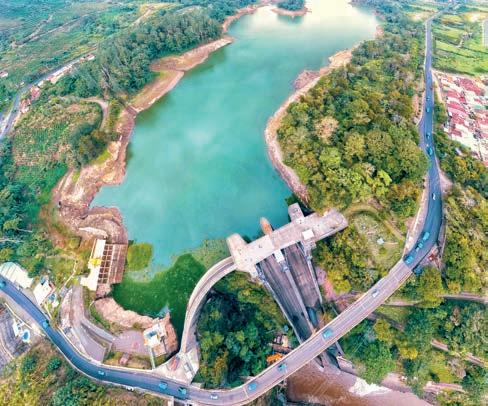
Costa Rica has made some progress in delinking environmental pressures from its economic growth over the last decade. Its electricity generation has been fully sourced from renewables since 2015. However, fossil fuels still cover half of the country’s energy needs. Greenhouse gas (GHG) emissions linked to fossil energy use grew by 11% in 2010-21. Still, net GHG emissions declined (by 13% in 2010-17) thanks to increased carbon removals by forests
Most electricity (73%) comes from hydropower; wind and geothermal produce about 12% of power each
(Figure 1). Increasing population, urbanisation and tourist arrivals have strained the undersized water, waste and transport infrastructure and services. Pressures on the environment are likely to grow with rising living standards and climate change.
The costs of climate change impacts are high. The National Adaptation Policy 2018-30 indicates that costs of climate-related extreme weather events could reach between 1.6% and 2.5% of gross domestic product (GDP) by 2025, including to repair damaged water and transport infrastructure. Nearly 80% of Costa Rica’s population live in areas at high risk from multiple hazards. Climate
change is expected to severely reduce the country’s water availability, leading to droughts in some key agricultural regions and affecting hydropower production. Exposure to wildfire is significant and threatens forest carbon capture capacity.
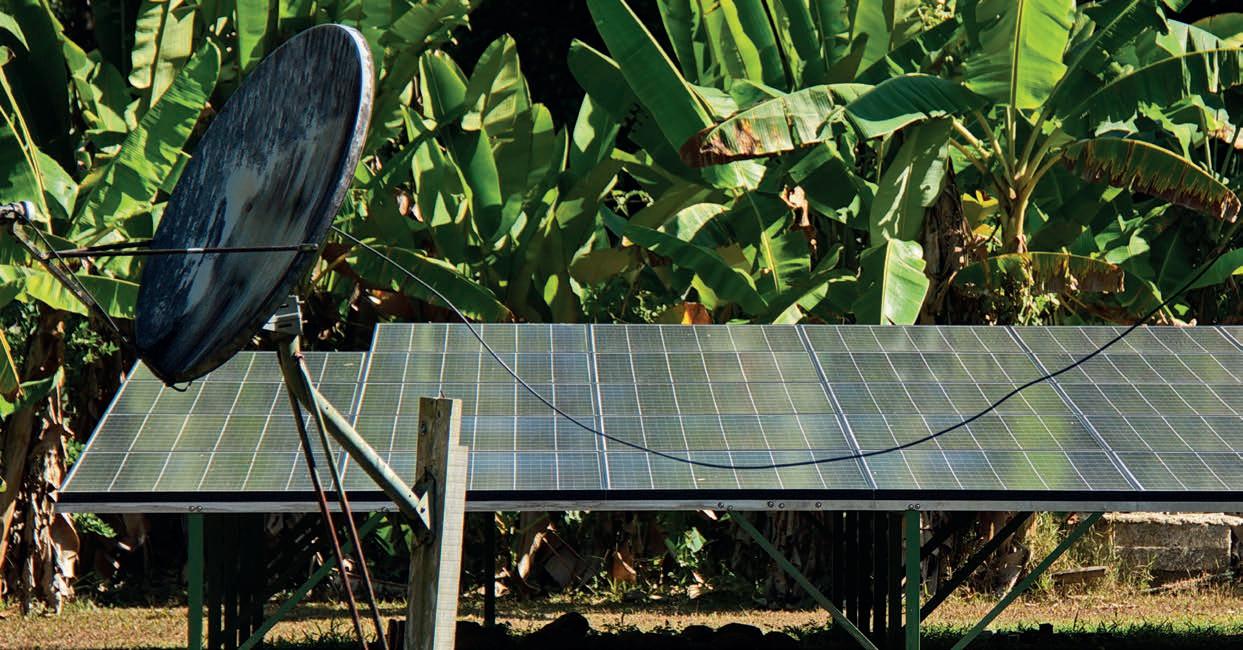
Costa Rica must stick to its plans to achieve its ambitious climate goals. It developed a comprehensive National Decarbonisation Plan (PND) to achieve carbon neutrality by 2050 – one of the few Latin American countries to do so. The country’s 2030 Nationally Determined Contribution is in line with this goal (Figure 1). Further expanding and diversifying renewable electricity sources will be crucial to sustain the electrification of transport, industry and buildings, which is a pillar of the PND (Box 1). This requires upgrading electricity grids and improving the operating efficiency of power systems. Costa Rica has advanced in rolling out smart meters. However, economic incentives and more stringent energy performance standards are needed to tackle energy use and GHG emissions from transport and buildings.

Costa Rica has made good environmental progress but could better align itself with more advanced countries
The entry into force of stricter Euro 6 or Tier 3 emission standards for vehicles was postponed to 2027

Air quality is of concern in major urban areas. Emissions of most air pollutants have grown over the last 20 years. Air quality limits are set in legislation, but more than 88% of the population is exposed to harmful levels of air pollution. Average annual concentrations of fine particulates (PM2.5) are nearly three times above the 2021 World Health Organization Air Quality Guidelines of 5 µg/m3. This poses a risk to human health. It is urgent to expand the air quality monitoring network to generate frequent and consistent data for decision making.

Decarbonising transport is essential to meet climate mitigation goals and improve quality of life. Costa Rica


heavily relies on road transport, which accounts for threequarters of energy-related GHG emissions. Energy use and GHG emissions from road transport grew by over 30% in the last decade. Road vehicles are also the largest emitters of air pollutants such as nitrogen oxides and particulates. The vehicle fleet has grown rapidly in the last decade, but most vehicles are over ten years old. Vehicle emission standards are lenient and weakly enforced.
Investing in an extended, integrated and electricitybased public transport would help reduce car dependence and avoid exacerbating inequality. The Greater Metropolitan Area, where most people live, has no integrated public transport system and suffers from heavy congestion. Costa Rica has expanded the charging network for electric vehicles (EVs) and adopted regulations and fiscal incentives to encourage their purchase. The number of EVs has increased in the last few years, but it represents a negligible share of the fleet. EV purchase subsidies should be combined with stringent vehicle standards and higher taxation of conventional vehicles. As in other emerging economies, barriers to developing electromobility include weak electricity grids and reliance on second-hand vehicles. Encouraging the use of electric two/three-wheelers and urban buses would be more cost effective.
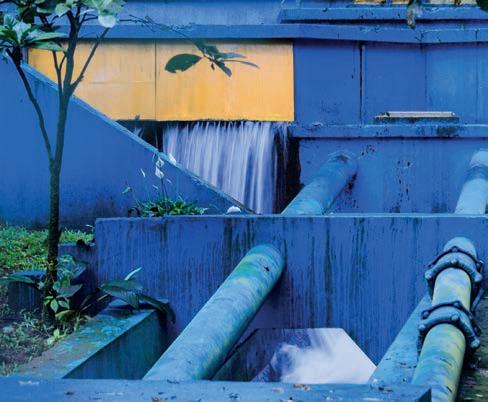
Water governance has advanced, but more investment in water infrastructure is urgently needed to expand
The National Decarbonisation Plan (PND) lays out the strategy and actions to decarbonise the economy, articulated into ten main axes and eight transversal strategies, including policy reforms (e.g. green fiscal reform and attraction of foreign investment for the low-carbon transformation). The PND covers all sectors of the economy and all greenhouse gases. Some key actions and targets are expected to deliver the largest emission abatement. These include the electrification of public and private vehicle fleet; increased reliance on public transport; electric trains for freight and passengers; upgraded electricity transmission and distribution systems to support electrification of the economy; improved energy efficiency and shifting to electricity use in buildings and industry; increased waste recycling and composting; completed sanitation and sewer system coverage; improved farming practices to reduce emissions from agriculture and husbandry; maintenance and increase of forest coverage.
Only 7% of Costa Rica’s population is connected to public wastewater treatment, compared to 52% in Brazil and 73% in Chile
access to water and sanitation services, extend wastewater treatment and reduce water losses. In 2020, only 30% of the population had access to safely managed sanitation. Three-quarters of households collected their wastewater with septic tanks, which are not regularly monitored. Much wastewater is untreated, resulting in contamination of soil and water bodies. The national programme of investment in sanitation and wastewater treatment should be scaled up and accelerated.
Swift action is required to improve waste management and move towards a circular economy. Costa Rica has made some progress in material recycling, including


through several extended producer responsibility schemes. However, waste disposal relies on landfills, with only 7% of waste being recovered (Figure 2). Less than half of households properly sort their waste – a major barrier to recycling. The quality of waste management services varies widely across municipalities. Collection fees often do not incentivise waste sorting or cover operating costs, let alone investment in treatment infrastructure. More waste prevention actions are also needed. While low in international comparison, generation of municipal waste has gradually increased since 2016. The ongoing development of the National Circular Economy Strategy aims to address these challenges.
Zero net deforestation is a major achievement, but biodiversity pressures persist. Costa Rica hosts diverse ecosystems and about 6% of the world’s species. Its biodiversity supports the country’s florid nature-based tourism, agriculture and fisheries, which also exert pressures on biodiversity. Other pressures include
infrastructure development, pollution and climate change. The country’s extensive protected area network and pioneering Programme of Payments for Environmental Services (PPSA) have helped extend forest cover and increase carbon sequestration capacity (Figure 3). Today, forests cover 59% of land, with about half under

Costa Rica’s long-standing biodiversity policy could be enhanced to tackle emerging challenges more effectively
protection. However, land conversion to pastures, crops and urban areas has grown since the mid-2010s. Traditionally intensive use of agrochemicals has affected aquatic ecosystems and species. Coastal areas, mangroves and other wetlands have deteriorated. Some marine resources are overexploited.
Biological corridors cover 38% of land area; private natural reserves extend over 2% of the country’s territory
There is scope to strengthen coherence, implementation and effectiveness of biodiversity policy. Costa Rica has achieved or is on track to achieve most of the 100 targets of the National Biodiversity Strategy 2016-25. The planned update of the strategy is an opportunity to bring the multitude of biodiversity-related programmes and policy measures into a more consistent framework, reduce institutional fragmentation, and improve implementation and cost effectiveness. The strategy should also identify actions to mainstream biodiversity considerations in sectoral policies. Further improving knowledge and data, particularly on marine and freshwater ecosystems, is essential to build consensus around biodiversity policy, identify priorities for action and manage natural resources effectively.
The PPSA has largely contributed to restoring degraded forestlands (Box 2). Building on this successful experience, Costa Rica should promptly establish a coherent framework for reinforcing the PPSA and extending it to non-forest ecosystems, in recognition
The Programme of Payments for Environmental Services (PPSA) pays landowners that commit to forest conservation, reforestation, regeneration of pastures, sustainable forest management or agroforestry on their lands, thereby contributing to providing ecosystem services. The PPSA recognises four forest-related ecosystem services: carbon sequestration, water provision, biodiversity protection and natural scenic beauty. Of the about 1.5 million hectares covered by the PPSA since its inception in 1997, more than 680 000 hectares were added between 2010 and 2022. In 24 years, the programme has paid more than USD 600 million to small and medium producers and led to the creation of 3 500 to 4 000 direct jobs each year. The PPSA provides more favourable conditions to farms led by Indigenous Peoples or women.
of the valuable services they provide. A 3.5% share of annual fuel tax receipts is ring-fenced for the programme and accounts for nearly 90% of its funds. The government should further broaden the sources of finance for the PPSA, with a view to delinking its financial viability from fuel tax revenue, which is expected to decline with the progressive shift to electric transport.
Costa Rica has expanded its officially protected areas to cover 25% of land and 30% of marine areas, well above the respective OECD averages (Figure 4). An extensive network of biological corridors ensures connectivity. There is scope to improve the ecological representativeness, management and funding of protected areas. Entrance fees are a large source of finance, but they should be systematically reviewed to ensure cost recovery. The use of concessions for tourism-related services in protected areas should be extended and made more efficient, to provide additional revenues, improve quality of services and engage local communities.
and respective OECD averages of connectivity. There is scope to improve the ecological
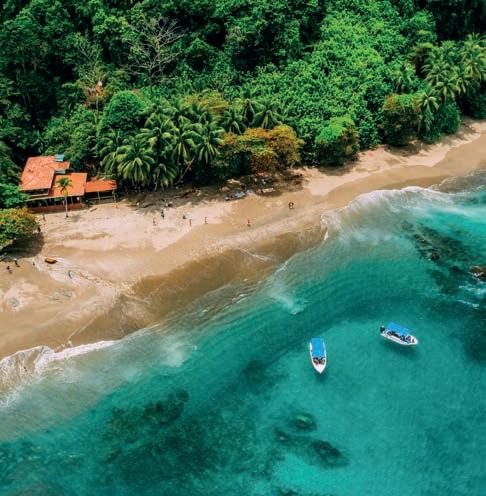
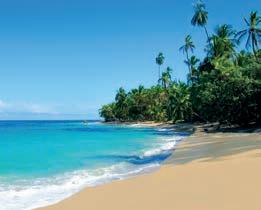
Natural protected areas have been a driver of Costa Rica’s success as tourist destination. However, massive tourist flows concentrated in a few months and areas have exerted pressures on ecosystems and species, within and outside the protected areas. Like other megadiverse tourism destinations, Costa Rica needs to balance the challenge of developing infrastructure with maintaining the integrity of ecosystems and their accessibility to the public. Several initiatives have sprung up to reduce the negative environmental impact of tourism development. These include voluntary certification and labelling schemes (Box 3).
Addressing tourism pressures primarily requires completing land-use planning and ensuring that territorial plans consider biodiversity. The lack of land-use and marine spatial plans has been an indirect driver of biodiversity loss, uncontrolled land conversion and illegal building development. It also exacerbates Costa Rica’s high vulnerability to climate-related natural hazards and pressures on coastal areas, which host much of the new tourism-related developments. As of July 2021, less than half of municipalities had regulatory plans, with most of them outdated, partial and without an environmental assessment. Some initiatives have been taken to complete spatial planning and mainstream biodiversity in it, but it is too early to appreciate their results.
Continuing to remove harmful subsidies is key to encourage sustainable agricultural and fishing practices. Support for agriculture and fishery producers has declined but remains largely linked to production levels or use of inputs, such as pesticides, fertilisers and fuel for fishing boats. This form of support can increase pressures on natural resources. It should be replaced with time-bound payments targeted to vulnerable producers, as well as to further encourage sustainable farming and fishing practices. The recent regulation on agrochemical risk assessment is a step to better control the environmental and health impact of intensive use of agrochemicals.
In 2017-19, 72% of travellers to Costa Rica visited the country to enjoy its beaches and 65% to engage in nature-based activities, especially in protected areas
the OECD (2020 data)

2022
Terrestrial protected areas

Total protected areas
CBD 2030 target
CBD 2020 target
Note: Data for Costa Rica come from national sources. They differ slightly from data reported in the database of OECD Environment Statistics, which shows 26% of terrestrial area and 28% of exclusive economic zone covered by protected areas in 2022. The CBD 2020 targets are 17% for terrestrial areas and 10% for marine areas. The CBD 2030 targets are 30% for both terrestrial and marine areas.
Source: OECD (2023), “Biodiversity: Protected areas”, OECD Environment Statistics (database), https://doi.org/10.1787/5fa661ce-en SINAC (2022), Áreas Silvestres Protegidas de Costa Rica (estadísticas).


At 8 kg per hectare of agricultural land, Costa Rica has the fourth highest intensity of pesticide use in
meeting
Costa Rica is strongly committed to meeting the Sustainable Development Goals. It has comprehensive environmental policy and legal framework and welldeveloped mechanisms of environmental democracy. It has shown continued commitment to aligning its legislation and practices with OECD standards.
Government investment in environmental protection hovered around 1% of total government investment in 2012-20
Fragmented governance, limited institutional capacity and resource constraints have hampered effective implementation. Human resources are insufficient to ensure adequate environmental planning, management and enforcement. Costa Rica should build on the 2022 bill that strengthens the environment ministry’s purview to streamline environmental governance. A welcome comprehensive reform of environmental assessment and permitting is ongoing. It should be swiftly completed and implemented to bring Costa Rica in line with OECD best practice. Collection and dissemination of environmental information have markedly improved. However, more work is needed to fill persistent information gaps – including on greenhouse gas (GHG) emissions, waste, air and water quality, and oceans – to inform decision making and engage citizens.
The financial and administrative capacity of local governments should be strengthened so they can
deliver quality environmental and mobility services. As in many countries, local governments are responsible for a wide range of environment-related matters – from land-use management to waste collection. Most local governments face difficulties in collecting taxes and service fees, whose revenue barely covers staff costs. Service quality and delivery vary greatly across municipalities and regions. The Greater Metropolitan Area lacks a metropolitan structure to co-ordinate the management of public urban services – such as public transport and waste management –across municipalities.
difficulties in collecting taxes and service
The transition to a green and decarbonised economy requires large-scale investment. There is a need to reallocate resources to address infrastructure gaps, ensure the climate resilience of physical assets and improve service delivery. The sheer scale of investment needs calls for improving the quality and efficiency of public management and spending, engaging the private sector, mobilising alternative sources of finance, strictly enforcing regulations and providing adequate incentives. Costa Rica can build on its environmental reputation and experience with conservation trust funds, debtfor-nature swaps, green bonds and REDD+ to attract international green finance.
Sustainable development and green growth are high on Costa Rica’s political agenda, but challenges lie ahead
Costa Rica could raise USD 136 million or 0.24% of GDP in tax revenues if it eliminated tax discounts on fossil fuels and other incentives that have a negative impact on the environment (2020 estimates)


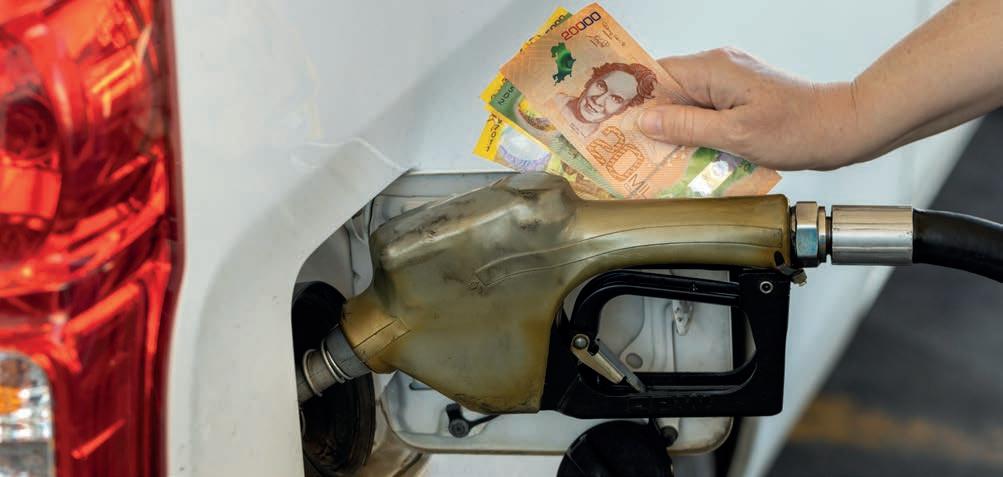
Implementing a green tax reform would help improve price signals and raise revenue for the green transition. At 10% of total tax revenue, environment-related taxes are an important source of fiscal revenue in Costa Rica, especially because of low proceeds from income taxes (Figure 5). Fuel taxes are higher than in many Latin American countries, but less than half of the country’s GHG emissions face fuel taxation (Figure 6). Costa Rica should adopt a green tax reform and carbon pricing, as commendably outlined in the National Decarbonisation Plan (Box 1). It should review taxes on fuels and vehicles to better reflect the social costs of their use
and encourage a shift towards cleaner vehicles and sustainable transport modes. It should also raise road tolls, which have been unchanged since 2002. Implementing congestion charges would help curb peak-time congestion in critical zones of the Greater Metropolitan Area in a cost-effective and socially fair manner. Well-targeted and transparent policies for using additional revenues from green taxes and charges will be key to improve social acceptability.

Many fiscal incentives have a negative impact on the environment and should be reformed. These include tax

Figure 5. Environment-related taxes raise significant revenue in Costa Rica Environment-related tax revenue as a share of GDP, by tax base, 2021

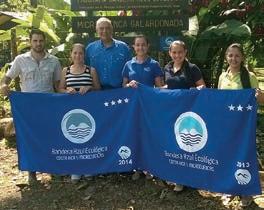
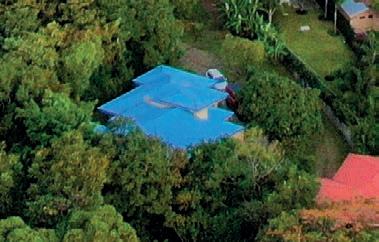
According to a survey by the Central Bank of Costa Rica, 65% of companies had some form of environmental certification in 2018-20, mostly under the Country Programme for Carbon Neutrality (PPCN) and the Ecological Blue Flag Programme. Since 2012, more than 200 companies, 21 municipalities and 2 districts have engaged in the PPCN. In 2019, around 400 private organisations were granted the Ecological Blue Flag certification. Costa Rica’s country brand Essential Costa Rica, in operation since 2013, also includes an environmental component, among several others. The Certification for Sustainable Tourism has helped position Costa Rica as a pioneer of ecological tourism. Other sector-specific labels and certifications include the Good Agricultural Practices Label, the Pura Vida label for sustainably caught and processed fish and seafood, and the Distintivo ABS for products using the country’s genetic resources. However, this multitude of certifications and labels risks creating confusion for customers and generating “greenwashing”.


discounts on oil used in aviation, fishing and construction, and liquefied petroleum gas used by households for cooking and heating. Costa Rica could build on the finance ministry’s regular stocktaking of tax expenditure to develop a subsidy reform plan. In 2022, as in other OECD
countries, the government provided various fuel tax reliefs to mitigate the impact of mounting energy prices. It also increased allowances for poorer households, which is a better way to shield the population most affected by rising living costs.
Figure 6. Fuel taxes cover 46% of Costa Rica’s GHG emissions – more than in many Latin American countries but still not enough
Share of GHG emissions subject to a positive net effective carbon rate, selected countries in Latin America and the Caribbean, 2021
(ECR)

MORE INFORMATION
OECD Environmental Performance Reviews: Costa Rica 2023
The report and all data are available on http://oe.cd/epr-costa-rica
Environmental Performance Review programme
http://oe.cd/epr

Find internationally comparable indicators
OECD Environment at a Glance: http://oe.cd/env-glance
CONTACTS
Report Co-ordinator
Ivana Capozza
Ivana.Capozza@oecd.org
Head of Division Nathalie Girouard
Nathalie.Girouard@oecd.org
Communications
Natasha Cline-Thomas Natasha.Cline-Thomas@oecd.org
IMAGE CREDITS
All images are from Shutterstock.com unless otherwise specified.
This document and any map herein are without prejudice to the status of or sovereignty over any territory, to the delimitation of international frontiers and boundaries and to the name of any territory, city or area.