United States 2023


KEY ENVIRONMENTAL INDICATORS 2021 (or latest available year)


Energy intensity – Total energy supply per capita
6.3 toe per capita (OECD average is 3.8)
The Organisation for Economic Co-operation and Development (OECD) provides its 38 member countries with a forum to work together to address the economic, social and environmental challenges of globalisation. The OECD is also at the forefront of efforts to help governments respond to new developments and concerns. The Organisation provides a setting where governments can compare policy experiences, seek answers to common problems, identify good practice and work to co-ordinate domestic and international policies.


The OECD Environmental Performance Reviews (EPRs) provide evidence-based analysis and assessment of countries’ progress towards their environmental policy objectives. They promote peer learning, enhance government accountability, and provide targeted recommendations to help countries improve their environmental performance. They are supported by a broad range of economic and environmental data. Over the last 30 years, the OECD has conducted over 100 EPRs of OECD members and selected non-member countries.
All reports, and more information, are available on the EPR website: http://oe.cd/epr.
This is the third EPR of the United States. The previous one took place in 2005. The EPR reviews the country’s environmental performance in the last decade. The process involved a constructive and mutually beneficial policy dialogue between the United States and the countries participating in the OECD Working Party on Environmental Performance (WPEP). The OECD is grateful to the two examining countries engaged in the multi-country assessment of marine litter: Japan and Indonesia.
The EPR provides 30 recommendations, approved by the WPEP on 13 April 2023. It aims to help the United States improve environmental performance, with a special focus on marine litter and a cross-cutting focus on environmental justice.
http://oe.cd/epr
Renewables (% of total energy supply)
8% (OECD average is 12)
GHG intensity – GHG emissions per capita
18 t CO2 eq. per capita (OECD average is 10.5)
Mean population exposure to PM2.5
8 μg/m3 (OECD average is 14)
Municipal waste per capita
811 kg per capita (OECD average is 534)
Material recovery of municipal waste
(% of composting and recycling in total treatment)
32.1% (OECD average is 34.9)
Material productivity
(USD, 2015 PPPs/Domestic material consumption, kg)
2.5 USD/kg (OECD average is 2.5)
Share of CO2 emissions priced above EUR 60/tCO2 (including emissions from biomass)
4.2% (2021, OECD average 14.0)
R&D budget for environment and energy
(% of total government R&D budget)
5.1% (OECD average is 6.1%)
Road vehicle stock
91 vehicles/100 inhabitants (OECD average 67)
The United States, the world’s largest economy, has made progress in reducing several environmental pressures while maintaining one of the highest gross domestic products (GDP) per capita in the world. It has decoupled emissions of greenhouse gases (GHGs), air pollutants, water abstractions and domestic material consumption from economic and population growth. However, high consumption levels, intensive agricultural practices, climate change and urban sprawl continue to put pressure on the natural environment. Despite the recent acceleration of action to address climate change, further efforts are needed to achieve the goal of net‑zero GHG emissions by 2050.
The United States is a major contributor to marine litter with serious consequences for communities and the environment. Municipal waste collection rates are high, but plastic recycling rates are low. The United States could use stronger policy instruments to address marine litter across the plastics life cycle and set clear and ambitious targets drawing inspiration from policies at subnational level and international experience.
UNITED STATES 2021 (or latest available year)
Population: 331 million
GDP per capita: USD 70 000 (current purchasing power parities) (OECD average is 49 000)
Total land area: 9 150 000 km2

Population density: 34 inhabitants/km2 (OECD average is 37)
Currency: USD 1.183 = EUR 1
* Note: rounded figures.
• Pursue further efforts to achieve national climate objectives, including mainstreaming climate considerations in infrastructure projects; require the infrastructure project permitting processes to apply an adequate estimate of the social costs of GHGs; mandate consideration of climate resilience in planning of all projects funded by the federal government.
• Support states, local authorities and Tribes to ensure consistent funding at subnational level to operate and maintain infrastructures after federally funded capital investments.
• Reinforce funding, training and technical assistance for asset management programmes for water utilities to better prioritise capital and operations and maintenance decisions; promote appropriate compensation measures to address affordability issues related to water tariffs in low income communities.
• Ensure the Environmental Protection Agency (EPA) and other federal agencies deploy sufficient resources to successfully implement the Infrastructure Investment and Jobs Act (IIJA) and Inflation Reduction Act (IRA) and overcome capacity challenges; provide co ordinated technical assistance in a coherent manner with other agencies’ programmes to support state and local entities, and Tribes.
• Enhance efforts to establish a dedicated co‑ordination body tasked with ongoing cross sectoral and interstate advisory capacity on infrastructure priorities and best practices by leveraging recent developments.

• Pursue further reform of the permitting processes for infrastructure to make it more efficient without compromising the review quality, especially for the inter jurisdictional transmission projects.
• Develop and implement robust accountability mechanisms for EJ; set quantitative time bound targets focusing on improving EJ outcomes; develop robust indicators to report on progress.
• Enhance transparency on progress related to EJ and equity objectives and targets through periodic public reporting, including tracking the allocation of funding.
• Improve consistency of national and state level environmental justice screening and mapping (EJSM) tools by standardising methodologies and definitions of indicators; continue to fill data gaps and develop indicators that reflect cumulative exposure to environmental risks and social vulnerability.
• Support development of state level and Tribal level EJSM tools to advance EJ for overburdened and underserved communities, as well as a national EJSM tool assessing cumulative impacts.
• Ensure that local communities and Tribes play a more active role in the conception, design and implementation of EJSM tools.
• Explore the need for new legislation to expand the authority of executive branch units to introduce additional policies to address marine litter and plastic pollution by supporting the scaling up of efforts in place at the subnational level.
• Develop a comprehensive national strategy and action plan to address marine litter with quantitative targets and a coherent policy mix to address the entire plastics life cycle.
• Establish indicators and comprehensive national monitoring systems for plastic production and use as well as for plastic pollution and fate of exported plastic waste, leveraging existing datasets.
• Enhance effectiveness and efficiency of the monitoring system through greater investment in emerging technologies, with a view to greater spatial and temporal monitoring of plastic waste both on land and at sea.
• Expand reporting from actors in the production and use stages of plastics life cycle.
MARINE LITTER: CLOSING LEAKAGE PATHWAYS

• Fund and support local infrastructure to close leakage pathways, increase funding for post leakage capture at municipal storm sewers, as well as for optimised screening at wastewater treatment plants.
• Expand EPA support for state governments to use the Clean Water Act to identify waters as impaired for trash and set “trash (Total Maximum Daily Loads) TMDLs”, coupled with federal funding for compliance measures.
• Support increased funding of water infrastructure in disadvantaged communities to discourage demand for bottled water while increasing safe and affordable drinking water access.
• Pursue stronger instruments at both the national and subnational levels to prevent litter, such as bans on some of the most frequently littered items and other regulatory and economic (e.g. taxes and charges) instruments; strengthen controls on US plastic waste exports.
• Target the entire life cycle of microplastics through regulatory or economic policy instruments.
• Develop medium and long term national targets for plastic recycling; monitor progress towards targets and report publicly.
• Increase financial and technical support for consumer education to reduce contamination of kerbside recycling.
• Consider implementing economic instruments to encourage waste sorting and recycling such as pay‑as you throw with differentiated fees, or deposit‑refund measures.
• Consider a federal law to harmonise extended producer responsibility for packaging or provide states with a model extended producer responsibility policy with various options such as modulated fees, as well as other guidance.
• Develop national standards for recycled content, including rigorous accounting methods for circular polymers, with definitions, terms and methods aligned for harmonisation, interoperability and broad adoption.
Some environmental pressures have been decoupled from economic growth. The United States (US) has made progress in decoupling emissions of GHGs, air pollutants, water abstractions and, more recently, domestic material consumption from economic and population growth. However, high consumption levels, intensive agricultural practices, climate change and urban sprawl continue to put pressure on the natural environment and human health. Since 2010, freshwater abstractions have decreased due to less water‑intensive industries and efficiency gains in water use. However, per capita total abstractions remain among the highest in the OECD. Water quality has improved, but issues remain. Overall, almost 70 000 water bodies nationwide do not meet water quality standards, and high nutrient levels persist, in particular excess phosphorous
Up to 10 million households connect to water supply through lead pipes and service lines, resulting in potential exposure to lead contamination.
capita and per GDP are among the highest in the OECD due to the dominance of fossil fuels in the energy mix. It has made progress towards its climate objectives, with a recent ramping up of ambition and acceleration of climate action. The government reaffirmed its commitment to strengthen implementation of the Paris Agreement under the United Nations Framework Convention on Climate Change. However, current policies are not sufficient to reach climate goals.
bodies nationwide do not meet water quality standards,
The United States has significantly raised ambitions on climate. The country’s gross GHG emissions per
Reaching climate goals requires further action. The government has set goals to reduce net GHG emissions by 50‑52% below 2005 levels in 2030 and net‑zero emissions by 2050 (Figure 1). Landmark climate legislation – the IRA – was passed in 2022. It provides at least USD 369 billion for investment in programmes aimed at tackling climate change. Nevertheless, additional actions will be required to reach the 2030 target and to keep the target of net zero by 2050 within reach.
– the IRA – was passed in 2022. It provides at least
Figure 1. The United States is making progress towards its climate goals, but additional actions are needed Past performance against climate objectives and indicative path to net zero
Note: Net greenhouse gas (GHG) emissions include those from the land use, land-use change and forestry sector. CO2 emissions: emissions from fossil fuel combustion, industrial processes (IPPU) and flaring (IEA projections). Dashed lines represent trajectories towards the Nationally Determined Contribution economy-wide reduction targets of reducing net GHG emissions by 50-52% below 2005 levels in 2030. Dotted lines refer to trajectories consistent with the IEA projections of the State Policy Scenario (STEP) that considers climate/ energy-related policies and measures already adopted by the US government.
Sources: IEA (2022), IEA World Energy Outlook 2022 (database); UNFCCC (2022), "National Greenhouse Gas Inventory.emissions by source”, OECD Environment Statistics (database); UNFCCC (2022), United States National GHG Inventory 2021.

The United States is pursuing a historic acceleration in infrastructure investment. Chronic underfunding of infrastructure investment contributed to the accelerated ageing of infrastructure generating a multitude of socio‑economic impacts. In addition, the impacts of climate change increase the need for resiliency. The 2021 IIJA provides the largest and most comprehensive funding for infrastructure in recent US history. Alongside the IRA, it will help close a significant portion of the US infrastructure funding gap by providing USD 1 200 billion, including about USD 550 billion for new projects (Figure 2).
investments, reliable funding capacity will be needed at local level to operate and maintain the infrastructure over operational lifetimes.
The IIJA represents the US’s single largest investment in water in recent history, with more than USD 50 billion to EPA to improve water infrastructure.
Massive infrastructure investments face capacity challenges. The scale of investments and their rapid deployment in a short timeframe (five years for the IIJA and ten years for the IRA) are expected to intensify competition in supply chains and the labour market. Moreover, after completion of capital
jurisdictions) collaboration. Infrastructure The scale of investments and
Careful governance and improved permitting processes are needed. Successful implementation of infrastructure investments requires robust cross‑sectoral (inter‑agency) and multi‑level (between federal, state, Tribal and local jurisdictions) collaboration. Infrastructure governance in the United States faces shortcomings, notably related to long‑ term strategic vision and ensuring efficient and effective procurement. The permitting process is a main factor behind the long duration of certain infrastructure projects. Further streamlining of the permitting process is needed without undermining the integrity of the process in order to meet time‑bound climate, environmental and social objectives and implement the vision of the IIJA and the IRA.
EPA Planned investment under the Bipartisan Infrastructure Investment Jobs Act

Note: IIJA = Infrastructure Investment and Jobs Act (Law N.117-58 also known as the Bipartisan Infrastructure Law). PFAS = Per- and polyfluoroalkyl substances. Left panel: Excluding amounts related to the Reauthorization of Existing Transportation Programs (about USD 650 billion).
Source: Government Finance Officers Association (2022), Infrastructure Investment and Jobs Act (IIJA) Implementation Resources, website; EPA (2022), Explore EPA’s Bipartisan Infrastructure


Environmentally related taxes are limited. Environmentally related taxes accounted for 0.7% of GDP in 2020 in the United States, which is the lowest among the G7 and lower than the OECD average of 1.4%. Energy and transport account for most environmentally related taxes. Excise taxes have recently been reinstated on certain chemicals and petroleum products. The IRA also authorised a new methane fee.
significantly from 2012 to 2021, they are still insufficient to achieve full cost recovery.


The United States was the most proli c source of green bonds in 2021, 50% larger than the next largest country (the People’s Republic of China).


banking


Other economic instruments are common in a number of domains. For instance, tradeable permit systems for biodiversity are particularly common in the United States. National mitigation banking is the largest and growing environmental restoration programme in the country, contributing to water resource management and biodiversity objectives. Water and wastewater tariffs help recover some of the costs of water services. Although tariffs increased
modifies and extends tax credits to further

In addition, the Act provides funding to the EPA
Expanded tax credits are set to further spur green investment. Although only one‑third of GHG emissions is subject to a positive carbon price, the United States has considerable experience with a variety of tax incentives to mobilise private capital for investment in renewable energy. Over 2010 to 2020, renewable energy showed strong growth in the United States, driven by solar photovoltaic and wind (Figure 3). The IRA modifies and extends tax credits to further mobilise investment in renewable energy. In addition, the Act provides funding to the EPA to establish a Greenhouse Gas Reduction Fund grant programme, a portion of which will be used to capitalise financing entities to deploy funds for projects that reduce air pollution.
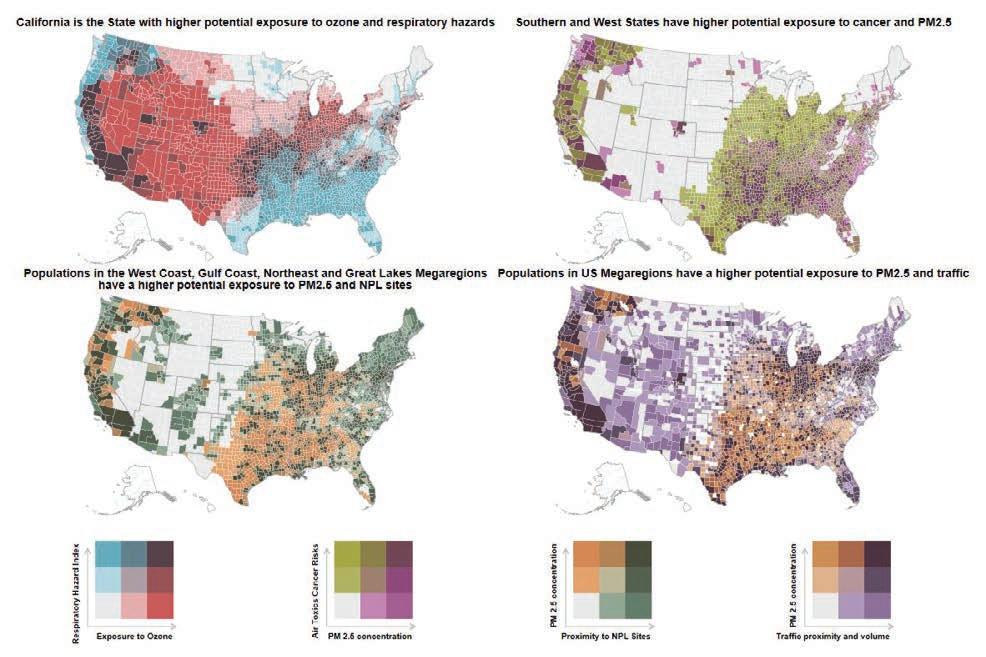
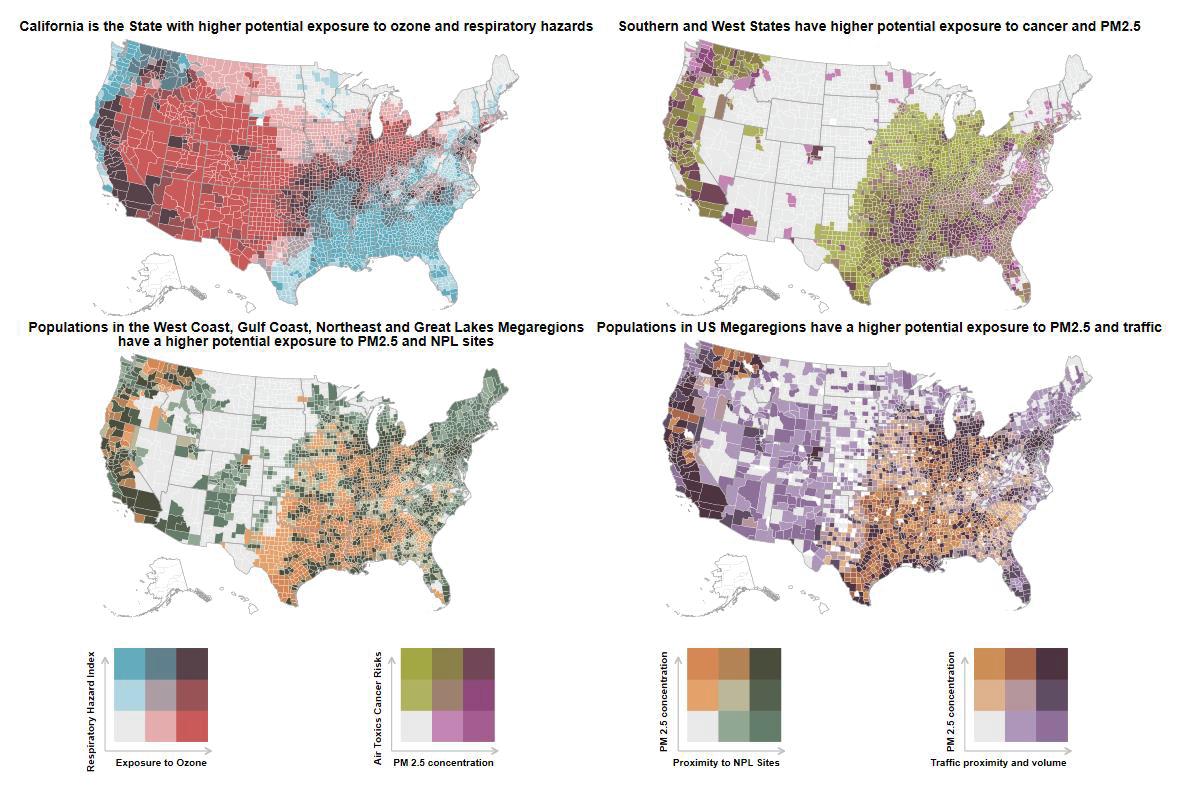
Uneven distribution of environmental burdens in the United States calls for accelerated action on EJ. Decades of research have established that low income households, Indigenous communities and people of colour in the United States are disproportionately exposed to pollution and other environmental risks. The uneven distribution of exposure to potential environmental harms, such as air pollution, can be illustrated with data from the EPA’s Environmental Justice Screening and Mapping tool (EJScreen) (Figure 4). Despite overall declines in air pollution, racial ethnic and socio economic disparities in exposure to such pollution have persisted.


disadvantaged communities, as well as the creation of the Office of Environmental Justice and External Civil Rights within the EPA. Ensuring that benefits are targeted to the most overburdened and disadvantaged communities is critical to achieving EJ goals. However, there are multiple challenges inherent in identifying and defining such communities.
EJ screening and mapping tools are powerful means to identify areas for further action. The EPA’s EJScreen and the Climate and Economic Justice Screening Tool developed by the White House Council on Environmental Quality are key examples. Nevertheless, to date, there has been no consistent approach to


TRENDS
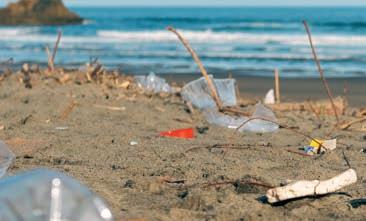
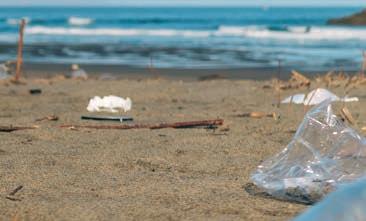
The United States is a major contributor to marine litter globally. Marine litter, comprised mainly of plastic, is a pressing global issue. Global plastic production, consumption and waste have increased exponentially since the middle of the 20th century. Plastic use in the United States has been increasing over time, doubling between 1990 and 2019. The growth in plastic production, use and waste has led to increasing volumes being mismanaged and leaking into the environment, which can result in marine litter. This can lead to the contamination of freshwater systems; entanglement of, or ingestion by, various forms of marine life; and other serious consequences for society and the environment. In 2019, the United States was the top generator of plastic

waste globally in total volume and per capita. US sources of plastic waste leakage into the environment include mismanagement of waste domestically and by trading partners.
Municipal waste collection rates are high, but plastic recycling rates are low. Waste collection rates in the United States are high, similar to other OECD countries. In 2018, it landfilled half of its municipal solid waste and recycled almost a quarter of it. However, of the total plastic waste (comprised of municipal solid waste, as well as waste from industry, including building and construction), an estimated 4% was recycled in 2019, lagging behind other countries (Figure 5).
Figure 5. Plastic recycling rates in the United States are low compared to other OECD countries Recycling rates of plastic waste, 2019 and 2019-20 growth rates, percentages
US recycling is heterogenous, complex and not cost competitive with primary plastic. Local recycling programmes commonly face challenges of contamination, low collection and limited kerbside pick up. Virgin plastic prices remain low compared to recycled material. Landfill disposal costs are often low, which does not incentivise material recovery. The EPA’s National Recycling Strategy is a positive step forward, with a goal to more than double the national recycling rate of municipal solid waste to 50% by 2030. Achieving higher rates of plastics recycling will likely require new policies to improve economic incentives for recycling.
Federal investments in research to address marine litter have been significant, yet an integrated monitoring system is lacking. Funding has supported research through grants and partnerships with subnational governments and stakeholders, as well as developing standardised protocols for reporting. For instance, the EPA Trash Free Waters Program has developed the Escaped Trash Assessment Protocol that considers site conditions, material types and item types. The National Oceanic and Atmospheric Administration’s Marine Debris Monitoring and Assessment Project surveys and records the amount and types of marine debris and litter on shorelines. However, there is no comprehensive national monitoring system for plastic production and use or plastic pollution, including waste production and leakage. Lack of well‑integrated marine litter datasets impedes tracking the effectiveness of policy responses.
Indonesia and Japan take different policy approaches to marine litter issues, although with some shared features such as setting national action plans and targets addressing the issue. Indonesia focuses on closing leakage pathways by providing funding and information to local governments and programmes to increase handling of waste. In contrast, Japan has a more comprehensive and varied approach, leveraging a mix of steering and enabling instruments. These incentivise the recycling industry as a growth opportunity and encourage development of bioplastic alternatives. These international experiences could inspire US policy to address marine litter in a more effective way.
The United States has made important advances to develop legislation to address marine litter. The 2006 Marine Debris Act updated most recently as the Save Our Seas 2.0 Act provides the core of the government’s response to marine litter. Most federal policies focus on provision of financial assistance and information to subnational governments, which have generally adopted more regulations and economic instruments. At federal level, there is no use of economic instruments, such as landfill fees and taxes, and pay as you throw and extended producer responsibility measures.
The US policy response to address marine plastic and litter has several gaps. Clear and ambitious targets on marine litter are lacking. In this respect, the United States lags behind other OECD countries. National targets to reduce single use plastics and to use recycled content, among others, could help put the country on an advantageous path to reduce the impacts of plastic pollution. Almost all federal policy instruments are enabling instruments with lower levels of compulsion. Most of these are focused on macroplastic leakage from mismanaged waste or litter.
The US response could include stronger instruments to address marine litter across the plastics life cycle. For example, the United States could apply a national ban on some of the most frequently littered items. Regulations and economic instruments could target the production, use and end of life stages of the macro and microplastics life cycle. These include extended producer responsibility, regulatory standards, tariffs or taxes, or labelling. Federally driven policy, co ordination and harmonisation could reduce risk of fragmentation of producer requirements stemming from the proliferation of initiatives at the subnational level.
EJ and equity considerations should be more systematically considered in the context of marine litter. The understanding of EJ implications of marine litter and related policy responses is limited to date. The federal government should analyse these EJ implications, systematically advance the mainstreaming of EJ considerations and establish clear commitments on EJ in the context of marine litter. Measuring progress towards those commitments will require effective tracking, monitoring and public reporting on progress at all stages of the plastic life cycle.
MORE INFORMATION
OECD Environmental Performance Reviews: United States 2023
The report and all data are available on http://oe.cd/epr-us
Environmental Performance Review programme
http://oe.cd/epr
Find internationally comparable indicators and country profiles on OECD Environment at a Glance: http://oe.cd/env-glance

CONTACTS
Head of Division
Nathalie Girouard
Nathalie.Girouard@oecd.org
Report Co-ordinator
Kathleen Dominique
Kathleen.Dominique@oecd.org
Communications
Natasha Cline-Thomas
Natasha.Cline-Thomas@oecd.org
@OECD_ENV
OECD Environment on LinkedIn
IMAGE CREDITS
All images are from Shutterstock.com unless otherwise specified. This document and any map herein are without prejudice to the status of or sovereignty over any territory, to the delimitation of international frontiers and boundaries and to the name of any territory, city or area.
The statistical data for Israel are supplied by and under the responsibility of the relevant Israeli authorities. The use of such data by the OECD is without prejudice to the status of the Golan Heights, East Jerusalem and Israeli settlements in the West Bank under the terms of international law.