Global trade in plastic waste and scrap is declining
Annual reported global export volume of plastic scrap and waste declined by almost half (49%) over the past six years, from around 12.4 million metric tonnes (megatonnes, Mt) in 2017 to 6.3 Mt in 2022. The decrease was slightly steeper between 2021 and 2022 compared to 2020 and 2021. Global export volumes declined by 4.9% between 2021 and 2022 (6.7 Mt to 6.3 Mt) compared with a 1.9% decrease between 2020 and 2021 (6.8 Mt to 6.7 Mt). The share of trade among OECD member countries grew, especially within geographic regions. For example, trade within Europe and North America now makes a larger share than exports from these regions to other parts of the world.
FIGURE 2. Global plastic waste and scrap by export destination type
Reported annual export volume of HS 3915 (Waste, parings and scrap, of plastics) by destination type (2017-2022)
4 OECD POLICY HIGHLIGHTS Monitoring trade in plastic waste and scrap | © OECD 2024
0 2 4 6 8 10 12 14 2017 2018 2019 2020 2021 2022 Megatonnes Rest of World Other Asia (Not OECD) North America Korea Japan Europe Hong Kong China
Source: Authors’ own based on UN Comtrade.
OECD countries and Southeast Asian countries are key export destinations
For several decades, most of the global trade in plastic waste and scrap was exported to China. Trade patterns shifted when China adopted unilateral controls on its imports in 2017. Initially, South and Southeast Asian countries became key export destinations. Additionally, several OECD countries in Europe have also become key export destinations.
The Netherlands, Germany and Belgium were some of the largest importers of plastic waste and scrap in 2022. These countries were also some of the largest importers in 2021. These countries benefit from access to the EU’s regional trade agreement and the Netherlands and Belgium host ports suitable for transhipments.
Türkiye experienced a large decrease in imports (in absolute volume) from 2021 to 2022. This may be due to its introduction of unilateral controls on imports.
Non-OECD countries in South and Southeast Asia continue to receive large volumes. Malaysia was the second largest export destination in 2022. Viet Nam was fourth. Indonesia was tenth. Notably, Indonesia saw a 26% increase in imports in 2022 compared to 2021. Japan, the United States, the Netherlands and Germany were the OECD countries that exported the largest volumes to non-OECD countries.
FIGURE 3. Key importers of plastic waste and scrap globally
Reported annual export volume of HS 3915 (Waste, parings and scrap, of plastics) volume destined to key importers
Note: Blue = OECD countries; Yellow = non-OECD countries; Other Asia, nes (“not elsewhere specified”) includes, inter alia, exports to Chinese Taipei.
Source: Authors’ own based on UN Comtrade.
OECD POLICY HIGHLIGHTS Monitoring trade in plastic waste and scrap | © OECD 2024 5 0 0.1 0.2 0.3 0.4 0.5 0.6 0.7 NetherlandsMalaysiaGermanyVietNam TürkiyeBelgium Spain USA PolandIndonesia Italy France AustriaOtherAsia,nes CanadaUnitedKingdomSlovenia MexicoLithuaniaThailand
2021 2022
Megatonnes
Key findings
OECD countries are transitioning from export dependence to a balance of trade
The trade deficit between exports and imports of plastic waste and scrap by OECD member countries nearly disappeared and amounted to only 0.2 Mt in 2022. OECD countries accounted for 87% of total global exports and 77% of total global imports.
The share of OECD exports in total global volume remained largely stable between 2021 and 2022 at around 87%. The OECD’s role as importer grew by 7% (from 70% to 77%). Absolute volumes mirrored this trend, in which OECD exports decreased by 0.2 Mt (or by 4%), reaching 5.5 Mt in 2022, in line with global trends, while OECD imports grew by 0.5 Mt to a total of 5.3 Mt.
FIGURE 4. OECD export and import developments and their share in global trade
Annual import and export of HS 3915 (Waste, parings and scrap, of plastics) reported by OECD member countries (net volume and share of global volume)


6 OECD POLICY HIGHLIGHTS Monitoring trade in plastic waste and scrap | © OECD 2024
0% 10% 20% 30% 40% 50% 60% 70% 80% 90% 100% 0 1 2 3 4 5 6 7 8 9 10 2017 2018 2019 2020 2021 2022 Megatonnes OECD Exports OECD Imports Exports % of global Imports % of global
Source: Authors’ own based on UN Comtrade.
The value per volume of exports from OECD to non-OECD countries is consistently lower than trade between OECD countries
Countries report both the volume of trade and the value of the material exported to each trade partner. The OECD evaluates trends in the quality of traded plastic waste by examining the reported value per kilogram.
Reported value per weight tends to co-vary with overall price fluctuation in primary equivalent material commodity markets. The trade value increases from 2021 to mid-2022 largely co-vary with increases in commodity and resin prices. During the second half of 2022, commodity prices and the value of scrap trade jointly declined.
Based on this metric, intra-OECD trade (0.69 USD/kg) and OECD to non-OECD trade (0.55 USD/kg) reached six-year highs in early 2022. The values converged, but trade within the OECD was consistently at a higher value for most of the observed period.
FIGURE 5. Trade value per volume of exports of plastic waste and scrap by OECD member countries
Value (USD) per volume (kg) of trade between OECD member countries and exports to non-members (2017-2022 and preliminary data from January to November 2022)
OECD to OECD OECD to Non-OECD
2017-01-012017-05-012017-09-012018-01-012018-05-012018-09-012019-01-012019-05-012019-09-012020-01-012020-05-012020-09-012021-01-012021-05-012021-09-012022-01-012022-05-012022-09-01 USD/Kg
Source: Authors’ own based on UN Comtrade.
OECD POLICY HIGHLIGHTS Monitoring trade in plastic waste and scrap | © OECD 2024 7
0 0.1 0.2 0.3 0.4 0.5 0.6 0.7 0.8 0.9 1.0
Key findings
The composition of plastic waste traded is not substantially changing
Countries report trade at a more detailed level, known as six-digit HS codes. These codes enable analysis on the composition of waste trade. From 2021 to 2022:
l The share of trade in ethylene polymers (HS 391510) decreased marginally by one percentage point, and
l The share of “styrene polymers” (HS 391520) increased by one percent.
Exports of “vinyl chloride polymers” (HS 391530) are subject to Basel controls that require prior informed consent. The share of this trade has fallen and is mostly traded among OECD and EU countries. Some OECD exports to non-OECD countries reportedly persist, as do exports to countries that are subject to the Basel Ban amendment and to whom exports have in theory been banned since 2021.
8 OECD POLICY HIGHLIGHTS Monitoring trade in plastic waste and scrap | © OECD 2024
Annual reported export volume by OECD member countries of 6-digit codes of HS 3915 (left) and shares of each 6-digit HS code of total OECD exports (right) (2017-2022)
Note: Romania is an EU Member State and therefore not subject to the Basel Ban Amendment. Other Asia, nes (“not elsewhere specified”) includes, inter alia, exports to Chinese Taipei.
Source: Authors’ own based on UN Comtrade.
OECD POLICY HIGHLIGHTS Monitoring trade in plastic waste and scrap | © OECD 2024 9
FIGURE 6. OECD plastic waste and scrap exports by commodity type
OECD export of vinyl scrap
3.66 2.95 2.62 2.67 2.70 2.61 0.39 0.34 0.35 0.35 0.30 0.33 0.39 0.35 0.26 0.25 0.20 0.19 4.52 3.63 3.35 2.92 2.72 2.67 0 1 2 3 4 5 6 7 8 9 10 Megatonnes 391510 Ethylene polymers 391520 Styrene polymers 391530 Vinyl chloride polymers 391590 Plastics (not elsewhere classified) 41% 41% 40% 43% 46% 45% 4% 5% 5% 6% 5% 6% 4% 5% 4% 4% 3% 3% 50% 50% 51% 47% 46% 46% 0% 10% 20% 30% 40% 50% 60% 70% 80% 90% 100% 2017 2018 2019 2020 2021 2022 2017 2018 2019 2020 2021 2022 0 0.05 0.1 0.15 0.2 0.25 0.3 0.35 0.4 0.45 2017 2018 2019 2020 2021 2022 Megatonnes Non-OECD OECD 7.1 6.1 1.1 0.8 0.8 0 1 2 3 4 5 6 7 8 Romania* Other Asia, nes Malaysia India Pakistan Thousands of tonnes
Key findings
The reported share of plastics subject to prior informed consent is small
While countries report all plastic waste and scrap trade to UN Comtrade, they need to only report waste subject to the prior informed consent (PIC) procedure in national reports to the Basel Convention Secretariat. With new plastic waste controls under Basel since 2021, countries should be reporting data about trade in plastic waste subject to PIC in their 2021 and 2022 national submissions to the Convention. However, taking a look at data reported by Basel parties for 2021, the total amount of plastic waste exported by OECD countries subject to the PIC procedure amounted to only 17 193 tonnes, compared to 5.21 Mt reported under UN Comtrade. This suggests that OECD countries are not yet systematically reporting the plastics waste trade subject to PIC procedure to the Basel Convention Secretariat.
Some plastic waste and scrap is likely traded as fuel
National governments and environmental non-governmental organisations have raised concerns that the reported trade in HS code 3915 (plastic waste and scrap) does not include all trade in plastic waste. Additional trade could include waste containing plastic that is transformed into a “fuel” via mechanical and chemical processing and subsequently shipped as Processed Engineered Fuel (PEF) or Refuse-Derived Fuels (RDF), broadly categorised under HS 3825. Trade volumes of HS 3825 increased in 2021, largely fuelled by non-EU OECD European countries to OECD EU countries. This trade occurred in the wider context of increasing capacity development for waste-to -energy facilities. This trade is legal and not subject to the recent international controls.
1. The volume of OECD exports, excluding the United States which is not a party to the Basel Convention.
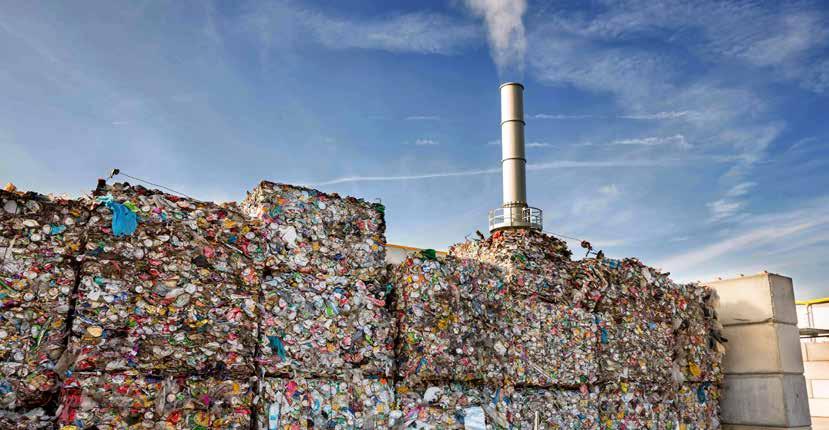
Additional trade could include waste containing plastic that is transformed into a “fuel” via mechanical and chemical processing and subsequently shipped as Processed Engineered Fuel (PEF) or Refuse-Derived Fuels (RDF)
10 OECD POLICY HIGHLIGHTS Monitoring trade in plastic waste and scrap | © OECD 2024
Conclusions
Recycling is a key method for addressing plastics leakage and maintaining material value. Trade in plastic waste and scrap enables the movement of material to markets with a comparative advantage, which helps to strengthen plastics recycling markets.
In some cases, plastic waste imported to low- and middle- income countries has been overwhelming. Countries in Southeast Asia became major export destinations quickly after China introduced tight control measures in 2017. In some cases, this surge in plastic waste imports has led to environmental impacts.
Since 2017, trade volumes decreased and in 2022 this trend continued, while regional trade grew in importance. Meanwhile, trade between countries in the OECD is increasing as a share of global trade and this trade continues to be of higher value per weight.
National reporting by countries to the Basel Secretariat could provide more detailed information about trade flows of plastic waste subject to PIC, but this data is to-date still underreported.
Finally, trade patterns in related commodities, such as processed engineered fuels, have not drastically changed after the introduction of international controls. These data suggest that there is no evidence that substantial amounts of plastic waste are traded under the guise of other materials or commodity codes.
Further Reading

Brown, A., F. Laubinger and P. Börkey (2023), “Monitoring trade in plastic waste and scrap”, OECD Environment Working Papers, No. 210, OECD Publishing, Paris, https://doi.org/10.1787/39058031-en.
Brown, A., F. Laubinger and P. Börkey (2022), “Monitoring trade in plastic waste and scrap”, OECD Environment Working Papers, No. 194, OECD Publishing, Paris, https://doi.org/10.1787/8f3e9c56-en.
OECD (2023), Interim Findings: Towards Eliminating Plastic Pollution by 2040: A Policy Scenario Analysis, https://www.oecd.org/environment/plastics/Interim-Findings-Towards-Eliminating-Plastic-Pollution-by-2040-PolicyScenario-Analysis.pdf
OECD (2022), Global Plastics Outlook: Economic Drivers, Environmental Impacts and Policy Options, OECD Publishing, Paris, https://doi.org/10.1787/de747aef-en
OECD (2022), Global Plastics Outlook: Policy Scenarios to 2060, OECD Publishing, Paris, https://doi.org/10.1787/aa1edf33-en
OECD POLICY HIGHLIGHTS Monitoring trade in plastic waste and scrap | © OECD 2024 11
Key findings
Trade in plastics waste can enable recycling if countries ensure minimum material quality, and environmental and working conditions. The OECD publishes annual monitoring reports to track trends in international trade of plastic waste and its evolution over time. From 2021, countries have sought to enhance control on this trade by implementing international standards for quality and prior informed consent requirements on some previously commonly traded plastics.
These Policy Highlights provide an overview of trends in international trade of plastic waste and scrap, drawing on the 2024 OECD Environment Working Paper Monitoring trade in plastic waste and scrap. The 2024 paper is the fourth in a series of monitoring reports to assess the impact of new international controls on plastic waste and scrap. Through an analysis of new annual data for 2022, the paper offers insights about the medium to long term impacts of the new controls for plastic waste shipments. More broadly, the working paper maps global and regional changes in plastic waste and scrap trade, the value and composition of plastic waste and scrap exports and the share of plastics subject to prior informed consent.
Readers are encouraged to explore the full paper:
Park, B., et al. (2024), “Monitoring trade in plastic waste and scrap”, OECD Environment Working Papers, No. 233, OECD Publishing, Paris, https://doi.org/10.1787/013bcfdd-en.
CONTACTS
Shardul Agrawala, Head of the Environment and Economy Integration Division:
Shardul.AGRAWALA@oecd.org
Peter Börkey, Circular Economy Lead, EEI Division:
Peter.BORKEY@oecd.org
Andrew Brown, Junior Environmental Policy Analyst, EEI Division:
Andrew.BROWN@oecd.org
Frithjof Laubinger, Environmental Economist, EEI Division:
Frithjof.LAUBINGER@oecd.org
For more information:
www.oecd.org/environment/plastics
www.oecd.org/environment/waste/
@OECD_ENV
OECD Environment
OECD Environment Directorate, April 2024
12 OECD POLICY HIGHLIGHTS
| © OECD 2024
Monitoring trade in plastic waste and scrap


