

Decoupling trends, 2010 21

Note: GDP = gross domestic product. GHGs = greenhouse gases. LULUCF = land use, land-use change and forestry. DMC = domestic material consumption. SOx = sulphur oxides. NOx = nitrogen oxides. PM2.5 = fine particulates. SOX as SO2 (sulphur dioxide) and NOx as NO2 (nitrogen dioxide).
Source: SNI Chile (2022), Inventario Nacional de Gases a Efecto Invernadero Chile 1990-2020; RETC, Emisiones al Aire deTransporte en Ruta 2010-21; IEA (2023), IEA World Energy Statistics and Balances (database); OECD (2022), OECD Economic Outlook (database); OECD (2023), Environment Statistics (database).

aims for net zero by 2050, while GHG emissions continued to rise
Historical GHG emissions, targets, projections and indicative pathways to targets, 1990-2050

appropriate mitigation actions. NDC = nationally determined contribution. NDC targets are based on total GHG emissions excluding LULUCF. Chile proposed to undertake NAMAs to achieve a 20% reduction in GHG emissions (including LULUCF) from BAU levels by 2020. The 2020 GHG emissions target was an estimated 122 Mt CO2e, excluding emissions and sinks from LULUCF. The transition scenarios reflect sectoral budgets needed to meet targets.
Source: SNI Chile (2022), Inventario Nacional de Gases a Efecto Invernadero Chile 1990-2020; Gobierno de Chile (2022), 5to Informe Bienal de Actualización ante la Convención Marco de las Naciones Unidas sobre Cambio Climático

Percentage of terrestrial and marine protected areas, 2022 or latest available year

targets are 30% for both terrestrial and marine areas.
Source: OECD (2023), Biodiversity: Protected areas, Environment Statistics (database). SIMBIO (2024), Registro Nacional de Áreas Protegidas, https://simbio.mma.gob.cl/Indicadores.


Note: Landfill disposal corresponds to controlled landfilling.
Source: OECD (2023), "Municipal waste, generation and treatment", OECD Environment Statistics (database).

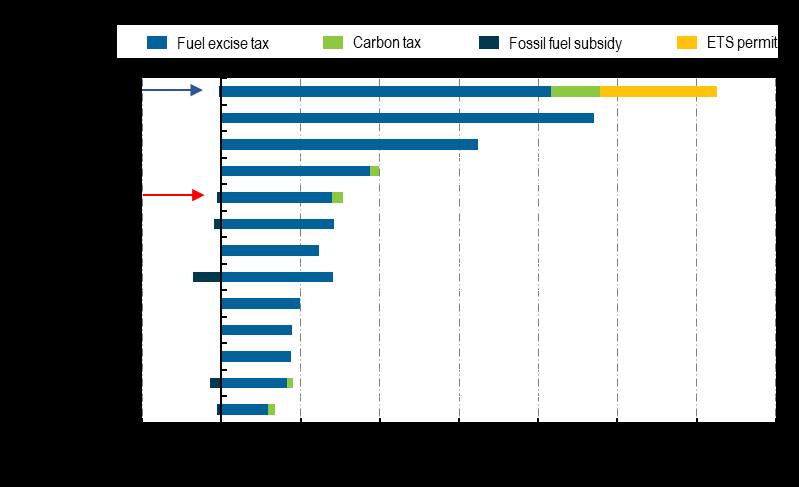
Net effective carbon rates in selected LAC countries and OECD average, 2021

Note: ETS = emissions trading system. Fossil fuel subsidy refers to budgetary transfers that decrease pre-tax prices for domestic fossil fuel use. ETS coverage estimates are based on the OECD’s (2021), Effective Carbon Rates 2021, with adjustments to account for recent coverage changes. Source: OECD (2022), Pricing Greenhouse Gas Emissions: Turning Climate Targets into Climate Action, OECD Series on Carbon Pricing and Energy Taxation, OECD Publishing, Paris.


Note: Left panel: SHAC = sector hidrogeológico de aprovechamiento común (hydrogeological sector of common use), a body of groundwater that can be defined and managed as a unit Sustainable volume: annual amount of water associated with the recharge of the aquifer. Total committed: amount of water that corresponds to all constituted and recognised water rights. Total requested: annual amount of water that corresponds to all applications for water rights, both resolved and pending Data are underestimated Right panel: MEE = monitoring effective extractions Data are available as of May 2023 Values are provisional Total works reporting considered works reporting online Regions of Aysen and Magallenes are not registered for groundwater.
Source: DGA (2016), Atlas del Agua, Chapter 4, pg 116; SINIA (2023), Monitoreo de Extracciones Efectivas

Number

Note: Water scarcity zones can be decreed in those areas with an extraordinary drought, defined according to hydrometeorological criteria (i.e. based on data on precipitation, river flows, reservoir volumes and aquifer conditions). Regions decree water scarcity zones, which can encompass multiple provinces and municipalities. Source: DGA (2023), Planilla Decretos Zonas de Escasez Hídrica (2008-2023) https://dga.mop.gob.cl/administracionrecursoshidricos/decretosZonasEscasez/Paginas/default.aspx (accessed 17 August 2023).

Pollution emissions to water bodies, 2020

Note Panel A: The region Arica and Parinacota pollutant emissions to water correspond to 577 74 tonnes in oceans
Source: SINIA (2022), Medio Ambiente y el Impacto de la Actividad Antrópica: Contaminación, Reporte del Estado del Medio Ambiente 2022.

Further reforms of water allocation are needed to manage water resources sustainably
• Water allocation in Chile
– Rights to use water defined as private property, allocated free of charge, granted in perpetuity
– Over-allocation depletes surface water and groundwater
– Minimum environmental flows are not secured
• 2022 reform to the Water Code
– Enshrines priority of supply for human consumption
– New rights are temporary and granted through a concession


•
Strengthening strategic water resources planning
– Strategic Water Resources Management Plans for all basins are under development
• Strengthening water governance
– 16 pilot organisations for river basin governance


Contacts
Head of Division: Nathalie Girouard Nathalie.Girouard@oecd.org
Report Co-ordinator: Kathleen Dominique Kathleen.Dominique@oecd.org
Communications: Natasha Cline-Thomas Natasha.Cline-Thomas@oecd.org