Some regions have struggled to recover from the pandemic…
More than two years after the pandemic first started, employment had recovered in many but not all regions. Even though national unemployment rates were largely at or below pre-COVID levels by June 2022, only half of OECD regions had reached pre-pandemic employment levels. Still, women and youth continue to struggle more in the labour market compared to other demographic groups, especially in regions
with high unemployment rates. The employment rate among women is 12 pp lower than among men in the median region. Lower participation in the labour market (i.e. having a job or actively looking for it) account for a significant share of the shortfall in women’s employment.
Employment has recovered in half of OECD regions
Employed as a percent of working-age adult population: Ratio of 2022 Q2 over 2019 Q2 values
0.8 1.0 1.2
Colombia Chile Costa Rica Switzerland Czech Republic United Kingdom United States Portugal Israel Canada Belgium Latvia Italia Austria Japan Sweden New Zealand Slovenia Spain Luxembourg Korea Estonia Denmark Australia Poland Finland Slovakia Hungary Ireland Greece
Ratio
National average Regional value
- 4 -
Surging energy prices are being felt unevenly across places. Many businesses now face higher costs of production. Energy-intensive industries, and in particular those that rely on natural gas and

fuel imports are most exposed to these shocks. Certain regions in Central Europe, Northern Italy, Sweden and Finland have the highest shares of employment in energy-intensive industries.
Regions with colder climates need more energy for heating Heating Degree Days (HDDs) with reference temperature 15°C, 2010-18, OECD large regions (TL2)
Regional values
National average
- 5 -
…and are now also facing higher energy prices
Heating is the largest source of residential energy consumption (over 60% on average in OECD countries) and natural gas is the leading energy source for household heating. In cold climates, heating is a considerable expense especially for poorer households. Heating and cooling needs can be very different within the same country. In Italy, for example, the Aosta Valley region and the province of Bolzano-Bozen have at least four times more heating needs than Sicily, Apulia, and Sardinia.
While in the short-term heating is the main problem, in the medium to long-term it is the heat stress resulting from global warming. In nearly
all OECD regions, over the past five years people experienced an increase in high temperatures relative to the prior three decades. The increases were especially large in hot climates such as Central America and many Mediterranean countries. In Costa Rica and Israel, the number of strong or extreme heat stress days (>32°C UTCI) increased by nearly a month per year on average. Residents of cities are more affected by heat waves due to the “urban heat island effect”. Recently, daytime temperatures in half of OECD cities were 3°C higher than in the surrounding areas during the summer.
What is the urban heat island effect?
It refers to the temperature difference between urban and non-urban areas with similar elevations. Temperatures tend to be higher in cities for a number of reasons including: presence and proximity of tall buildings, concrete and asphalt surfaces, heat generated from transport and other human activities, and the limited amount of vegetation in cities.
Although recent investments in digital infrastructure have somewhat reduced regional digital divides, many regions are still lagging behind. One-fourth or more of the population lacks access to broadband Internet in some regions in Chile, Costa Rica, Israel, Japan, Mexico
and the United States. Even when the Internet is available, its speed is still 40% lower outside metropolitan areas than within them.
- 6 -
Households are also affected by surging energy prices, especially in regions with higher heating needs in winter or more heat stress in summer.
Rural areas could slip further behind during the digital transition due to poor infrastructure and digital skills…
Average internet speed by degree of urbanisation, 2022 Q2
Metropolitan regions Regions near a metropolitan area Regions far from a metropolitan area
Percentage deviation from the OECD average 40% -40% -80%
0%
IcelandChileKoreaDenmarkLuxembourg SpainUnitedStates NorwayFranceSwitzerlandNetherlandsHungarySwedenNewZealandCanadaJapanPortugalFinlandPolandIrelandGermany SlovakiaLituaniaItalia LatviaSloveniaEstoniaBelgiumUnitedKingdomCzechRepublicAustriaAustraliaColombiaGreeceTürkiyeMexico
Digital skills are also lower in rural places. The share of people with basic or above basic digital skills in rural areas is less than half of that in cities.
Cities and metropolitan areas were able to adapt faster to remote working. In Europe, the share of remote workers during COVID increased by 70% in rural areas, but it increased by much more in cities – nearly tripling pre-pandemic rates. Behind such differences are better digital infrastructure, more occupations suited to remote work, and better digital skills in cities and metropolitan areas compared to other places.

- 7 -
…missing out on the potential for increased remote working, among other benefits
Share of workers (% ) 2019 2020
When the pandemic hit, remote work rose fastest in cities Share of European workers that work mainly in remote (%), by degree of urbanisation 0 2 4 6 8 10 12 14 16 18

Cities Towns and semi dense areas Rural areas
In the years prior to 2020, city centers had typically experienced the fastest increase in housing prices. However, this situation has inversed as with COVID-19 and the rise of teleworking, house prices have been growing faster in the suburbs relative to the central neighbourhoods of cities. From early 2020 to mid-2021, house prices
increased by more than 12% in areas farther away from the city centres (60km and more) compared to 7% in central neighbourhoods. Nevertheless, buying a house in the city centre of OECD metropolitan areas is still 30% more expensive than in the suburbs.
The sudden rise of remote working has increased the acceptable distance between home and job locations, with effects on housing demand
Since the pandemic, house prices have been growing fastest in the suburbs Small area units (SAU) in Functional Urban Areas (FUA) of 1.5 million people or more, 2018–2021 Q2
In nearly all OECD countries, the most-productive region is nearly twice as productive as the leastproductive region of the country. GDP growth has continued to be highest in metropolitan regions, which means rural and non-metropolitan areas
are not catching up. Capital regions tend to be the most productive regions within their respective countries, although they often show also the highest interpersonal income inequalities.
- 9 -
Regional economic disparities remain stubbornly large
Demographically, ageing is challenging the whole OECD area, but more strongly in rural and remote regions. In this context, metropolitan regions are projected to continue growing while rural areas are expected to lose population in the coming decades. Many cities and metropolitan regions continue to attract immigrants, as well as young people who move from other parts of the country. But not all cities are in the same situation. While urban agglomerations with more than five million
inhabitants are projected to witness population increases by more than 20% on average, agglomerations with fewer than one million inhabitants are expected to lose 3-4% of their population by 2030. The aforementioned trends further complicate the provision of services. For example, adjusting for population, hospital bed rates are 50% higher in metropolitan regions compared to regions far from metropolitan areas.
Population in non-metropolitan regions is expected to shrink over the next two decades
Metropolitan regions Regions near a metropolitan area Regions far from a metropolitan area
Population (2020 level = 100)
101
100
99
98
Total population projection for 2030 and 2040 relative to 2020 96
102 2020 2025 2030 2035 2040
97
In nearly all OECD regions, employment rates of youth and women (especially female immigrants) remain lower than other demographic groups. Relative poverty rates (the share of the population with an income below 60% of the national
median income) have remained around 20% over the last decade and regions with high relative poverty rates are not sharing as much in national prosperity.
- 10 -
Relative poverty rates are high in many regions
Percent of population with disposable income <60% of the national median
25% 50% 75%
Israel Canada Australia
United States Portugal Germany
Belgium
Switzerland
Colombia Mexico France
Italia Austria Sweden
Spain Luxembourg
Ireland Greece
Minimum region National average Maximum region
Slovakia Hungary
United Kingdom
Poland Finland
Latvia Estonia Denmark
Czech Republic
Chile Lituania Iceland
- 11 -
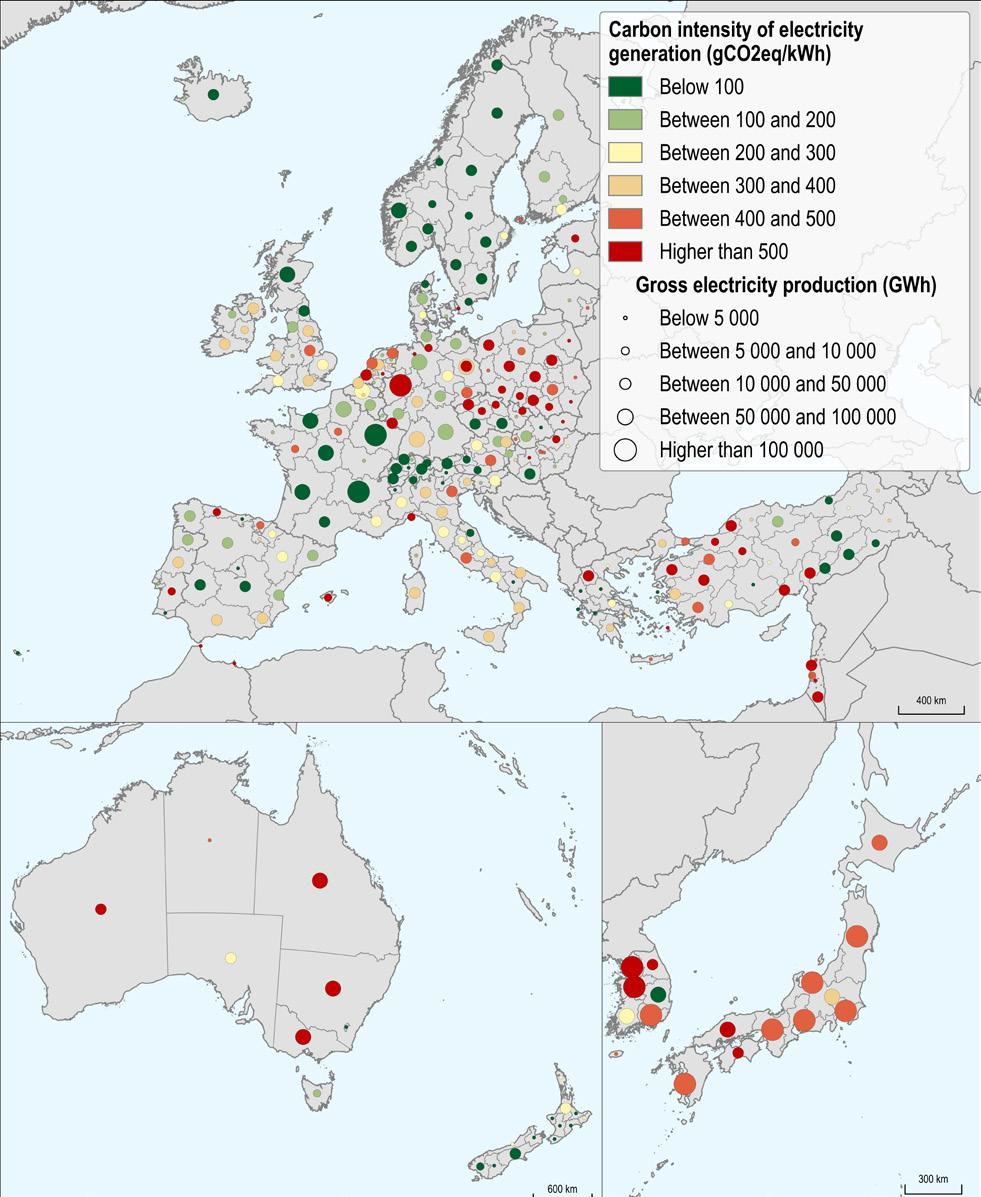
Some regions are still heavily invested in carbon-intensive electricity generation, while others will need to undertake profound industrial transitions.
All sectors (power supply, industry, transport, buildings, agriculture and waste) will need to undergo deep structural transformations to meet the Paris Agreement’s climate neutrality goals by 2050. On average, OECD regions will need to cut their emissions by a factor of 6 to limit the rise in global temperatures. This requires electrifying many sectors while ensuring that
electricity is generated from low-carbon sources. Energy sources and infrastructure for electricity generation vary substantially across places. For example,
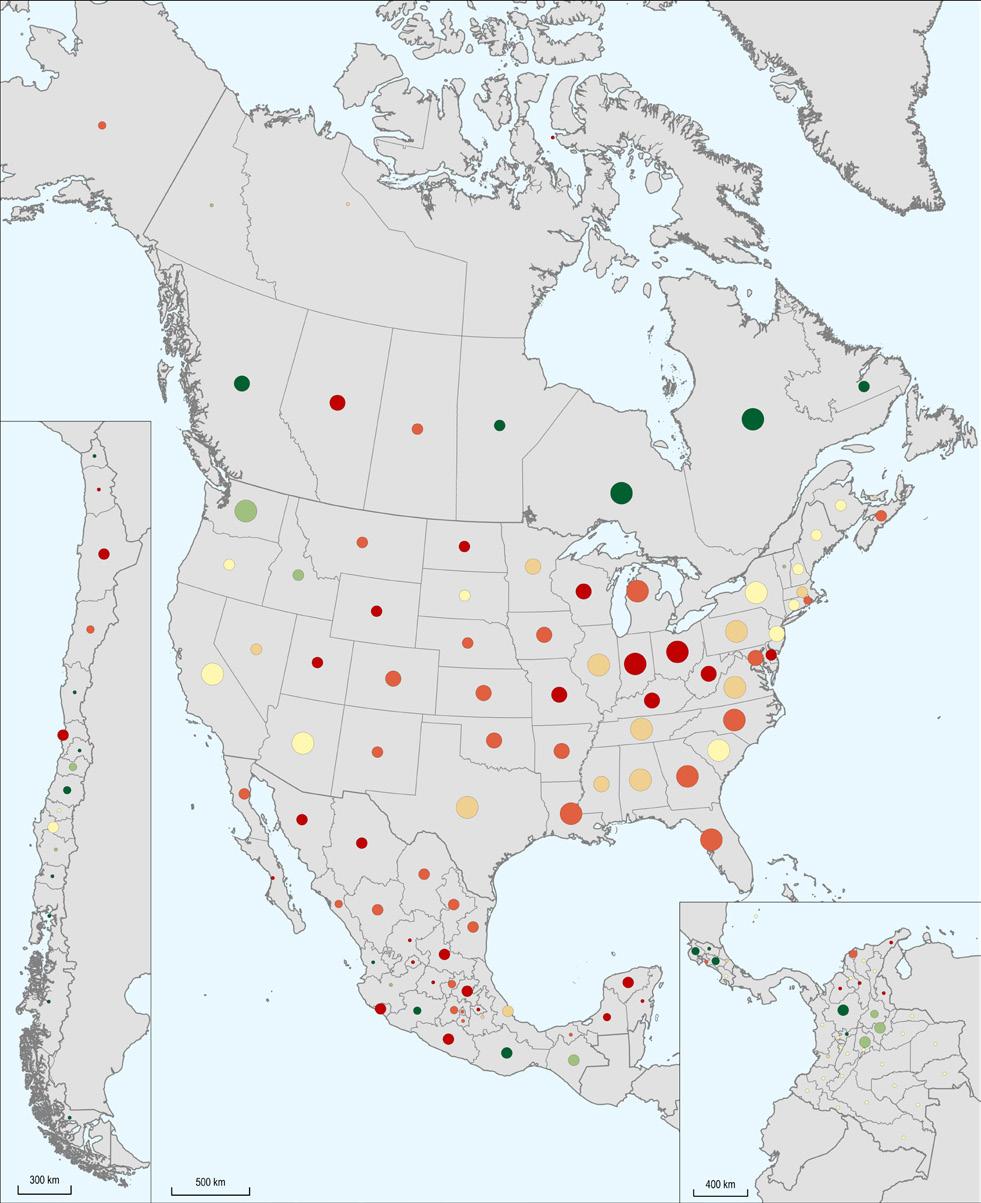
More than 50 regions across the OECD rely primarily on coal (a heavy-pollutant) for electricity generation.
Another 50 European regions use mostly natural gas, a cleaner source, but one that depends on imports and eventually also needs to be phased out.
In many regions, the carbon emission intensity of their electricity generation remains far too high
Carbon intensity (g CO2 eq/kWh) and gross electricity production (GWh), 2019, large regions (TL2)
- 12 -
Most regions and cities need to do more to meet net zero targets by 2050
Aside from coal-intensive regions, remote regions tend to use cleaner sources of power (e.g. renewables) than metropolitan regions. However, cities can rely on more efficient public transport and therefore count on lower road transport
emissions on a per capita basis. While most city residents can access a bus stop within a 10-minute walk, rural areas rely more on passenger vehicles. In terms of electric and hybrid vehicles, capitals are the highest adopters in most OECD countries.
Norwegian regions lead electric and hybrid vehicle deployment Share of private electric or hybrid vehicles (%) in large regions (TL2), 2020-21
Norway Switzerland Korea Belgium Austria Ireland Sweden Hungary Germany Slovakia Slovenia France Canada Latvia Poland Mexico
Zurich Jeju Brussels Region Vienna Eastern and Midland Stockholm Budapest Greater London Bratislava West Île de France Quebec Warsaw Oaxaca
Oslo and Viken
Regional values National values
0.0% 5.0% 10.0% 15.0% 20.0% 25.0% 30.0% 35.0% 40.0%
- 13 -

- 14OECD Centre for Entrepreneurship, SMEs, Regions and Cities Rudiger AHREND | Rudiger.Ahrend@oecd.org Paolo VENERI | Paolo.Veneri@oecd.org Get in touch More information on the OECD Regional Statistics: https://www.oecd.org/regional/regional-statistics https://regions-cities-atlas.oecd.org/ Visit our web tool
This document, as well as any statistical data and map included herein, are without prejudice to the status of or sovereignty over any territory, to the delimitation of international frontiers and boundaries and to the name of any territory, city or area.
The statistical data for Israel are supplied by and under the responsibility of the relevant Israeli authorities. The use of such data by the OECD is without prejudice to the status of the Golan Heights, East Jerusalem and Israeli settlements in the West Bank under the terms of international law.


@OECD_local #OECDregions | blog: oecdcogito.blog/ Follow us on More information: www.oecd.org/cfe /company/oecd-local COGITO