TRENDS

TODAY’S REAL ESTATE ALONG FLORIDA’S EAST COAST
THIRD QUARTER 2022


Our market report for the third quarter of 2022 is here to provide you with the latest data and insights on the real estate market from Miami to Amelia Island.
The Florida economy continues to strengthen, attracting new residents and increasing the demand for housing. Sales may be reaching a moderate pace, but homes continue to hold their value, and for-sale inventory remains low relative to historical levels. We are seeing pricing trend higher in several counties across Florida’s East Coast. National for-sale housing slowdowns indicate that regional real estate conditions may be better positioned than other areas of the country through the remainder of the year into 2023.
Our markets continue to strengthen in job and wage growth, key indicators that the east coast of Florida remains a safe haven for investment. According to a recent Investing in America ranking compiled by the Financial Times and Nikkei, Miami ranks as the best U.S. city for foreign multinationals to do business. This recognition reinforces Miami’s growth and maturity over the years, as it continues to be one of the most popular migration destinations of any major U.S. metro area.
At ONE Sotheby’s International Realty, we continue to invest in our real estate advisors, so they can provide their clients with exceptional service and timely market trends to make smarter real estate decisions.
Let’s keep reaching new levels of excellence!


ONE Sotheby’s International Realty presents the only market report focused on Florida’s East Coast. From Miami to Amelia Island, data is presented from a macro perspective down to city level.
Data is sourced from local Multiple Listing Service (MLS) organizations. Written analysis created in partnership with the Rosen Consulting Group, a nationally recognized consulting firm and trusted advisor to top public and private real estate operators and capital providers.
During the third quarter, Florida’s East Coast economy strengthened and continued to attract new residents, adding to housing demand. While higher mortgage rates constrained some purchasing activity, labor market conditions and demographic growth buoyed sales. We saw pricing trending higher in several counties across the state, even as a national for-sale housing slowdown took root.
For-sale inventory continued to trend higher, reaching nearly 31,000 condos and homes by the end of the quarter.
Compared with one quarter ago, condo inventory increased by 7% while single-family home inventory increased by 2%. However, even as more homes became available, newly listed properties came to market at higher pricing. The median price per square foot of an available condo increased by nearly 2% from last quarter. In the single-family home segment, the median price per square foot increased by more than 2%.


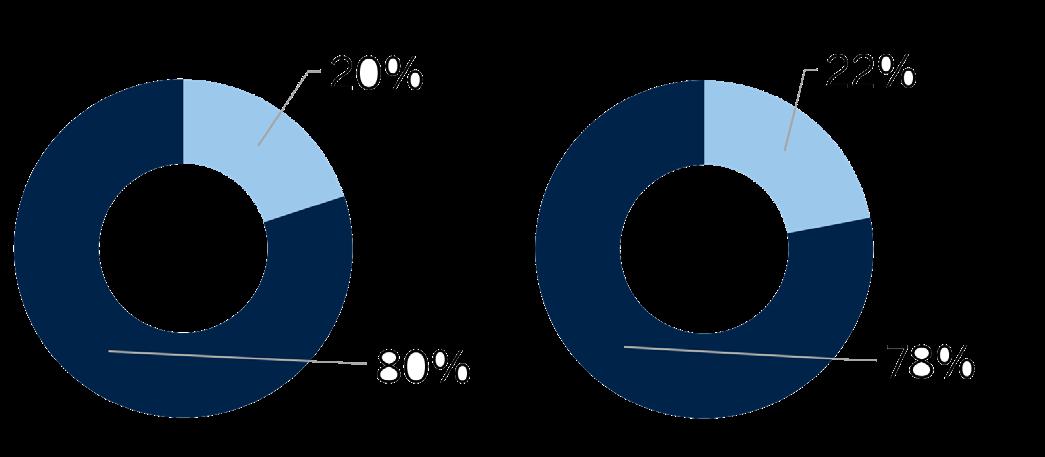
A moderate share of sales closed above the list price, highlighting that buyers will compete for well-priced homes in desirable neighborhoods. In the third quarter, 26% of single-family home sales closed at greater than the asking price. While the share of sellers receiving a pricing premium declined, it remains much greater than the same period in 2018 and 2019. In the condo segment, more than 22% of sales were above the list price, higher than the third quarter of 2021.

EAST COAST

Through the remainder of the year, the housing market along Florida’s East Coast may be better positioned than other regions of the country. While sales reach a moderate pace, home values should hold. The strength of the regional economy as well as the potential for higher mortgage rates will dictate the direction of the housing market into next year.
SINGLE FAMILY HOMES
2,796
$34,000,000
$19,500,000
SINGLE FAMILY HOMES
-23% $1,995,000
2,485 -14% $5,300,000 CONDOS
SINGLE FAMILY HOMES

$264,900
$360,846 21% $271 26% 3,867 -23% $15,400,000
$354 19% 3,284 -27% $32,500,000 CONDOS 3,384
SINGLE FAMILY HOMES
MARTIN COUNTY
$380,500
$266,400
$360,099 11% $250 16% 248 -15% $1,720,000
$524,722 3% $253 11% 649 -20% $15,000,000 CONDOS
SINGLE FAMILY HOMES
$675,000
$833,949
$356 28% 208 -27% $6,200,000 CONDOS
$298,000
$351,717
$271 22% 117 -34% $1,250,000 PALM BEACH COUNTY
SINGLE FAMILY HOMES
RESIDENTIAL
RESIDENTIAL
RESIDENTIAL
$625,000
$977,695
$378 23% 3,128 -25% $26,775,000 CONDOS


A new ultra-luxury residential development in Surfside. Featuring a collection of eight private beach homes designed by award-winning firm Rene Gonzalez Architects (RGA), the development offers refined interiors, the utmost privacy, and unparalleled indooroutdoor living adjacent to the beach.

2022 ONE Sotheby’s International Realty. All rights reserved. Sotheby’s International Realty® and the Sotheby’s International Realty Logo are service marks licensed to Sotheby’s International Realty A liates LLC and used with permission. ONE Sotheby’s International Realty fully supports the principles of the Fair Housing Act and the Equal Opportunity Act. Each franchise is independently owned and operated. Any services or products provided by independently owned and operated franchisees are not provided by, a liated with or related to Sotheby’s International Realty A liates LLC or any of its a liated companies. e information contained herein is deemed accurate but not guaranteed. Oral representations cannot be relied upon as correctly stating the representations of the developer. For correct representations, reference should be made to the documents required by section 718.503, Florida Statutes, to be furnished by a developer to a buyer or lessee. Pricing subject to change without notice.
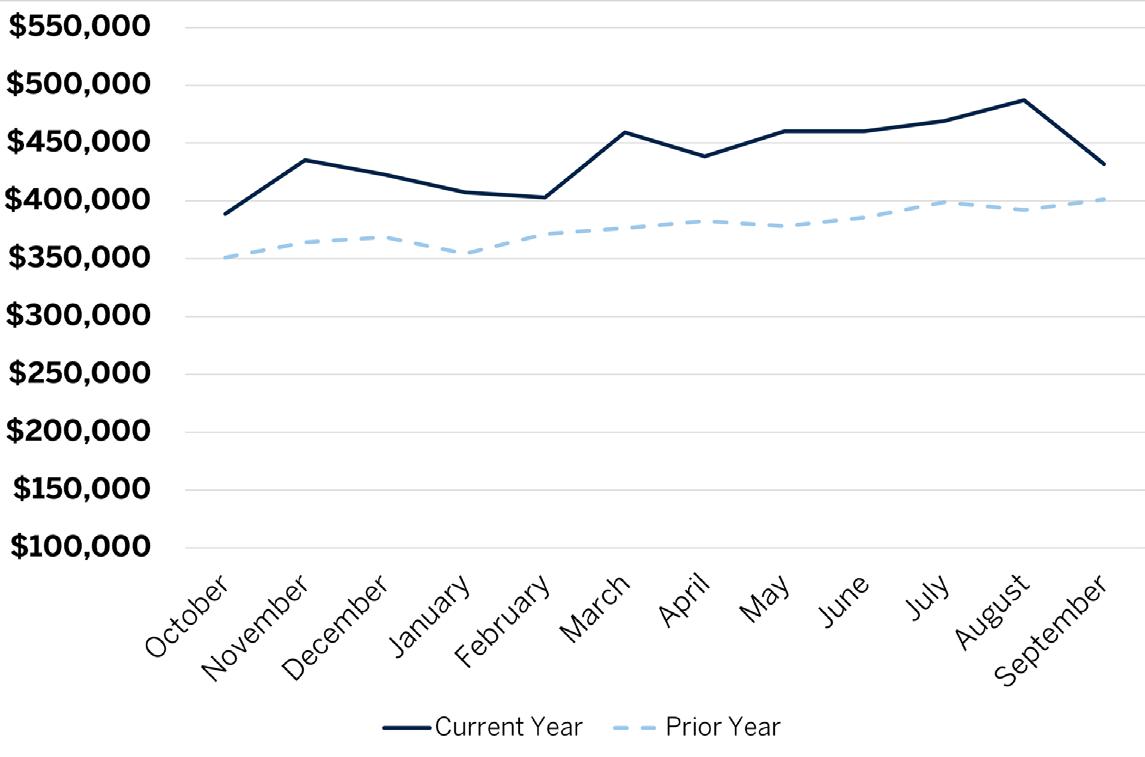
Listed inventory increased by almost 40% from last year, yet the median price was 12% higher than last year. The average number of days on the market was 14% lower than last year.


MIAMI-DADE COUNTY
$930,910 $962,148
AVENTURA $3,653,750 $1,041,917
BAL HARBOUR N/A $4,776,875
N/A
- N/A
BAY HARBOR ISLANDS $6,150,000 $6,625,000 -7% $1,472 21% 2 -60%
COCONUT GROVE $3,163,000 $2,608,000 21% $1,175 51% 40 -63% 39
CORAL GABLES $2,512,807 $2,304,609 9% $816 28% 88 -48% 39
FISHER ISLAND N/A N/A N/A N/A N/A - N/A N/A
GOLDEN BEACH $22,000,000 $8,288,333 165% $2,241 89% 2 -33% 62
INDIAN CREEK N/A NA N/A N/A N/A - N/A N/A
KEY BISCAYNE $6,168,281 $4,130,845 49% $1,416 35% 16 -54% 82
MIAMI $732,450 $696,533 5% $380 16% 1,330 -21% 36
MIAMI BEACH $3,794,264 $5,282,759 -28% $1,166 6% 45 -55% 48
MIAMI SHORES $1,443,206 $1,358,105 6% $659 22% 36 -32% 36
NORTH BAY VILLAGE $1,459,107 $840,200 74% $735 101% 7 40% 39
PINECREST $2,825,899 $2,363,227 20% $730 35% 47 -51% 48
SOUTH MIAMI $1,706,293 $1,201,370 42% $657 44% 29 -33% 54
SUNNY ISLES BEACH $1,550,000 $2,265,714 -32% $766 -3% 5 -29% 114
SURFSIDE $1,534,000 $1,538,500 0% $766 13% 10 -55% 60
<$500,000 $407,906 $384,372
$500,000-$999,999 $668,424 $681,979
$1MM-$4.99MM $1,979,924 $1,981,732
>$5MM $9,760,124 $11,272,955

All markets performed well this quarter on a persquare-foot basis, and Miami-Dade was no exception. The average sales price per square foot was the highest in the region.


MIAMI-DADE
$589,309
AVENTURA $632,929 $497,717
HARBOUR $2,080,095 $1,355,099
BAY HARBOR ISLANDS $676,038 $517,647
BRICKELL/DOWNTOWN MIAMI/EDGEWATER $785,711 $659,648
$950
$476
$617 28% 453 -42% 57

COCONUT GROVE $940,000 $1,049,000 10% $655 4% 79 -43% 35
CORAL GABLES $710,183 $733,803 -3% $528 20% 78 -33% 54
FISHER ISLAND N/A $6,075,000 N/A N/A N/A - N/A N/A
GOLDEN BEACH N/A N/A N/A N/A N/A - N/A N/A
INDIAN CREEK N/A N/A N/A N/A N/A - N/A N/A
KEY BISCAYNE $1,560,163 $1,344,377 16% $889 23% 49 -60% 64
MIAMI $422,949 $385,694 10% $366 18% 1,162 -29% 36
MIAMI BEACH $769,513 $831,542 -7% $649 6% 522 -23% 65
MIAMI SHORES $311,875 $288,825 8% $264 7% 8 0% 45
NORTH BAY VILLAGE $409,626 $348,194 18% $368 26% 48 -11% 83
PINECREST $602,794 $323,935 86% $392 38% 17 -50% 27
SOUTH MIAMI $377,890 $337,467 12% $420 38% 10 -33% 20
SUNNY ISLES BEACH $1,329,218 $1,166,383 14% $637 8% 205 -44% 98
SURFSIDE $1,749,500 $1,527,876 15% $1,039 27% 20 25% 130
$674,573
$1,820,482
$8,010,047
The share of homes sold above the asking price was the highest in the region. While each county in the region experienced a decrease in buyer competition, Broward County was the only county where these transactions were greater than 30%.


BROWARD COUNTY
$760,114 $679,202 12% $354 19% 3,284 -27% 29
COOPER CITY $751,556 $647,944 16% $344 19% 76 -25% 24
CORAL SPRINGS $704,257 $597,940 18% $301 23% 234 -41% 25
DAVIE $865,121 $747,465 16% $350 19% 161 -25% 29
DEERFIELD BEACH $600,372 $469,107 28% $336 20% 91 -16% 28
FORT LAUDERDALE $1,225,375 $1,179,718 4% $486 12% 405 -30% 41
HALLANDALE $670,708 $940,578 -29% $379 1% 24 0% 40
HILLSBORO BEACH N/A NA N/A N/A N/A - N/A N/A HOLLYWOOD $637,906 $522,327 22% $369 21% 278 -24% 30
LAUDERDALE-BY-THE-SEA $1,087,950 $939,500 16% $653 34% 10 -17% 29
LIGHTHOUSE POINT $1,650,742 $1,598,140 3% $596 14% 33 -42% 33
MIRAMAR $634,925 $542,218 17% $304 24% 223 -18% 27
PARKLAND $1,287,510 $1,022,114 26% $371 27% 128 -40% 29
PEMBROKE PINES $647,134 $531,118 22% $315 24% 282 -15% 25

PLANTATION $760,294 $641,560 19% $324 23% 173 -28% 26
POMPANO BEACH $633,515 $558,092 14% $388 17% 158 -30% 28
SOUTHWEST RANCHES $2,610,970 $1,507,711 73% $486 29% 12 -66% 40
SUNRISE $470,071 $394,229 19% $302 17% 140 -14% 23
WESTON $1,019,859 $874,889 17% $379 25% 168 -38% 25
WILTON MANORS $789,117 $696,365 13% $513 28% 47 -6% 21
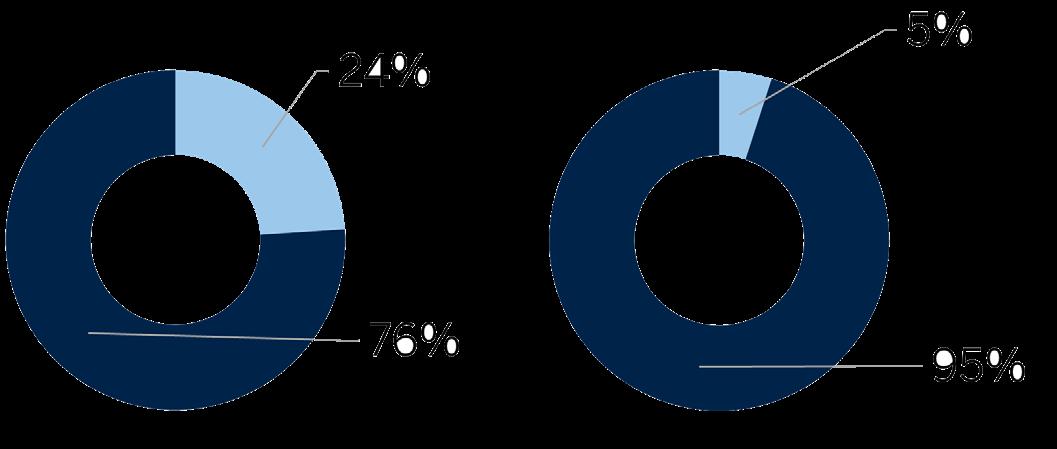
In the third quarter, 29% of units sold for more than the list price, the highest number for condos in the region. Buyer competition remained higher than in neighboring counties even as the months of supply increased in Broward County.


BROWARD COUNTY
$360,846 $297,416 21% $271 26% 3,867 -23% 35
COOPER CITY $425,667 $351,154 21% $296 23% 12 -66% 14
CORAL SPRINGS $265,226 $206,842 28% $218 27% 163 -20% 21
DAVIE $295,606 $241,133 23% $229 27% 130 -32% 22
DEERFIELD BEACH $257,510 $214,753 20% $210 29% 237 -23% 28
FORT LAUDERDALE $752,945 $565,352 33% $472 37% 528 -29% 51
HALLANDALE $381,740 $304,866 25% $328 26% 248 -27% 49
HILLSBORO BEACH $851,684 $818,773 4% $501 35% 19 -42% 45 HOLLYWOOD $423,614 $380,312 11% $350 22% 293 -29% 46
LAUDERDALE-BY-THE-SEA $935,049 $628,568 49% $466 21% 40 -32% 51
LIGHTHOUSE POINT $276,661 $241,529 15% $245 24% 32 3% 30
MIRAMAR $344,542 $282,359 22% $270 26% 113 -14% 22
PARKLAND $564,583 $444,506 27% $333 33% 12 -33% 24
PEMBROKE PINES $283,507 $235,335 20% $234 25% 295 -20% 26
PLANTATION $271,403 $221,201 23% $210 18% 112 -38% 27
POMPANO BEACH $355,920 $288,555 23% $279 25% 301 -29% 29
SOUTHWEST RANCHES N/A N/A N/A N/A N/A - N/A N/A
SUNRISE $234,903 $185,928 26% $201 36% 250 -2% 35
WESTON $378,131 $328,952 15% $284 19% 68 -17% 21
WILTON MANORS $458,785 $321,093 43% $314 28% 43 8% 22
The average sales price in Palm Beach County almost reached $1 million in the third quarter. Although the average price was lower than the first two quarters of the year, pricing remained 11% higher than last year and the highest quarterly average in the region.


PALM BEACH COUNTY
$977,695 $877,778 11% $378 23% 3,128 -25% 30
BOCA RATON $1,250,370 $1,044,666 20% $433 31% 511 -25% 30
BOYNTON BEACH $583,374 $499,867 17% $289 24% 471 -41% 26
DELRAY BEACH $1,065,173 $1,057,280 1% $415 22% 257 -31% 28
HIGHLAND BEACH $6,775,000 $9,837,500 -31% $1,519 18% 2 -50% 39
JUNO BEACH $1,052,500 $1,254,167 -16% $490 -18% 2 -67% 29
JUPITER $1,341,384 $985,295 36% $485 31% 211 -21% 32
JUPITER INLET COLONY N/A N/A N/A N/A N/A - N/A N/A
LAKE PARK $413,167 $358,784 15% $268 25% 12 -37% 31
LAKE WORTH $589,818 $488,850 21% $271 18% 296 -27% 30
LANTANA $904,321 $749,717 21% $387 23% 28 -22% 23
NORTH PALM BEACH $1,533,496 $1,820,578 -16% $531 4% 28 -38% 26
MANALAPAN $26,775,000 $1,150,000 62% $6,169 241% 1 -50% $213
PALM BEACH $9,030,938 $14,930,464 -40% $2,771 15% 11 -50% 62
PALM BEACH GARDENS $1,477,030 $1,090,205 35% $460 35% 206 -20% 32
SINGER ISLAND $4,807,500 $1,589,833 202% $1,269 112% 4 -33% 23
TEQUESTA $1,253,319 $1,506,305 -17% $544 11% 11 -48% 20
WELLINGTON $1,133,986 $900,079 26% $394 30% 215 -24% 36
WEST PALM BEACH $769,003 $672,142 14% $344 24% 336 -37% 34
Sales activity decreased by 31% this quarter from last year. At the same time, the number of days on the market also reduced by 35%, while active listings increased by 40%.


PALM BEACH COUNTY
$408,188 $357,906 14% $235 18% 2,827 -31% 30
BOCA RATON $434,138 $455,970 -5% $241 2% 529 -34% 31
BOYNTON BEACH $292,138 $236,909 23% $178 22% 289 -27% 25
DELRAY BEACH $334,835 $250,657 34% $195 29% 431 -29% 27
HIGHLAND BEACH $1,110,017 $970,655 14% $575 17% 43 -28% 52
JUNO BEACH $1,216,125 $574,263 112% $628 86% 16 -47% 17
JUPITER $652,589 $458,733 42% $383 33% 150 -32% 23
JUPITER INLET COLONY N/A N/A N/A N/A N/A - N/A N/A
LAKE PARK $269,447 $289,475 -7% $161 -32% 19 138% 29
LAKE WORTH $253,543 $183,843 38% $160 30% 156 -21% 30
LANTANA $259,938 $320,913 -19% $170 1% 29 -3% 33
NORTH PALM BEACH $544,234 $479,793 13% $266 18% 61 -31% 31
MANALAPAN N/A N/A N/A N/A N/A - N/A N/A
PALM BEACH $1,994,769 $1,231,890 62% $918 59% 48 -42% 42
PALM BEACH GARDENS $449,829 $377,636 19% $274 26% 127 -44% 25
SINGER ISLAND $851,251 $969,079 -12% $525 25% 18 -68% 37
TEQUESTA $806,000 $335,650 140% $464 101% 15 -52% 22
WELLINGTON $419,795 $378,873 11% $265 14% 57 -7% 35
WEST PALM BEACH $256,831 $240,689 7% $158 14% 476 -34% 31
Martin County had the highest median price in the region. Compared with last year, the 31% increase in the median price was also the highest increase in the region.


MARTIN
HOBE SOUND
ISLAND $2,652,500
JENSEN BEACH $656,009
JUPITER ISLAND $5,668,750 $7,075,000
CITY $800,270 $662,531
SEWALL'S POINT $1,633,250
STUART $705,932
$727,604
$1,561,485
$4,800,000
The number of condos listed for sale increased by more than 100% from the same time last year. Much of the increase in inventory can be attributed to a slower pace of absorption of existing homes on the market rather than a flood of new listings.


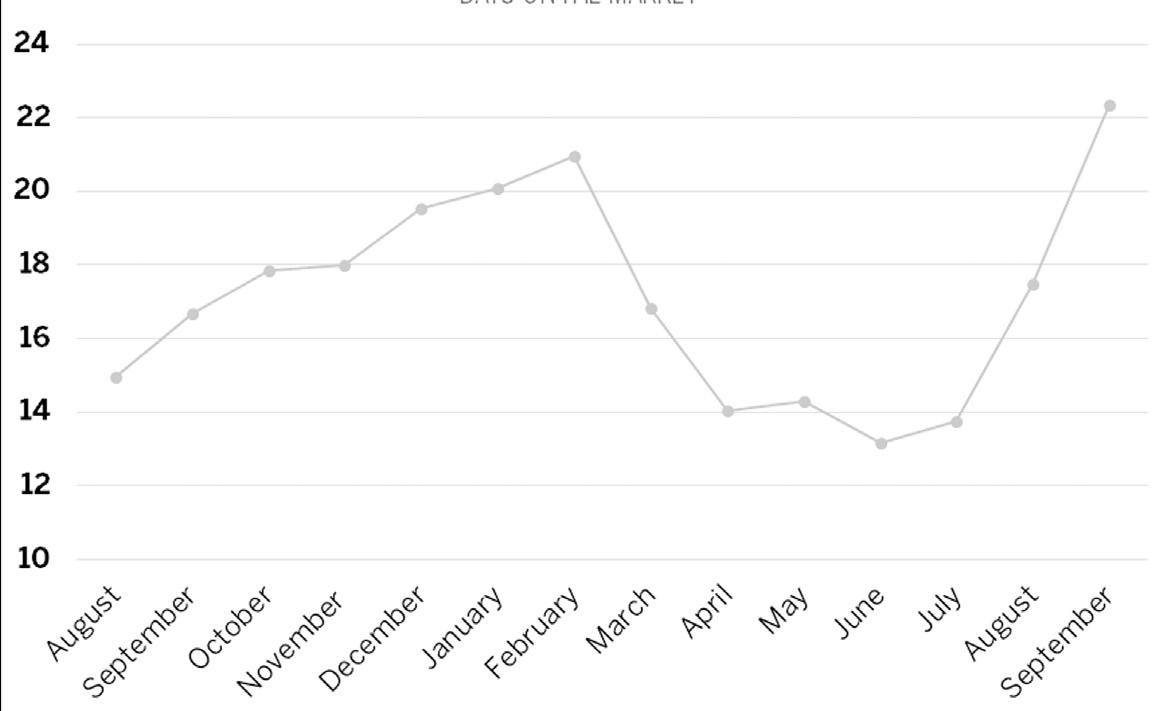
The average number of days a home remains on the market was the longest in the region this quarter, at 54 days. Yet, it was 10% lower than the same time last year.


Sales decreased by 15% in the third quarter compared to last year. Additionally, active listings increased by 79% in Indian River County.


Pricing finished the third quarter strong, with the median price increasing by 1% to $370,000. In contrast, the median price declined in most other counties.


BREVARD COUNTY
$448,417 $393,351 14% $232 18% 2,485 -14% 18
COCOA $331,838 $284,153 17% $204 15% 256 -11% 14
COCOA BEACH $912,285 $784,633 16% $431 19% 33 -21% 30
GRANT $408,082 $632,374 -35% $205 -17% 57 256% 19
INDIALANTIC $792,701 $677,184 17% $359 22% 39 -26% 19
MALABAR $633,911 $522,354 21% $280 32% 19 -21% 22
MELBOURNE $485,096 $424,229 14% $239 19% 559 -26% 17
MELBOURNE BEACH $1,384,378 $920,813 50% $487 43% 41 -24% 29
MERRITT ISLAND $598,331 $509,937 17% $278 20% 168 -18% 20
MIMS $381,261 $365,889 4% $206 6% 55 25% 17
PALM BAY $341,139 $276,443 23% $199 23% 784 1% 17
ROCKLEDGE $500,306 $462,523 8% $236 13% 148 -30% 19
SATELLITE BEACH & INDIAN HARBOUR BEACH $655,230 $598,045 10% $321 13% 81 -26% 18
TITUSVILLE $334,177 $278,461 20% $197 22% 189 -21% 20
WEST MELBOURNE $458,980 $386,554 19% $235 32% 30 -58% 9

The share of condos sold above the asking price decreased. However, the average days on the market decreased significantly for higher-priced condos.


BREVARD COUNTY
$367,168 $333,241 10% $267 17% 404 -23%
COCOA $278,165 $229,845 21% $209 20% 26 30% 12
COCOA BEACH $517,613 $408,607 27% $373 24% 73 -4% 23
GRANT N/A N/A N/A N/A N/A - N/A N/A
INDIALANTIC $495,025 $517,988 -4% $340 7% 12 -71% 39
MALABAR N/A N/A N/A N/A N/A - N/A N/A
MELBOURNE $255,555 $294,114 -13% $198 9% 67 -43% 26
MELBOURNE BEACH $688,444 $537,568 28% $366 36% 9 -53% 49
MERRITT ISLAND $279,128 $228,169 22% $211 26% 32 -9% 38

MIMS N/A N/A N/A N/A N/A - N/A N/A
PALM BAY $201,500 $235,121 -14% $181 6% 15 7% 24
ROCKLEDGE $276,808 $212,700 30% $182 12% 28 33% 11
SATELLITE BEACH & INDIAN HARBOUR BEACH $575,500 $503,021 14% $362 25% 32 -47% 38
TITUSVILLE $271,290 $178,205 52% $176 15% 32 7% 33
WEST MELBOURNE $192,275 $192,380 0% $172 14% 12 20% 12

Most homes priced greater than $3 million sold in St. Johns County. While total sales volume fell, higher-priced home sales increased substantially from last year.


ST. JOHNS COUNTY
$605,457 $517,259
$288 22% 2,271 -28%
JULINGTON CREEK AREA $605,730 $515,340 18% $239 18% 237 -39%
NOCATEE $776,515 $628,897 23% $309 22% 173 -15%

PONTE VEDRA BEACH $1,198,361 $977,354 23% $460 36% 148 -29%
SOUTHEAST ST JOHNS COUNTY $596,607 $522,215 14% $355 19% 179 -30%
ST AUGUSTINE BEACHES/ANASTASIA ISLAND $412,231 $345,195 19% $245 20% 206 -11%
ST JOHNS $579,599 $514,953 13% $249 22% 214 -18%
SOUTHWEST ST JOHNS COUNTY $415,619 $370,179 12% $238 17% 69 -38%
ST AUGUSTINE/VILANO BEACH $644,421 $557,530
WORLD GOLF VILLAGE AREA/PALENCIA $541,554 $470,417
$294 21% 108 -37%
-38%


Duval County continued to produce the highest sales volume and the largest for-sale inventory in Northeast Florida.

DUVAL COUNTY
$373,900 $321,756
ARLINGTON/FORT CAROLINE $293,068 $270,690
$211 20% 3,678 -36%

$187 21% 333 -32%
AVONDALE/RIVERSIDE/ORTEGA $534,619 $449,740 19% $280 22% 111 -42%
BARTRAM $365,896 $307,803 19% $207 20% 95 -48%
BEACHES $779,546 $679,877 15% $423 23% 192 -37%
BEAUCLERC/MANDARIN $450,056 $365,244 23% $220 23% 295 -40% 32
DOWNTOWN JACKSONVILLE $169,784 $138,991 22% $136 35% 324 -26% 39
INTRACOASTAL $582,026 $449,397 30% $260 24% 362 -33% 31
NOCATEE (DUVAL) $429,230 $372,411 15% $239 27% 34 62% 37

NORTH JACKSONVILLE $352,291 $303,973 16% $182 18% 331 -33% 38 SAN MARCO/SAN JOSE $467,978 $388,054 21% $234 16% 135 -41% 42
SOUTHSIDE $307,840 $264,766 16% $200 20% 463 -37% 31
WEST JACKSONVILLE $282,749 $241,204 17% $178 20% 805 -26% 33
Sales of homes in the higher price categories increased in Clay County this quarter compared to last year. Sales in the $500,000 to $1 million price range increased by 38%, while sales above $1 million more than doubled.


Though pricing fell in some counties, the median price in Nassau County increased by 4% from last quarter and 16% from one year ago.


Though many counties experienced an increase in the average days on the market, Flagler County had the shortest number of days, on average. In the last year, the average days on the market only increased by 3%.


© 2022 ONE Sotheby’s International Realty. All rights reserved. Sotheby’s International Realty® and the Sotheby’s International Realty Logo are service marks licensed to Sotheby’s International Realty Affiliates LLC and used with permission. ONE Sotheby’s International Realty fully supports the principles of the Fair Housing Act and the Equal Opportunity Act. Each franchise is independently owned and operated. Any services or products provided by independently owned and operated franchisees are not provided by, affiliated with or related to Sotheby’s International Realty Affiliates LLC nor any of its affiliated companies. The information contained herein is deemed accurate but not guaranteed.