TRENDS
TODAY’S REAL ESTATE ALONG FLORIDA’S EAST COAST

MARKET REPORT MARCH 2023

CONTENTS 06 12 18 08 14 19 10 16 20 21 22 Miami-Dade County Martin County St. Johns County Broward County Indian River County Duval County Palm Beach County Brevard County Clay County Nassau County Flagler County


Scan to Explore Your Mortgage Options Bank on Better Finance your next home with 75 years of trusted Florida-based mortgage expertise at your side. Extensive local real estate experience and market knowledge. Flexible home loans with competitive rates.1 Personalized service from application to close. Primary Residences & Second Homes Vacation Homes & Investment Properties New Construction & Land Acquisition Member FDIC NMLS#412469 1 Loan products are subject to credit approval and program requirements. Terms and conditions apply. This is not a commitment to lend. Loan programs, terms, rates, and conditions are subject to change without notice. © 2023 City National Bank of Florida 2966168977 / r07/22 DAN CAMPANELLA NMLS #459788 Senior Vice President, Mortgage Market Manager e: dan.campanella@citynational.com c: 1.877.511.4CNB


Sales Gallery Now Open | Priced from $3.85M 2406 SE 17th Street, Fort Lauderdale, FL 33316 (954) 393-0537 Residences@piersixtysix.com PierSixtySixResidences.com Own the Waterfront A curated collection of 92 condominium residences overlooking Fort Lauderdale’s legendary marina and Intracoastal waterways. Obtain the Property Report required by Federal Law and read it before signing anything. No Federal or State agency has endorsed or judged the merits of value, if any, of this property. This is not an offer to sell or solicitation to buy real estate in any jurisdiction where prohibited by law. Products and availability are subject to change without notice. Improvements, facilities and programs may be in formative stages and cannot be guaranteed. Artist renderings are for illustrative purposes only and may differ from completed products.
MIAMI-DADE COUNTY
SINGLE-FAMILY HOMES | FEBRUARY PRICING GAINS
The median price increased by 3% in February, driving much of the yearover-year gain of roughly 5%. The median price per square foot remained 10% higher than one year ago.

Neighborhood Snapshots
*ALL PERCENTAGES REFLECT YEAR OVER YEAR CHANGE. 562K 64 3,607 701 338 MEDIAN SALES PRICE AVERAGE DAYS ON MARKET ACTIVE LISTINGS SOLD LISTINGS MEDIAN PPSF ↑ 5% ↑ 36% ↑ 10% ↓ 26% ↑ 78%
MEDIAN SALES PRICE MEDIAN PRICE PER SF CLOSED SALES AVERAGE DAYS ON MARKET FEB 23 FEB 22 YOY% CHANGE FEB 23 YOY% CHANGE FEB 23 YOY% CHANGE FEB 23 AVENTURA $1,175,000 N/A N/A $429 N/A 1 N/A 202 COCONUT GROVE $3,588,000 $2,500,000 43.50% $625 -21.05% 6 -60.00% 98 CORAL GABLES $1,515,900 $1,700,000 -11% $739 23% 28 -15% 86 KEY BISCAYNE $2,400,000 $3,400,000 -29% $1,444 55% 1 -80% 20 MIAMI $560,000 $525,000 7% $338 10% 374 -17% 60 MIAMI BEACH $3,250,000 $2,775,000 17% $981 -10% 16 -20% 141 MIAMI SHORES $1,097,500 $1,250,000 -12% $594 18% 10 -23% 50 PINECREST $2,380,000 $2,375,000 0% $768 16% 7 -50% 102 SOUTH MIAMI $1,035,000 $1,200,000 -14% $547 -12% 6 0% 52 SUNNY ISLES BEACH $1,500,000 $1,240,000 21% $852 30% 3 200% 163 SURFSIDE $7,925,000 $1,125,000 604% $3,546 375% 1 -75% 46
$
$
MIAMI-DADE COUNTY
CONDOMINIUMS | UNITS SELL QUICKER THAN 2022
The average days on market for a condo unit was approximately 20% lower than last year.

Neighborhood Snapshots
6,580
*ALL PERCENTAGES REFLECT YEAR OVER YEAR CHANGE.
395K 69
MEDIAN PPSF ↑ 3% ↓ 19% 0% ↓ 47% ↑ 35%
899 370 MEDIAN SALES PRICE AVERAGE DAYS ON MARKET ACTIVE LISTINGS SOLD LISTINGS
MEDIAN SALES PRICE MEDIAN PRICE PER SF CLOSED SALES AVERAGE DAYS ON MARKET FEB 23 FEB 22 YOY% CHANGE FEB 23 YOY% CHANGE FEB 23 YOY% CHANGE FEB 23 AVENTURA $437,500 $383,500 14% $366 14% 54 -63% 83 BAL HARBOUR $2,500,000 $865,000 189% $962 34% 5 -76% 100 BAY HARBOR ISLANDS $520,000 $652,500 -20% $473 19% 7 -65% 95 BRICKELL/DOWNTOWN MIAMI/EDGEWATER $590,000 $580,000 2% $625 13% 97 -56% 91 COCONUT GROVE $2,225,000 $2,260,000 -1.55% $659 45.55% 10 -52.40% 89 CORAL GABLES $663,000 $541,668 22% $563 20% 12 -72% 74 KEY BISCAYNE $1,050,000 $1,320,000 -20% $743 -13% 11 -39% 66 MIAMI $375,000 $345,000 9% $304 8% 293 -41% 53 MIAMI BEACH $412,500 $432,500 -5% $526 3% 136 -53% 91 MIAMI SHORES $675,000 N/A N/A $391 N/A 1 N/A 22 NORTH BAY VILLAGE $607,500 $315,000 93% $415 34% 12 -29% 64 PINECREST $360,000 $298,700 21% $331 14% 1 -83% 25 SOUTH MIAMI $207,500 $240,000 -14% $392 -4% 3 0% 66 SUNNY ISLES BEACH $660,000 $770,000 -14% $578 7% 57 -42% 99 SURFSIDE $802,500 $465,000 73% $593 26% 4 -69% 81
$ $
BROWARD COUNTY
SINGLE-FAMILY HOMES | BUYERS ABSORBED NEW LISTINGS
While active listings remain more than double the level of one year ago, purchase activity reduced the number of homes for sale by 11% from last month.
Neighborhood Snapshots

*ALL PERCENTAGES REFLECT YEAR OVER YEAR CHANGE. 560K 58
801 318 MEDIAN SALES PRICE AVERAGE DAYS ON MARKET ACTIVE LISTINGS SOLD LISTINGS MEDIAN PPSF ↑ 7% ↑ 66% ↑ 8% ↓ 29% ↑ 119%
2,961
MEDIAN SALES PRICE MEDIAN PRICE PER SF CLOSED SALES AVERAGE DAYS ON MARKET FEB 23 FEB 22 YOY% CHANGE FEB 23 YOY% CHANGE FEB 23 YOY% CHANGE FEB 23 COOPER CITY $613,000 $611,250 0% $327 2% 14 -46% 79 CORAL SPRINGS $625,400 $610,000 3% $286 6% 56 -34% 56 DAVIE $685,000 $600,000 14% $352 10% 44 -15% 59 DEERFIELD BEACH $436,500 $449,500 -3% $268 2% 36 0% 55 FORT LAUDERDALE $685,450 $647,500 6% $429 7% 104 -40% 71 HALLANDALE $485,000 $365,000 33% $330 -8% 10 43% 56 HOLLYWOOD $585,000 $480,000 22% $364 17% 61 -35% 56 LAUDERDALE-BY-THE-SEA $1,100,000 $1,300,000 -15% $658 -4% 2 -60% 57 LIGHTHOUSE POINT $1,950,000 $809,450 141% $649 71% 9 -25% 72 MIRAMAR $605,050 $520,000 16% $290 8% 44 -32% 44 PARKLAND $1,200,000 $1,015,000 18% $330 0% 23 -41% 67 PEMBROKE PINES $580,000 $519,500 12% $302 7% 61 -29% 52 PLANTATION $560,000 $626,500 -11% $288 2% 32 -36% 84 POMPANO BEACH $450,000 $398,000 13% $349 15% 44 -31% 59 SOUTHWEST RANCHES $1,650,000 $1,345,000 23% $427 6% 13 30% 67 SUNRISE $415,000 $427,500 -3% $305 10% 33 -21% 49 WESTON $835,000 $900,000 -7% $338 -3% 30 -14% 57 WILTON MANORS $825,000 $689,500 20% $439 -12% 14 -18% 32
$ $
BROWARD COUNTY
CONDOMINIUMS | TIME ON MARKET LOWEST IN REGION
Broward County generated the highest number of condo sales in February, helping to drive the average time on market to the lowest in the region.
Neighborhood Snapshots

*ALL PERCENTAGES REFLECT YEAR OVER YEAR CHANGE. 270K 51 4,381 943 239 MEDIAN SALES PRICE AVERAGE DAYS ON MARKET ACTIVE LISTINGS SOLD LISTINGS MEDIAN PPSF ↑ 15% ↓ 6 % ↑ 12% ↓ 32% ↑ 88%
MEDIAN SALES PRICE MEDIAN PRICE PER SF CLOSED SALES AVERAGE DAYS ON MARKET FEB 23 FEB 22 YOY% CHANGE FEB 23 YOY% CHANGE FEB 23 YOY% CHANGE FEB 23 COOPER CITY $420,000 $385,000 9% $303 15% 8 33% 38 CORAL SPRINGS $210,000 $172,450 22% $225 30% 38 6% 40 DAVIE $285,000 $235,000 21% $228 19% 26 -42% 24 DEERFIELD BEACH $181,500 $167,500 8% $192 8% 69 -18% 50 FORT LAUDERDALE $399,500 $417,500 -4% $379 6% 122 -46% 80 HALLANDALE $332,500 $290,000 15% $299 14% 68 -35% 73 HILLSBORO BEACH $432,500 $540,000 -20% $387 -18% 6 -33% 56 HOLLYWOOD $260,000 $350,000 -26% $258 -20% 71 -41% 58 LAUDERDALE-BY-THE-SEA $475,000 $525,000 -10% $393 -7% 13 -32% 87 LIGHTHOUSE POINT $200,000 $120,000 67% $194 -7% 8 -32% 48 MIRAMAR $420,000 $320,000 31% $253 6% 19 -42% 36 PARKLAND $586,500 $425,000 38% $319 20% 1 -80% 125 PEMBROKE PINES $232,000 $195,000 19% $211 20% 69 -20% 44 PLANTATION $329,000 $206,000 60% $255 40% 39 18% 28 POMPANO BEACH $310,000 $247,500 25% $262 14% 81 -34% 50 SOUTHWEST RANCHES N/A N/A N/A N/A N/A - N/A N/A SUNRISE $183,500 $160,000 15% $192 30% 56 -35% 50 WESTON $367,500 $275,500 33% $283 25% 12 -43% 50 WILTON MANORS $435,000 $206,750 110% $305 9% 13 -7% 22
$ $
PALM BEACH COUNTY
SINGLE-FAMILY HOMES | SALES REBOUND
Home sales increased by 21% in February from the previous month, though activity remained lower compared to one year ago. In February, more homes sold in Palm Beach County than in any other county in the region.
Neighborhood Snapshots

*ALL PERCENTAGES REFLECT YEAR OVER YEAR CHANGE. 575K 60 3,544 840 297 MEDIAN SALES PRICE AVERAGE DAYS ON MARKET ACTIVE LISTINGS SOLD LISTINGS MEDIAN PPSF 0% ↑ 76% ↑ 3% ↓ 21% ↑ 164%
MEDIAN SALES PRICE MEDIAN PRICE PER SF CLOSED SALES AVERAGE DAYS ON MARKET FEB 23 FEB 22 YOY% CHANGE FEB 23 YOY% CHANGE FEB 23 YOY% CHANGE FEB 23 BOCA RATON $822,500 $732,500 12% $376 10% 136 -23% 67 BOYNTON BEACH $495,000 $495,000 0% $273 6% 128 54% 51 DELRAY BEACH $583,750 $617,500 -5% $310 -2% 80 -23% 59 HIGHLAND BEACH $2,750,000 $13,875,000 -84% $789 -56% 1 -75% 13 JUNO BEACH $2,125,000 $1,325,000 60% $1,042 122% 1 0% 63 JUPITER $890,000 $720,000 24% $402 7% 49 -18% 58 JUPITER INLET COLONY $4,500,000 N/A N/A $1,184 N/A 1 N/A 100 LAKE PARK $432,000 $375,000 15% $247 -14% 5 400% 29 LAKE WORTH $495,000 $461,250 7% $261 2% 74 -29% 60 LANTANA $427,000 $330,000 29% $308 52% 5 -29% 82 NORTH PALM BEACH $610,000 $3,050,000 -80% $374 -42% 9 29% 59 PALM BEACH $15,000,000 $9,900,000 52% $2,750 9% 1 -91% 290 PALM BEACH GARDENS $775,000 $860,000 -10% $376 -2% 40 -31% 50 SINGER ISLAND $2,875,000 $2,200,000 31% $1,106 31% 2 100% 7 TEQUESTA $1,402,500 $1,372,000 2% $567 4% 4 0% 49 WELLINGTON $700,000 $625,000 12% $283 5% 45 -21% 66 WEST PALM BEACH $460,000 $460,000 0% $283 8% 130 -16% 61
$ $
PALM BEACH COUNTY
CONDOMINIUMS | PRICING MOVES HIGHER
The median price remained roughly 9% higher than one year ago. In February alone, the median price per square foot increased by nearly 2%.

Neighborhood Snapshots
*ALL PERCENTAGES REFLECT YEAR OVER YEAR CHANGE. 300K 54 3,759 785 223 MEDIAN SALES PRICE AVERAGE DAYS ON MARKET ACTIVE LISTINGS SOLD LISTINGS MEDIAN PPSF ↑ 9% ↑ 54% ↑ 10% ↓ 36% ↑ 199%
MEDIAN SALES PRICE MEDIAN PRICE PER SF CLOSED SALES AVERAGE DAYS ON MARKET FEB 23 FEB 22 YOY% CHANGE FEB 23 YOY% CHANGE FEB 23 YOY% CHANGE FEB 23 BOCA RATON $336,000 $340,000 -1% $336,000 6% 128 -40% 50 BOYNTON BEACH $265,000 $250,000 6% $196 17% 75 -46% 45 DELRAY BEACH $230,000 $216,250 6% $193 16% 119 -41% 57 HIGHLAND BEACH $878,750 $635,000 38% $621 30% 10 -57% 68 JUNO BEACH $1,162,500 $776,000 50% $623 22% 10 150% 81 JUPITER $573,500 $485,000 18% $349 14% 52 -2% 56 LAKE PARK $317,000 $247,500 28% $34 -76% 3 -25% 36 LAKE WORTH $197,000 $157,000 25% $156 27% 40 -42% 65 LANTANA $247,500 $279,314 -11% $229 -6% 4 -71% 43 NORTH PALM BEACH $280,000 $418,750 -33% $245 -18% 23 5% 68 MANALAPAN N/A N/A N/A N/A N/A - N/A N/A PALM BEACH $1,550,000 $920,000 68% $768 47% 14 -66% 84 PALM BEACH GARDENS $424,500 $367,500 16% $281 13% 44 -24% 58 SINGER ISLAND $937,500 $915,000 2% $664 30% 8 -65% 83 TEQUESTA $509,900 $350,000 46% $404 57% 5 -44% 67 WELLINGTON $330,000 $322,500 2% $212 -9% 9 -18% 31 WEST PALM BEACH $208,000 $185,000 12% $128 -11% 139 -29% 50
$ $
MARTIN COUNTY
SINGLE-FAMILY HOMES | INVENTORY STABILIZES, MORE HIGHER-PRICED HOMES COMING TO MARKET
The number of homes for sale stabilized from last month yet remained nearly four times higher than a year ago. Newly listed homes are coming to market at higher prices, with the median price of a listed home increasing by 8% from January.
Neighborhood Snapshots

*ALL PERCENTAGES REFLECT YEAR OVER YEAR CHANGE. 630K 70 195 47 300 MEDIAN SALES PRICE AVERAGE DAYS ON MARKET ACTIVE LISTINGS SOLD LISTINGS MEDIAN PPSF ↑ 13% ↑ 218% ↑ 3% ↓ 22% ↑ 290%
MEDIAN SALES PRICE MEDIAN PRICE PER SF CLOSED SALES AVERAGE DAYS ON MARKET FEB 23 FEB 22 YOY% CHANGE FEB 23 YOY% CHANGE FEB 23 YOY% CHANGE FEB 23 HOBE SOUND $675,000 $390,000 73% $357 49% 5 569% 63 HUTCHINSON ISLAND $7,991,250 $3,392,500 114% $1,575 46% 19 -36% 105 JENSEN BEACH $525,000 $507,503 3% $296 7% 7 -30% 59 PALM CITY $705,000 $692,500 2% $288 -8% 26 -46% 60 SEWALL'S POINT $4,762,500 $1,625,000 193% $735 29% 2 -33% 60 STUART $687,867 $525,000 5% $274 -8% 15 15% 65
$ $
MARTIN COUNTY
CONDOMINIUMS | SALES UP FROM PREVIOUS MONTH
Sales rebounded in February, bringing volume to roughly on par with one year ago. Compared with January, sales were up by more than 80%.
Neighborhood Snapshots
*ALL PERCENTAGES REFLECT YEAR OVER YEAR CHANGE. 290K
MEDIAN SALES PRICE AVERAGE DAYS ON MARKET ACTIVE LISTINGS SOLD LISTINGS MEDIAN PPSF ↓ 3% ↑ 271% ↓ 1% ↓ 6% ↑ 349%
63 166 49 226
MEDIAN SALES PRICE MEDIAN PRICE PER SF CLOSED SALES AVERAGE DAYS ON MARKET FEB 23 FEB 22 YOY% CHANGE FEB 23 YOY% CHANGE FEB 23 YOY% CHANGE FEB 23 HOBE SOUND $286,000 $234,900 22% $218 33% 8 300% 42 HUTCHINSON ISLAND $1,050,000 $615,000 -2% $831 4% 32 -36% 112 JENSEN BEACH $319,500 $207,562 54% $218 12% 4 -20% 60 PALM CITY $242,500 $245,000 -1% $218 18% 3 -40% 38 STUART $232,500 $294,500 -21% $199 -12% 26 -19% 75
$ $
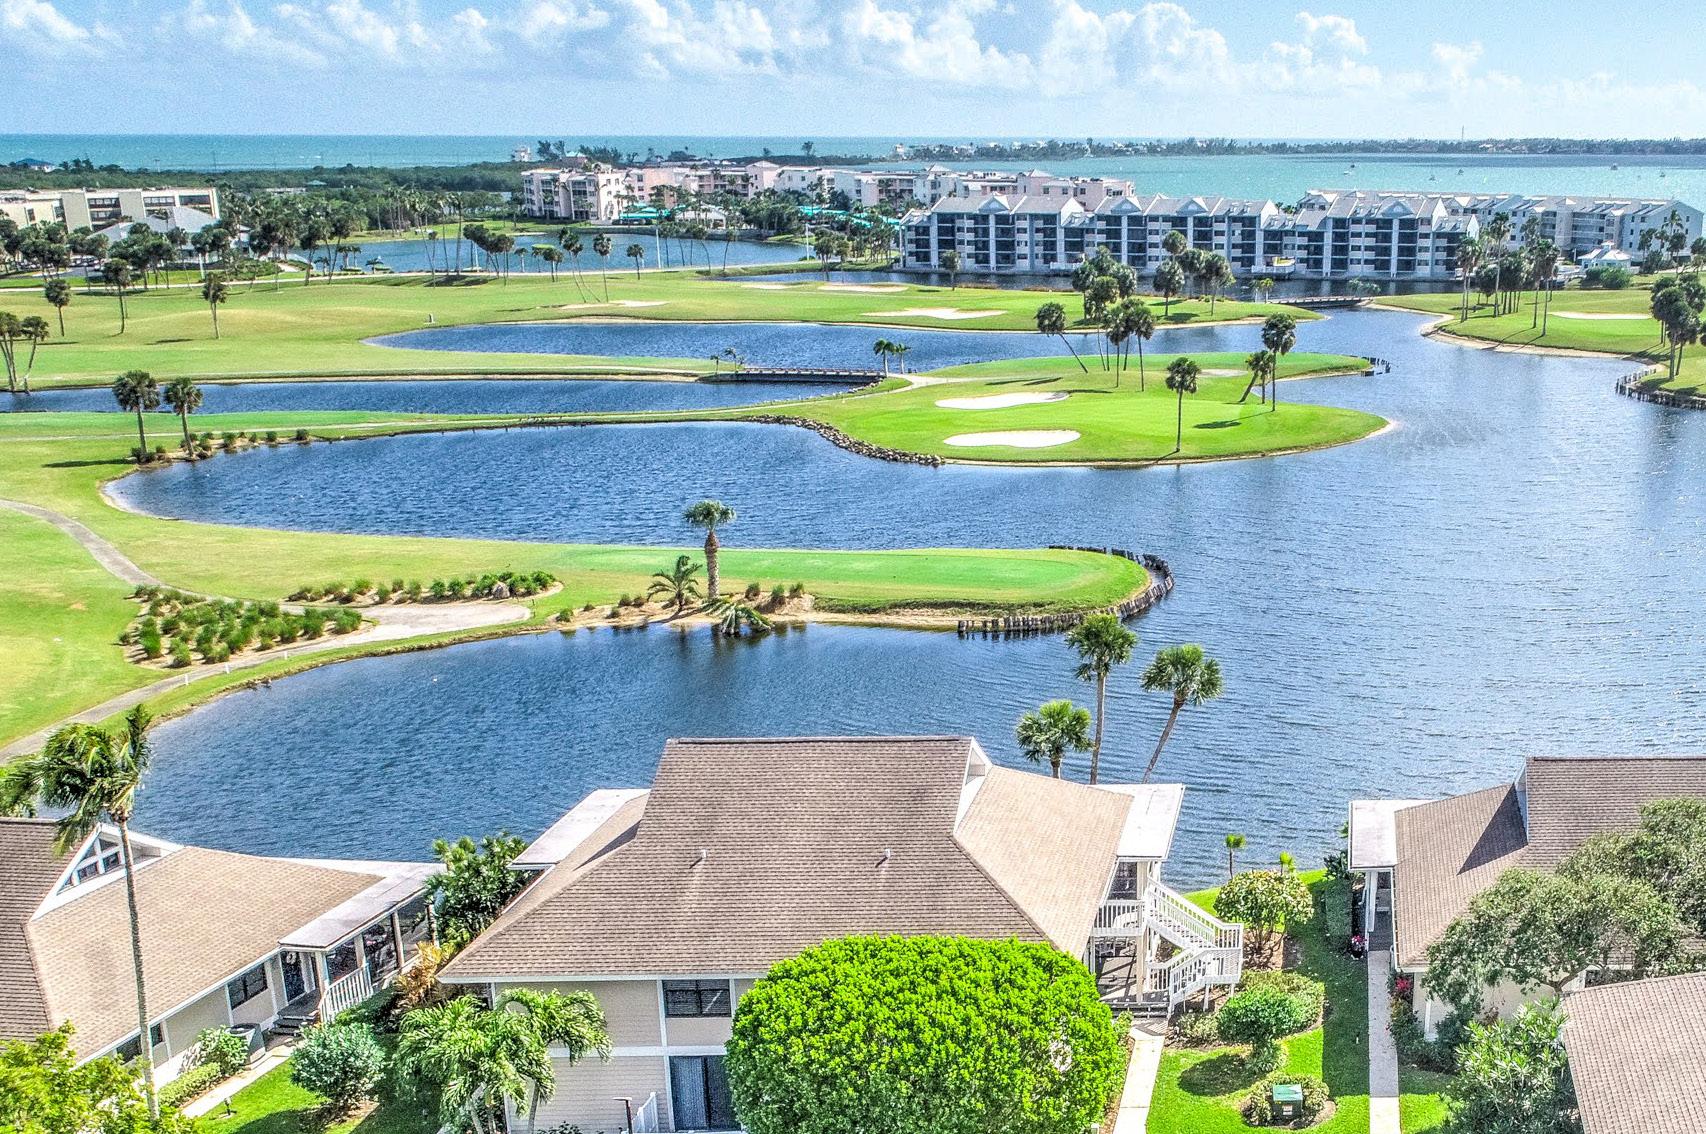
INDIAN RIVER COUNTY
SINGLE-FAMILY HOMES | SALES UP FROM LAST MONTH
While sales remain 10% lower than one year ago, activity increased by 30% from January.

Neighborhood Snapshots
*ALL PERCENTAGES REFLECT YEAR OVER YEAR CHANGE. 362K 72 779 169 226 MEDIAN SALES PRICE AVERAGE DAYS ON MARKET ACTIVE LISTINGS SOLD LISTINGS MEDIAN PPSF ↓ 4 % ↑ 18% ↑ 6% ↓ 10% ↑ 179%
MEDIAN SALES PRICE MEDIAN PRICE PER SF CLOSED SALES AVERAGE DAYS ON MARKET FEB 23 FEB 22 YOY% CHANGE FEB 23 YOY% CHANGE FEB 23 YOY% CHANGE FEB 23 BARRIER ISLAND $1,675,000 $1,175,000 43% $533 15% 17 -43% 110 MAINLAND VERO BEACH $385,500 $356,000 8% $228 9% 74 -17% 79 SEBASTIAN/FELLSMERE $335,051 $320,950 4% $207 3% 33 18% 69
$ $
INDIAN RIVER COUNTY
CONDOMINIUMS | MEDIAN PRICE CONTINUES TO INCREASE
The median price increased further in February, driving the most significant year-over-year increase in the region.

Neighborhood Snapshots
*ALL PERCENTAGES REFLECT YEAR OVER YEAR CHANGE. 307K 70 351 74 213 MEDIAN SALES PRICE AVERAGE DAYS ON MARKET ACTIVE LISTINGS SOLD LISTINGS MEDIAN PPSF ↑ 22% ↑ 35% ↑ 24% ↓ 23% ↑ 323%
MEDIAN SALES PRICE MEDIAN PRICE PER SF CLOSED SALES AVERAGE DAYS ON MARKET FEB 23 FEB 22 YOY% CHANGE FEB 23 YOY% CHANGE FEB 23 YOY% CHANGE FEB 23 BARRIER ISLAND $555,000 $445,000 25% $443 38% 17 -15% 54 MAINLAND VERO BEACH $276,500 $217,000 27% $200 21% 46 -26% 72 SEBASTIAN/FELLSMERE $270,000 $255,000 6% $183 -2% 2 -50% 118
$
$
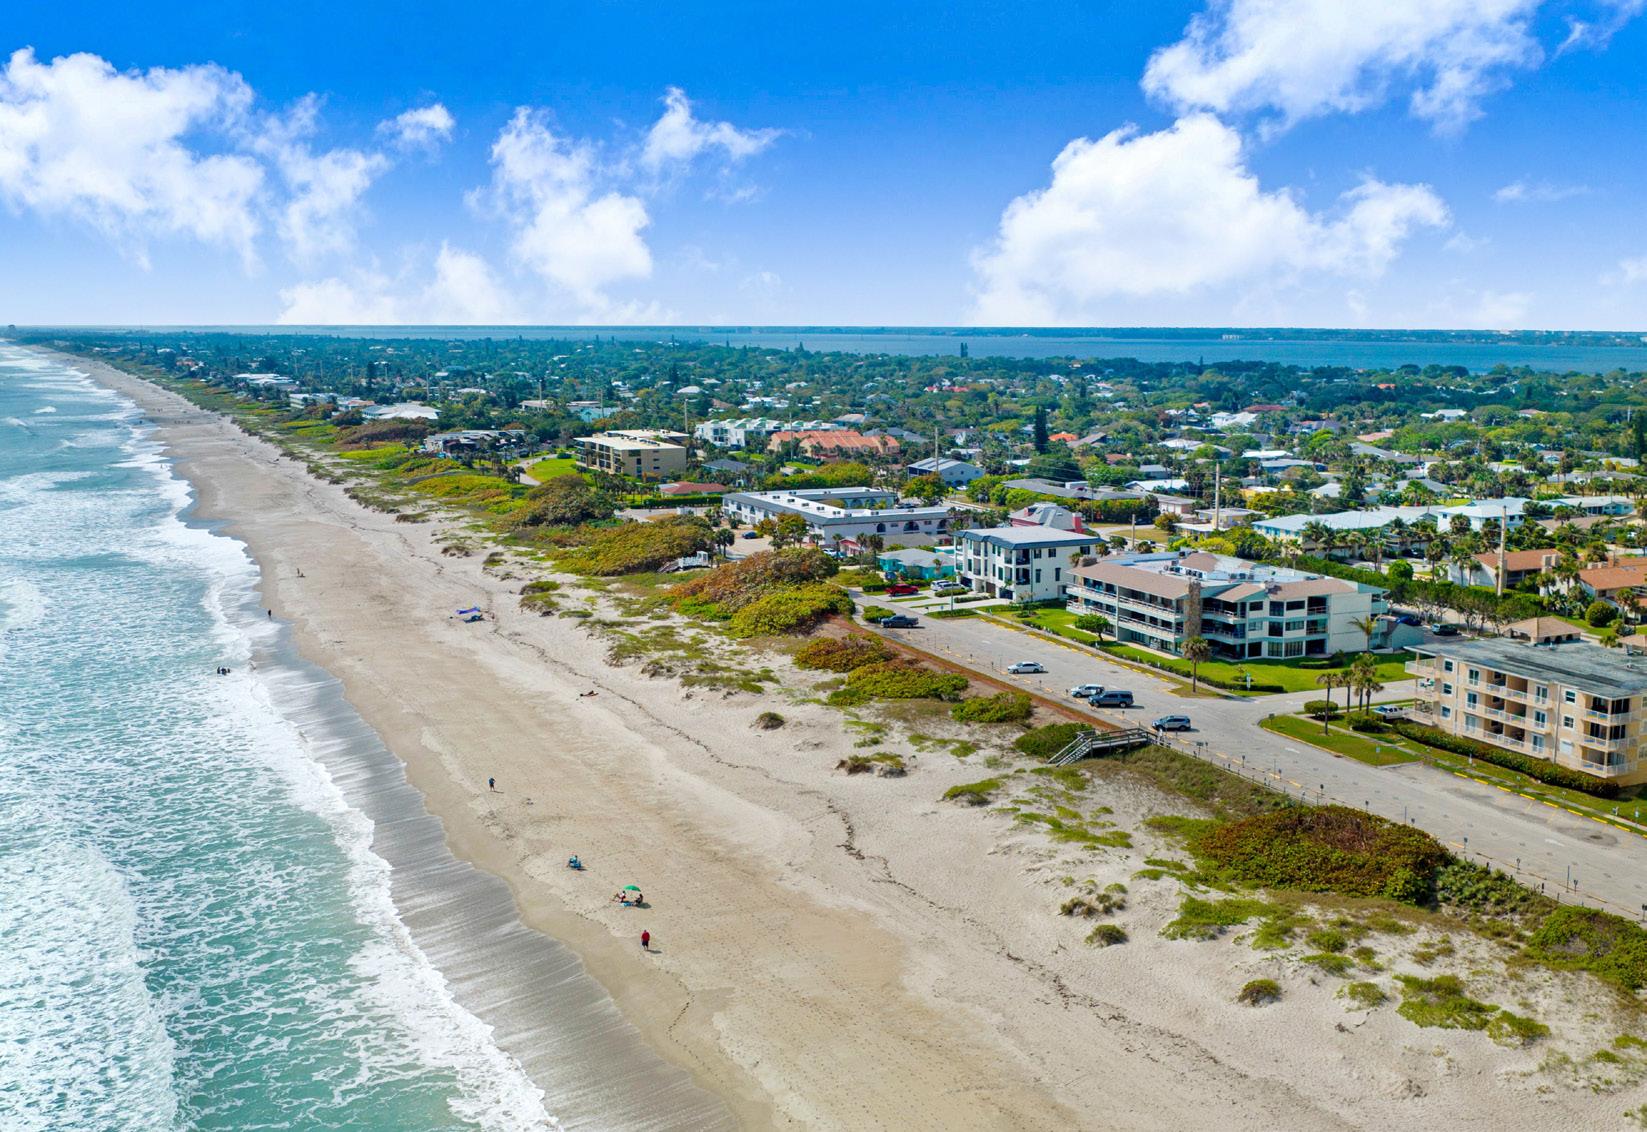
BREVARD COUNTY
SINGLE-FAMILY HOMES | COMPETITION PERSISTS

$
$
199
1,478
MEDIAN SALES PRICE AVERAGE DAYS ON MARKET ACTIVE LISTINGS SOLD LISTINGS
↑ 9% ↑ 119% ↑ 2%
MEDIAN PPSF ↓
8% ↑ 207%
*ALL PERCENTAGES REFLECT YEAR OVER YEAR CHANGE.
350K 46
714
MEDIAN SALES PRICE MEDIAN PRICE PER SF CLOSED SALES AVERAGE DAYS ON MARKET FEB 23 FEB 22 YOY% CHANGE FEB 23 YOY% CHANGE FEB 23 YOY% CHANGE FEB 23 COCOA $325,000 $299,800 8% $193 -1% 77 1% 45 COCOA BEACH $575,000 $837,500 -31% $385 -6% 5 -58% 76 GRANT $511,250 $629,000 -19% $313 14% 6 -33% 104 INDIALANTIC $680,000 $632,450 8% $318 4% 13 8% 37 MALABAR $581,000 $510,000 14% $242 -1% 4 -50% 68 MELBOURNE $355,000 $355,000 0% $220 5% 142 -14% 45 MELBOURNE BEACH $1,250,000 $700,000 50% $567 22% 11 -23% 102 MERRITT ISLAND $470,000 $505,000 -7% $252 9% 47 -16% 51 MIMS $333,540 $487,500 -32% $185 -13% 33 313% 25 PALM BAY $332,083 $303,425 9% $183 4% 234 -10% 48 ROCKLEDGE $359,905 $407,500 -12% $203 -5% 51 16% 38 SATELLITE BEACH & INDIAN HARBOUR BEACH $614,500 $600,000 2% $312 -1% 18 -25% 53 TITUSVILLE $309,450 $299,900 3% $180 0% 50 -35% 43 WEST MELBOURNE $449,900 $412,000 9% $204 -3% 11 22% 38
Neighborhood Snapshots
Sold homes spent the least amount of time on the market in the region, and the greatest share of homes sold at a premium, highlighting that buyers continue to compete.
BREVARD COUNTY
INDIAN RIVER COUNTY TRENDS
CONDOMINIUMS
CONDOMINIUMS | STRONG YEAR-OVER-YEAR PRICE GAINS
Lorem ipsum dolor sit amet, consectetur adipiscing elit. Maecenas sed commodo arcu. Mauris efficitur justo in quam faucibus pellentesque. In hac habitasse platea dictumst.
The median price increased by 16% from one year ago, one of the strongest price gains in the region. The average time spent on market decreased from last month.
Neighborhood Snapshots
*ALL PERCENTAGES REFLECT YEAR OVER YEAR CHANGE. 305K 54 462 133 251 MEDIAN SALES PRICE AVERAGE DAYS ON MARKET ACTIVE LISTINGS SOLD LISTINGS MEDIAN PPSF ↑ 16% ↑ 135% ↑ 14% ↓ 16% ↑ 230%
MEDIAN SALES PRICE MEDIAN PRICE PER SF CLOSED SALES AVERAGE DAYS ON MARKET FEB 23 FEB 22 YOY% CHANGE FEB 23 YOY% CHANGE FEB 23 YOY% CHANGE FEB 23 COCOA $248,900 $255,000 -2% $248 16% 5 0% 26 COCOA BEACH $382,500 $428,500 -11% $313 -3% 20 -47% 58 GRANT N/A N/A N/A N/A N/A - N/A N/A INDIALANTIC $609,500 $575,000 6% $421 -2% 13 160% 115 MALABAR N/A N/A N/A N/A N/A - N/A N/A MELBOURNE $202,500 $156,950 29% $171 9% 18 -10% 38 MELBOURNE BEACH $534,900 $536,250 0% $325 17% 3 -75% 70 MERRITT ISLAND $212,000 $292,450 -28% $144 -33% 2 -67% 16 PALM BAY $300,000 $142,000 111% $154 16% 1 -86% 83 ROCKLEDGE $296,892 $215,000 38% $194 7% 19 27% 44 SATELLITE BEACH & INDIAN HARBOUR BEACH $412,500 $387,500 6% $304 21% 16 14% 59 TITUSVILLE $260,000 $155,000 68% $223 43% 15 36% 55 WEST MELBOURNE $221,500 $210,000 5% $178 1% 4 0% 21
$ $
ST. JOHNS COUNTY
RESIDENTIAL | FEBRUARY SALES ON THE RISE
Sales rebounded in February by 25% from the previous month, though sales volume remained 15% lower than one year ago.

Neighborhood Snapshots
*ALL PERCENTAGES REFLECT YEAR OVER YEAR CHANGE. 426K 86 702 709 233 MEDIAN SALES PRICE AVERAGE DAYS ON MARKET ACTIVE LISTINGS SOLD LISTINGS MEDIAN PPSF ↓ 5% ↑ 121% ↑ 1% ↓ 15% ↑ 34 %
MEDIAN SALES PRICE MEDIAN PRICE PER SF CLOSED SALES AVERAGE DAYS ON MARKET FEB 23 FEB 22 YOY% CHANGE FEB 23 YOY% CHANGE FEB 23 YOY% CHANGE FEB 23 JULINGTON CREEK AREA $525,000 $472,500 11% $229 4% 63 -13% 78 NOCATEE $690,000 $602,450 15% $305 14% 31 -54% 90 PONTE VEDRA BEACH $677,500 $627,500 8% $340 9% 41 -27% 76 SOUTHEAST ST JOHNS COUNTY $540,000 $454,500 19% $336 11% 47 -38% 78 ST AUGUSTINE BEACHES/ANASTASIA ISLAND $341,000 $366,250 -7% $213 3% 67 -13% 92 ST JOHNS $412,818 $472,927 -13% $225 -1% 78 5% 98 SOUTHWEST ST JOHNS COUNTY $422,500 $376,500 12% $226 9% 16 -33% 47 ST AUGUSTINE/VILANO BEACH $467,500 $534,450 -13% $262 4% 26 -41% 89 WORLD GOLF VILLAGE AREA/PALENCIA $408,000 $428,000 -5% $224 4% 107 27% 91
$ $
DUVAL COUNTY
RESIDENTIAL | HIGHER PRICED HOMES SELL
While overall sales were down from last year, sales of homes priced greater than $1 million increased by 45%.
Neighborhood Snapshots

*ALL PERCENTAGES REFLECT YEAR OVER YEAR CHANGE. 298K 74 899 1,029 190 MEDIAN SALES PRICE AVERAGE DAYS
MARKET ACTIVE LISTINGS SOLD LISTINGS MEDIAN PPSF ↑ 5% ↑ 103% ↑ 5% ↓ 30% ↑ 9 %
ON
MEDIAN SALES PRICE MEDIAN PRICE PER SF CLOSED SALES AVERAGE DAYS ON MARKET FEB 23 FEB 22 YOY% CHANGE FEB 23 YOY% CHANGE FEB 23 YOY% CHANGE FEB 23 ARLINGTON/FORT CAROLINE $247,000 $259,745 -5% $179 -2% 86 -34% 69 AVONDALE/RIVERSIDE/ORTEGA $360,000 $390,000 -8% $270 12% 26 -47% 80 BARTRAM $374,950 $325,000 15% $201 8% 24 -29% 58 BEACHES $571,750 $525,000 9% $384 25% 62 -19% 72 BEAUCLERC/MANDARIN $383,767 $394,250 -3% $200 0% 77 -13% 72 DOWNTOWN JACKSONVILLE $164,500 $123,250 33% $151 39% 95 -39% 65 INTRACOASTAL $522,000 $459,220 14% $251 9% 102 -25% 66 NOCATEE (DUVAL) $444,890 $408,500 9% $227 7% 11 -15% 116 NORTH JACKSONVILLE $300,000 $323,245 -7% $173 4% 101 -26% 89 SAN MARCO/SAN JOSE $315,000 $317,500 -1% $214 8% 45 -20% 67 SOUTHSIDE $260,990 $257,250 1% $203 12% 114 -42% 71 WEST JACKSONVILLE $270,000 $262,400 3% $173 3% 227 -27% 79
$ $
CLAY COUNTY
RESIDENTIAL | SALES UP IN FEBRUARY
Sales volume surged by 35% in February, though overall the pace remained lower than one year ago.

Neighborhood Snapshots
*ALL PERCENTAGES REFLECT YEAR OVER YEAR CHANGE. 335K 89 212 240 181 MEDIAN SALES PRICE AVERAGE DAYS ON MARKET ACTIVE LISTINGS SOLD LISTINGS MEDIAN PPSF ↑ 5% ↑ 148% ↑ 4 % ↓ 27% ↑ 28%
MEDIAN SALES PRICE MEDIAN PRICE PER SF CLOSED SALES AVERAGE DAYS ON MARKET FEB 23 FEB 22 YOY% CHANGE FEB 23 YOY% CHANGE FEB 23 YOY% CHANGE FEB 23 FLEMING ISLAND $385,000 $418,000 -8% $201 6% 19 -50% 51 GREEN COVE SPRINGS $328,945 $339,500 -3% $181 0% 26 -16% 98 MIDDLEBURG/KEYSTONE $327,000 $335,000 -2% $185 2% 56 -29% 79 ORANGE PARK $287,450 $295,000 -3% $176 5% 40 -34% 83 OAKLEAF PLANTATION $300,000 $341,918 -12% $177 6% 63 2% 115
$ $
NASSAU COUNTY
RESIDENTIAL | SALES INCREASE OUTPACES REGION
Sales accelerated by 14% in February and increased by 12% from last year. Nassau County was the only county where sales increased.

Neighborhood Snapshots
*ALL PERCENTAGES REFLECT YEAR OVER YEAR CHANGE. 369K 88 215 298 199 MEDIAN SALES PRICE AVERAGE DAYS ON MARKET ACTIVE LISTINGS SOLD LISTINGS MEDIAN PPSF ↓ 11% ↑ 91% ↓ 3% ↑ 12% ↑ 76%
MEDIAN SALES PRICE MEDIAN PRICE PER SF CLOSED SALES AVERAGE DAYS ON MARKET FEB 23 FEB 22 YOY% CHANGE FEB 23 YOY% CHANGE FEB 23 YOY% CHANGE FEB 23 AMELIA ISLAND/FERNANDINA BEACH $608,975 $513,250 19% $323 20% 70 -19% 71 YULEE/WILDLIGHT $345,990 $350,990 -1% $181 -6% 61 56% 79
$ $
FLAGLER COUNTY
RESIDENTIAL | STRONGEST PRICE GAINS IN REGION
The median price increased by 7% compared with last year while pricing fell in most counties in the region.

Neighborhood Snapshots
*ALL PERCENTAGES REFLECT YEAR OVER YEAR CHANGE. 369K 78 409 290 207 MEDIAN SALES PRICE AVERAGE DAYS ON MARKET ACTIVE LISTINGS SOLD LISTINGS MEDIAN PPSF ↑ 7% ↑ 147% ↑ 3% ↓ 17% ↑ 81%
MEDIAN SALES PRICE MEDIAN PRICE PER SF CLOSED SALES AVERAGE DAYS ON MARKET FEB 23 FEB 22 YOY% CHANGE FEB 23 YOY% CHANGE FEB 23 YOY% CHANGE FEB 23 BUNNELL $300,500 $200,000 50% $207 26% 9 80% 124 FLAGLER BEACH $790,000 $445,000 78% $385 42% 11 -21% 53 PALM COAST $370,000 $340,000 9% $198 2% 152 -28% 83
$ $
ONE Sotheby’s International Realty prides itself in being at the forefront of innovation, service, and marketing that push the boundaries within our industry. Our commitment to providing the highest caliber of expertise and dedication sets us apart as we continue to raise the standard of excellence. As real estate’s most trusted brand, our name alone opens the most prestigious doors and creates opportunities to connect sellers and buyers worldwide. That is our mission: to give extraordinary lives a home to thrive.
#1
BEST LUXURY BROKERAGE IN FLORIDA IN 2022 by

Our brand, your advantage Nothing
BEST BROKERAGE WEBSITE IN 2022 by South Florida Agent Magazine
compares.
© 2023 ONE Sotheby’s International Realty. All rights reserved. Sotheby’s International Realty® and the Sotheby’s International Realty Logo are service marks licensed to Sotheby’s International Realty Affiliates LLC and used with permission.
VOTED
VOTED
Luxury Lifestyle Magazine
MOST
LUXURY
ESTATE
#1 Source:
#1
PROFILED
REAL
BRAND IN THE PRESS
Meltwater Jan 2022-Dec 2022 8x AWARD -WINNING MARKETING POWERHOUSE
For unmatched real estate expertise © 2023 ONE Sotheby’s International Realty. All rights reserved. Sotheby’s International Realty® and the Sotheby’s International Realty Logo are service marks licensed to Sotheby’s International Realty Affiliates LLC and used with permission. ONE Sotheby’s International Realty fully supports the principles of the Fair Housing Act and the Equal Opportunity Act. Each franchise is independently owned and operated. Any services or products provided by independently owned and operated franchisees are not provided by, affiliated with or related to Sotheby’s International Realty Affiliates LLC nor any of its affiliated companies. The information contained herein is deemed accurate but not guaranteed.

