
REAL ESTATE ALONG FLORIDA’S EAST COAST
TODAY’S
DECEMBER 2022
TRENDS MARKET REPORT

I’m thrilled to share the December edition of our TRENDS Market Report, providing accessible information to guide our clients with superior insights and a strategic perspective on today’s real estate market across Florida’s East Coast.
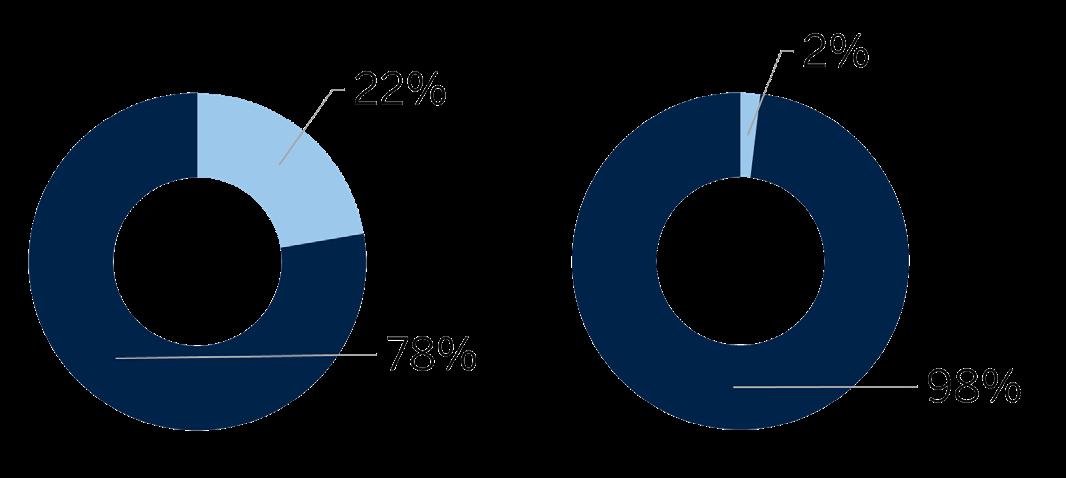
In November, we continued to see that elevated wages helped buyers offset the impact of higher interest rates on housing affordability. Even as buyer demand softened, competition remained stable. Among sales closed in November, 15% of single-family homes and 13% of condos sold at a premium.
We are coming off a historic market boom defined by incredible demand and a lack of inventory, with the market now transitioning to more typical activity levels. Buyer demand remained robust compared to many other high-growth regions in the US, as heads keep turning to Florida’s East Coast for immediate relocation and long-term investments.
ONE Sotheby’s International Realty continues to raise the standard of excellence. Our dedicated real estate associates, outstanding support team, and commitment to providing the highest caliber of expertise set us apart. We are proud of everything we have accomplished together as ONE and are excited about the future as we head into a 2023 full of opportunities.
With gratitude,
Daniel de la Vega President
ONE

ONE Sotheby’s International Realty presents the only market report focused on Florida’s East Coast. From Miami to Amelia Island, data is presented from a macro perspective down to city level.
Data is sourced from local Multiple Listing Service (MLS) organizations. Written analysis created in partnership with the Rosen Consulting Group, a nationally recognized consulting firm and trusted advisor to top public and private real estate operators and capital providers.
Sotheby’s International Realty


The housing market continued to shift as higher mortgage rates and decreased consumer confidence outweighed November’s economic growth. With one of the lowest unemployment rates in the nation, Florida’s strong labor market spurred further wage growth, which provided some relief from the impacts of higher interest rates on housing affordability.
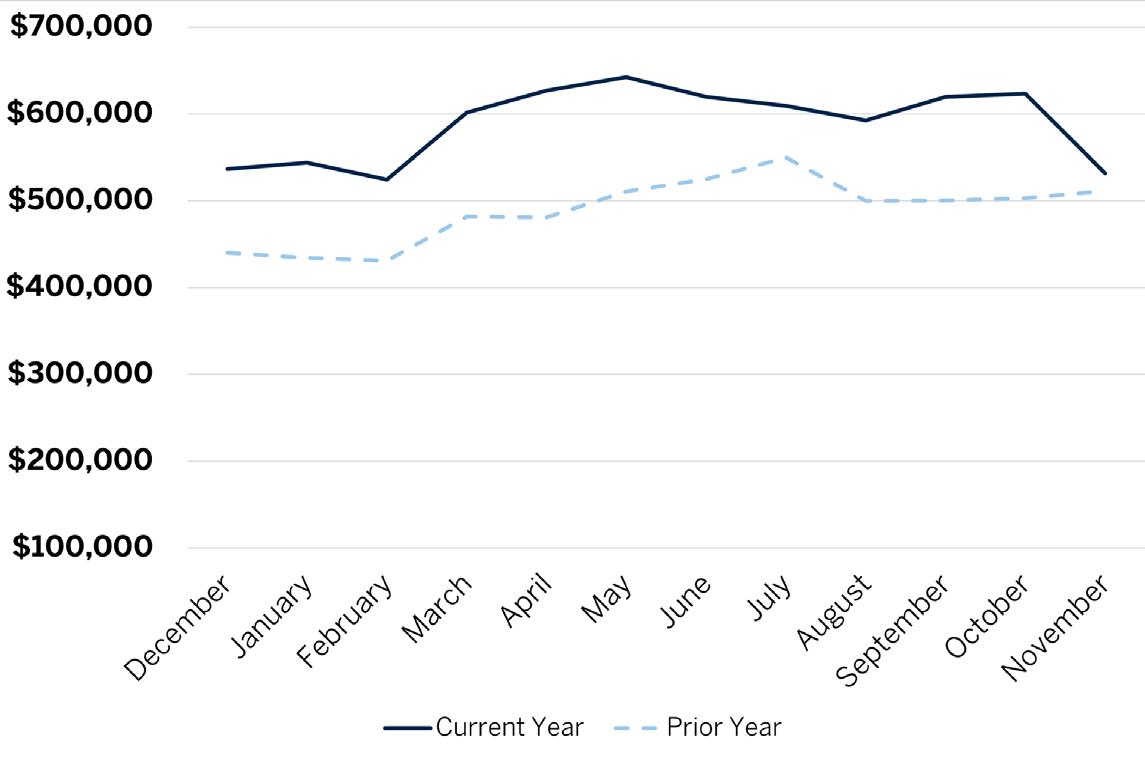
Sales volume decreased in November to less than 9,000 condominiums and single-family homes, reflecting a sales drop of 13% and 19% respectively from October—highlighting buyer variability as rising borrowing costs offset the recent moderation in pricing.
Sales declined throughout all price tiers; however, moderately priced home sales were the most resilient. The most considerable slowdown in sales occurred in the less than $500,000 range, where fluctuations in mortgage rates most heavily impact potential buyers. Compared to last year, sales activity slowed in the upper pricing range. The combination of stock market turmoil and losses in alternative investments, including cryptocurrencies, contributed to a more modest demand for homes and condos priced over $2 million. International buyer activity in the upper price tiers was stronger in November than in the last few years.
FLORIDA’S EAST COAST

Following a surge of new listings in October, for-sale inventory levels increased by only 2% in November. The low inventory of the last two years was unprecedented, with the tightest market conditions in history. The recent increase in listings points to a return to more typical supply conditions. In 2018, for-sale inventory peaked with more than 66,000 homes and condos available, a long way from current conditions.

FLORIDA’S EAST COAST $450,000 0%

While pricing gains slowed in recent months, the median price remained greater than one year ago in a majority of neighborhoods. Compared with 2021, the single-family homes median price was up by 11%, while condo pricing was 8% higher. Even as buyer demand softened, competition remained stable. Among sales closed in November, 13% of condos and 15% of single-family homes sold at a premium. While not eclipsing highs from earlier in the year, more homes sold at a premium than at any point in 2018 or 2019. The average time spent on the market also increased in November yet remains less than two months, indicating that sellers still maintain some leverage in the market.
NOV 22 CHANGE FROM PRIOR MONTH NOV 22 YOY% CHANGE NOV 22 YOY% CHANGE NOV 22 YOY% CHANGE NOV 22 YOY% CHANGE NOV 22
SINGLE FAMILY HOMES 4,293 4% $555,000 9% $902,338 -1% $411 7% 686 -39% $27,828,900 CONDOS 6,775 4% $395,000 13% $662,060 10% $463 9% 1,020 -43% $11,250,000
SINGLE FAMILY HOMES 1,777 1% $355,335 9% $407,105 4% $219 6% 581 -35% $3,250,000 CONDOS 366 5% $289,900 23% $377,386 22% $270 23% 113 -37% $2,680,000
SINGLE FAMILY HOMES 3,692 1% $544,000 11% $701,529 -2% $341 10% 815 -37% $5,500,000 CONDOS 3,911 9% $250,000 9% $335,414 9% $263 13% 975 -34% $5,700,000
SINGLE FAMILY HOMES 759 4% $353,000 0% $452,771 -26% $239 1% 153 -38% $2,575,000 CONDOS 287 25% $340,000 54% $433,478 30% $273 19% 53 -44% $2,250,000
SINGLE FAMILY HOMES 207 2% $664,950 11% $711,138 -6% $324 12% 42 -47% $1,650,000 CONDOS 146 25% $387,000 53% $373,796 -2% $276 12% 33 -8% $683,000

SINGLE FAMILY HOMES 3,885 0% $605,000 11% $947,931 -9% $360 5% 793 -40% $24,000,000 CONDOS 3,154 10% $294,000 12% $428,406 1% $240 5% 686 -44% $5,550,000
RESIDENTIAL 200 -37% $342,995 4% $387,358 15% $190 13% 222 -52% $1,800,000
DUVAL COUNTY
RESIDENTIAL 1,025 -17% $293,500 1% $338,592 3% $202 12% 970 -50% $2,625,000
FLAGLER COUNTY
RESIDENTIAL 285 -27% $379,995 9% $439,579 1% $239 17% 256 -39% $1,550,000
NASSAU COUNTY
RESIDENTIAL 262 0% $428,965 10% $566,674 8% $283 26% 242 -30% $4,500,000
ST. JOHNS COUNTY
RESIDENTIAL 596 -22% $445,253 3% $531,832 4% $289 19% 724 -30% $10,500,000
In the coming year, for-sale inventory should continue to rise as existing homeowners look to take advantage of built-up home equity, and a growing number of investors may capitalize on their investments. Buyers will have more options, leading to fewer competitive bidding scenarios. If economic conditions hold up, buyer demand will persist, potentially leading to a relatively quick rebound in sales activity and pricing.


The total number of homes sold decreased by 20% from October and the average days on market increased by 11%, yet a considerable share of homes sold above the list price. Although the median price was down from last month, it was up by 9% from the same time last year.


MIAMI-DADE COUNTY $902,338 $915,746 14% $411 15% 686 -23% 51
AVENTURA $1,600,000 $2,261,633 -29% $590 13% 1 -83% 60
BAL HARBOUR $27,828,900 N/A N/A $2,303 N/A 1 N/A 1,031
BAY HARBOR ISLANDS $4,750,000 $2,650,000 79% $1,139 19% 1 0% 10
COCONUT GROVE $2,638,000 $2,388,000 10% 994 35% 9 -66.70% 40
CORAL GABLES $2,259,000 $2,131,194 6% $825 28% 29 -41% 57
FISHER ISLAND
N/A N/A N/A N/A N/A - N/A N/A
GOLDEN BEACH N/A N/A N/A N/A N/A - N/A N/A
INDIAN CREEK N/A N/A N/A N/A N/A - N/A N/A
KEY BISCAYNE $4,625,000 $4,040,000 14% $1,326 10% 2 -60% 36
MIAMI $740,526 $711,791 4% $373 9% 329 -37% 49

MIAMI BEACH $5,681,000 $5,001,207 14% $1,595 23% 10 -71% 90
MIAMI SHORES $968,360 $1,358,377 -29% $546 -3% 5 -58% 69

NORTH BAY VILLAGE $1,125,000 $932,500 21% $593 24% 1 -50% 92
PINECREST $2,732,500 $1,976,385 38% $618 4% 9 -31% 57
SOUTH MIAMI $1,149,563 $871,700 32% $544 0% 8 -20% 42
SUNNY ISLES BEACH
SURFSIDE
N/A N/A N/A N/A N/A - N/A N/A
N/A $2,595,000 N/A N/A N/A - N/A N/A
<$500,000 $415,687 $385,658 8% $309 15% 271 -51% 44 $500,000-$999,999 $671,719 $682,813 -2% $368 7% 297 -19% 50 $1MM-$4.99MM $1,825,699 $1,950,228 -6% $658 3% 106 -40% 57 >$5MM $9,443,992 $8,955,792 5% $1,626 -11% 12 -50% 174

Condominiums priced above $5 million did exceptionally well this month, with a 17% increase from last month in sales in that price category.


MIAMI-DADE COUNTY $662,060 $600,613 20% $463 21% 1,020 -33% 61


AVENTURA $717,492 $471,576 52% $393 33% 90 -42% 64
BAL HARBOUR $2,077,143 $1,550,165 34% $1,065 35% 7 -30% 113
BAY HARBOR ISLANDS $1,381,500 $578,968 139% $950 136% 4 -81% 113
BRICKELL/DOWNTOWN MIAMI/EDGEWATER $803,799 $582,128 38% $657 34% 93 -63% 90
COCONUT GROVE $1,511,000 $1,132,000 33% 759 0.10% 22 -51.10% 86
CORAL GABLES $1,099,550 $697,344 58% $513 17% 20 -5% 55
FISHER ISLAND N/A N/A N/A N/A N/A - N/A N/A
GOLDEN BEACH N/A N/A N/A N/A N/A - N/A N/A
INDIAN CREEK N/A N/A N/A N/A N/A - N/A N/A
KEY BISCAYNE $1,499,250 $1,937,420 -23% $974 12% 8 -68% 66
MIAMI $463,750 $469,795 -1% $383 -2% 339 -37% 45
MIAMI BEACH $973,774 $867,732 12% $697 13% 139 -43% 77
MIAMI SHORES
N/A $345,000 N/A N/A N/A - N/A N/A
NORTH BAY VILLAGE $339,273 $344,460 -2% $356 21% 11 -56% 45
PINECREST $690,000 $317,083 118% $370 31% 3 -50% 28
SOUTH MIAMI N/A $240,000 N/A N/A N/A - N/A N/A
SUNNY ISLES BEACH $1,631,071 $1,214,648 34% $720 13% 56 -48% 122
SURFSIDE $3,850,000 $1,740,385 121% $999 15% 2 -85% 175
<$500,000 $308,139 $290,473 6% $321 9% 676 -46% 50 $500,000-$999,999 $688,164 $696,729 -1% $555 7% 222 -32% 72 $1MM-$4.99MM $1,865,319 $1,866,355 0% $935 -7% 108 -39% 100 >$5MM $8,055,214 $9,648,333 -17% $2,078 -9% 14 -7% 158

The share of homes selling above the asking price was 19% in Broward County, larger than in other counties in the region last month. The median price increased by 11% from last year, though decreased less than a percentage point from last month.


BROWARD COUNTY
$701,529 $714,652 6% $341 13% 815 -26% 41

COOPER CITY $691,818 $735,013 -6% $334 10% 17 -26% 39
CORAL SPRINGS $674,032 $586,840 15% $282 14% 54 -44% 40

DAVIE $721,788 $743,117 -3% $321 7% 23 -44% 35
DEERFIELD BEACH $497,205 $514,884 -3% $302 7% 22 -31% 36
FORT LAUDERDALE $950,254 $1,294,825 -27% $449 5% 106 -42% 50
HALLANDALE $673,625 $1,121,242 -40% $382 -6% 8 -33% 152
HILLSBORO BEACH N/A N/A N/A N/A N/A - N/A N/A
HOLLYWOOD $588,751 $531,700 11% $356 14% 73 -34% 33
LAUDERDALE-BY-THE-SEA $1,188,750 $1,363,750 -13% $637 7% 4 0% 46
LIGHTHOUSE POINT $1,501,667 $1,483,261 1% $584 13% 6 -74% 62
MIRAMAR $676,998 $574,362 18% $275 9% 38 -46% 32
PARKLAND $1,143,520 $975,696 17% $345 12% 32 -6% 45
PEMBROKE PINES $592,219 $552,632 7% $318 17% 59 -47% 26
PLANTATION $748,765 $764,409 -2% $314 11% 51 -24% 43
POMPANO BEACH $589,598 $600,150 -2% $351 2% 52 -21% 42
SOUTHWEST RANCHES $2,391,250 $1,544,059 55% $483 10% 8 -53% 68
SUNRISE $466,572 $409,682 14% $300 12% 32 -42% 31
WESTON $1,013,249 $863,875 17% $376 20% 41 -44% 39
WILTON MANORS $935,833 $697,375 34% $531 25% 12 -25% 64
Broward County has the most affordable condominium market in the region, with a median price of $250,000. The average number of days on the market decreased by 12% from last year and the share of condos sold above the asking price was 16%, the highest share among the neighboring counties.


BROWARD COUNTY
$335,414 $307,111 13% $263 20% 975 -22% 43

COOPER CITY $395,000 $354,429 11% $293 24% 3 -57% 24
CORAL SPRINGS $240,311 $204,597 17% $194 8% 38 -19% 31

DAVIE $299,366 $254,389 18% $222 16% 29 -43% 25
DEERFIELD BEACH $246,100 $227,607 8% $203 10% 72 -23% 34
FORT LAUDERDALE $666,105 $543,155 23% $444 27% 118 -49% 58
HALLANDALE $450,108 $320,981 40% $350 27% 63 -30% 57
HILLSBORO BEACH $612,500 $735,975 -17% $613 48% 2 -75% 47
HOLLYWOOD $416,244 $386,366 8% $348 11% 86 -40% 54
LAUDERDALE-BY-THE-SEA $527,967 $653,219 -19% $412 1% 12 -43% 36
LIGHTHOUSE POINT $242,400 $184,533 31% $239 65% 5 -44% 24
MIRAMAR $268,448 $312,593 -14% $256 16% 24 -43% 38
PARKLAND $566,667 $463,333 22% $292 0% 3 -50% 83
PEMBROKE PINES $286,127 $224,690 27% $233 23% 70 -33% 32
PLANTATION $272,448 $248,542 10% $211 5% 29 -49% 47
POMPANO BEACH $361,862 $307,013 18% $269 13% 82 -45% 36
SOUTHWEST RANCHES N/A N/A N/A N/A N/A - N/A N/A
SUNRISE $219,139 $175,818 25% $198 29% 57 -21% 56
WESTON $318,961 $296,072 8% $257 15% 19 -41% 45
WILTON MANORS $333,667 $375,281 -11% $302 12% 6 -63% 24
Homes in Palm Beach County decreased by 5% in price from last month but still had the highest average price in the region.


PALM BEACH COUNTY
$947,931 $1,040,881 16% $360 19% 793 -30% 47

BOCA RATON $1,273,434 $1,184,480 8% $424 15% 121 -40% 40
BOYNTON BEACH $557,215 $491,976 13% $268 12% 120 -110% 36
DELRAY BEACH $1,144,944 $1,635,782 -30% $407 1% 67 -50% 47
HIGHLAND BEACH N/A N/A N/A N/A N/A - N/A N/A
JUNO BEACH $790,000 $1,626,667 -51% $331 -37% 1 -67% 97
JUPITER $1,269,150 $1,679,204 -24% $457 -3% 60 -18% 45
JUPITER INLET COLONY N/A N/A N/A N/A N/A - N/A N/A
LAKE PARK $350,000 $363,500 -4% $217 6% 3 -25% 33
LAKE WORTH $582,969 $489,310 19% $292 19% 70 -53% 45
LANTANA $336,389 $1,007,182 -67% $186 -63% 9 -18% 75
NORTH PALM BEACH $932,857 $2,071,875 -55% $464 -18% 7 -42% 33
MANALAPAN $10,500,000 $18,000,000 -42% $1,533 6% 1 0% 18

PALM BEACH $16,400,000 $20,037,571 -18% $3,072 -1% 4 -43% 123
PALM BEACH GARDENS $1,108,157 $1,143,943 -3% $401 6% 54 -45% 54
SINGER ISLAND $1,600,000 $928,333 72% $775 72% 1 -67% -
TEQUESTA $1,013,833 $2,190,744 -54% $460 -31% 6 -25% 30
WELLINGTON $1,377,742 $1,182,884 16% $377 -6% 38 -54% 76
WEST PALM BEACH $601,358 $622,988 -3% $319 8% 102 -40% 55


The median price increased by 12% from one year ago. While inventory surged, the time it took to sell a property increased by 12%.

PALM BEACH COUNTY
$428,406 $424,169 17% $240 21% 686 -33% 46

BOCA RATON $456,874 $491,898 -7% $251 0% 138 -36% 49

BOYNTON BEACH $299,996 $257,916 16% $190 25% 78 -38% 40
DELRAY BEACH $414,599 $267,505 55% $217 26% 108 -35% 41
HIGHLAND BEACH $1,230,792 $975,786 26% $630 30% 12 -43% 56
JUNO BEACH $650,000 $912,297 -29% $369 -26% 3 -77% 43
JUPITER $610,691 $508,550 20% $373 16% 34 -54% 50
JUPITER INLET COLONY N/A N/A N/A N/A N/A - N/A N/A
LAKE PARK $360,000 $195,533 84% $274 97% 1 -67% 108
LAKE WORTH $210,423 $197,080 7% $150 16% 39 -42% 38
LANTANA $349,000 $397,944 -12% $200 -9% 5 -44% 50
NORTH PALM BEACH $580,893 $676,086 -14% $322 0% 9 -74% 82
MANALAPAN N/A N/A N/A N/A N/A - N/A N/A
PALM BEACH $1,095,000 $2,365,760 -54% $588 -42% 10 -57% 90
PALM BEACH GARDENS $423,382 $572,148 -26% $236 -17% 38 -40% 49
SINGER ISLAND $1,475,000 $1,029,923 43% $629 26% 8 -38% 82
TEQUESTA $403,980 $312,629 29% $261 78% 5 -29% 38
WELLINGTON $539,571 $400,788 35% $323 32% 7 -59% 40
WEST PALM BEACH $290,093 $286,941 1% $166 2% 111 -52% 41
While the median price fell in most neighboring counties compared to last month, the median price in Martin County increased by 2%. The median price was up by 11% compared to last year, maintaining the highest price in the region.


MARTIN COUNTY
$711,138 $758,262 31% $324 16% 42 -25% 52

HOBE SOUND $483,750 $666,759 -27% $308 18% 4 -54% 9
HUTCHINSON ISLAND N/A $4,178,000 N/A N/A N/A - N/A N/A
JENSEN BEACH $406,667 $584,239 -30% $268 -7% 3 -81% 86
JUPITER ISLAND N/A N/A N/A N/A N/A - N/A N/A
PALM CITY $754,100 $731,722 3% $316 4% 30 -45% 48

SEWALL'S POINT $891,667 $1,052,500 -15% $341 24% 3 50% 20
STUART $679,286 $582,500 17% $342 26% 14 -36% 58
<$500,000 $387,308 $340,775 14% $264 21% 13 -46% 50 $500,000-$999,999 $697,752 $668,718 4% $322 11% 21 -54% 64
$1MM-$2.99MM $1,272,500 $1,280,582 -1% $428 14% 8 14% 26

Active listings increased in Martin County while the average days on market decreased from October by 9%. At the same time, the median price increased by 29% from last month and 53% from last year.


MARTIN COUNTY
$373,796 $382,258 44% $276 29% 33 -10% 44

HOBE SOUND $417,500 $270,000 55% $216 19% 1 -67% 17
HUTCHINSON ISLAND $457,500 $930,000 -51% $402 -16% 6 100% 58
JENSEN BEACH $405,021 $190,975 112% $263 53% 12 200% 40
JUPITER ISLAND N/A N/A N/A N/A N/A - N/A N/A
PALM CITY $331,750 $132,000 151% $192 98% 2 -60% 42
SEWALL'S POINT N/A N/A N/A N/A N/A - N/A N/A
STUART $314,909 $367,295 -14% $245 1% 11 -56% 43

<$500,000 $329,212 $229,403 44% $258 32% 27 -16% 47
$500,000-$999,999 $574,423 $549,900 4% $358 -10% 6 500% 28
On average, for homes sold above asking price, the premium was 4% on average, the highest in the region In November.


The median price for condos in Indian River County increased by more than 30% from October and more than 50% from last year.


Despite a slight increase in active listings, homes continue to sell quickly in Brevard County where the average days on market is 30 days.


BREVARD COUNTY
$407,105 $392,275 8% $219 11% 581 -21% 30

COCOA $312,105 $295,423 6% $203 11% 54 -32% 33
COCOA BEACH $1,264,786 $992,550 27% $458 30% 7 -13% 107
GRANT $397,863 $512,990 -22% $193 -26% 10 0% 31
INDIALANTIC $686,557 $639,882 7% $335 20% 7 -63% 30
MALABAR $711,450 $475,557 50% $244 14% 2 -71% 71
MELBOURNE $447,354 $403,802 11% $232 13% 126 -43% 28
MELBOURNE BEACH $787,400 $1,204,942 -35% $357 -27% 5 -74% 26
MERRITT ISLAND $518,020 $496,333 4% $254 -5% 40 -39% 29
MIMS $343,623 $275,714 25% $195 -7% 25 257% 24
PALM BAY $338,471 $289,744 17% $194 11% 207 -19% 28

ROCKLEDGE $430,281 $473,769 -9% $226 4% 28 -50% 29
SATELLITE BEACH & INDIAN HARBOUR BEACH $618,477 $620,271 0% $315 7% 14 -42% 28
TITUSVILLE $335,477 $268,535 25% $199 20% 40 -58% 41
WEST MELBOURNE $463,625 $376,259 23% $222 19% 8 -62% 30

The average days on market was the lowest in the region for condos as well and the average listing price was unchanged from last month. The share of condos selling above the listed price went up slightly in November to 8%.


BREVARD COUNTY $377,386 $309,741 14% $270 11% 113 -27% 36

COCOA $284,578 $276,345 3% $167 -15% 9 -18% 35
COCOA BEACH $518,420 $436,391 19% $384 30% 17 -26% 29
GRANT N/A N/A N/A N/A N/A - N/A N/A
INDIALANTIC $871,800 $527,913 65% $456 54% 5 -38% 44
MALABAR N/A N/A N/A N/A N/A - N/A N/A
MELBOURNE $196,176 $248,190 -21% $183 4% 19 -34% 23
MELBOURNE BEACH $1,819,500 $674,667 170% $429 33% 2 -33% 73
MERRITT ISLAND $226,600 $236,577 -4% $219 30% 5 -62% 11
MIMS N/A N/A N/A N/A N/A - N/A N/A
PALM BAY $224,600 $165,214 36% $186 13% 5 -29% 40
ROCKLEDGE $205,370 $242,079 -15% $197 19% 5 -74% 14
SATELLITE BEACH & INDIAN HARBOUR BEACH $554,000 $423,813 31% $391 34% 5 -79% 35
TITUSVILLE $279,226 $173,153 61% $219 32% 21 11% 51
WEST MELBOURNE $179,000 $206,667 -13% $147 14% 1 -67% 4


Although the median price declined from last month by 8%, pricing remained 3% higher than a year ago. The average number of days on market increased by 8% from October, the smallest increase compared to nearby counties.

ST. JOHNS COUNTY
$531,832 $511,246 4% $265 9% 724 -30% 59

JULINGTON CREEK AREA $527,742 $525,956 0% $227 11% 68 -37% 47
NOCATEE $684,679 $581,583 18% $298 17% 50 -32% 55

PONTE VEDRA BEACH $1,160,291 $927,084 25% $440 25% 42 -42% 48
SOUTHEAST ST JOHNS COUNTY $461,702 $506,998 -9% $302 1% 51 -33% 60
ST. AUGUSTINE BEACHES/ANASTASIA ISLAND $382,187 $355,955 7% $234 10% 68 -14% 56
ST. JOHNS $545,453 $513,212 6% $244 14% 84 4% 79
SOUTHWEST ST JOHNS COUNTY $398,101 $374,922 6% $230 13% 22 -54% 53
ST. AUGUSTINE/VILANO BEACH $653,689 $550,463 19% $333 22% 33 -25% 43
WORLD GOLF VILLAGE AREA/PALENCIA $498,520 $500,596 0%

The average days on market for all homes in Duval County increased to 51 days; however, homes sold quicker compared to other counties in the Northeast region.


CLAY COUNTY
$387,358 $337,265 15% $189 13% 222 -52% 56

FLEMING ISLAND $562,808 $394,362 43% $234 29% 31 -38% 57
GREEN COVE SPRINGS $387,844 $352,190 10% $193 13% 33 -20% 43
MIDDLEBURG/KEYSTONE $346,993 $334,342 4% $194 15% 54 -52% 67
ORANGE PARK $317,413 $296,778 7% $175 6% 24 -72% 44
OAKLEAF PLANTATION $340,362 $325,544 5% $175 11% 31 -65% 67
DOWNTOWN JACKSONVILLE $177,458 $148,421 20% $135 30% 118 -25% 39
INTRACOASTAL $554,392 $420,319 32% $258 26% 138 -28% 36
NOCATEE (DUVAL) $416,851 $389,610 7% $235 23% 17 240% 39

NORTH JACKSONVILLE $328,140 $296,751 11% $181 21% 130 -24% 39
SAN MARCO/SAN JOSE $471,281 $367,859 28% $230 24% 55 -19% 44
SOUTHSIDE $310,568 $279,771 11% $198 17% 158 -36% 30
WEST JACKSONVILLE $283,037 $240,773 18% $178 18% 272 -27% 35


The median price went up by 4% from the same time last year. Even with the higher pricing, 14% of homes in Clay County sold above the asking price in November.


The median price increased by 10% year-over-year, the largest annual increase in the region. However, sales slowed in November, on par with the neighboring counties.


The median price increased from last month by 4% in Flagler County, the only increase month-over-month among neighboring counties.


© 2022 ONE Sotheby’s International Realty. All rights reserved. Sotheby’s International Realty® and the Sotheby’s International Realty Logo are service marks licensed to Sotheby’s International Realty Affiliates LLC and used with permission. ONE Sotheby’s International Realty fully supports the principles of the Fair Housing Act and the Equal Opportunity Act. Each franchise is independently owned and operated. Any services or products provided by independently owned and operated franchisees are not provided by, affiliated with or related to Sotheby’s International Realty Affiliates LLC nor any of its affiliated companies. The information contained herein is deemed accurate but not guaranteed.