
23 minute read
Universities making an impact
EACH YEAR STUDENTS on MSc programmes in analytical subjects at several UK universities spend their last few months undertaking a project, often for an organisation. These projects can make a significant impact. This issue features reports of projects recently carried out at two of our universities: Cardiff University and London School of Economics. If you are interested in availing yourself of such an opportunity, please contact the Operational Research Society at email@ theorsociety.com
THEATRE INSTRUMENT FLOW OPTIMISATION AT THE GRANGE UNIVERSITY HOSPITAL
(Charlotte Marshall, Cardiff University, MSc Operational Research and Applied Statistics)
Grange University Hospital (GUH) is a new Specialised Critical Care Centre hospital in Cwmbran, South Wales which opened four months early in November 2020 within the Aneurin Bevan University Health Board (ABUHB). The new hospital deals mostly with emergencies, so having the correct stock of surgical instrument trays in the theatres is crucial. Charlotte’s dissertation looked at optimising the number of trays which need to be stored at GUH to reduce the number that are not available.
At GUH, there is a set amount of storage where the sterilised and decontaminated trays which hold surgical instruments can be kept. After use these trays are taken to a Hospital Sterilisation and Decontamination Unit (HSDU) to be sterilised and decontaminated before they can be used again, to reduce contamination and infection between patients.
The model Charlotte created takes the mean and standard deviation of the daily demand for each tray and the mean and standard deviation for the lead time (turnaround time) for this tray to estimate the required number. This estimate depends on the service level, defined as the proportion of cases where the stock is sufficient to meet demand. In the model, the service level can either be specified (e.g. we want to be 99% sure we have sufficient stock to meet demand and turnaround variability) or it can be optimised using the model, to maximise the service level across all procedures within the constraint of the maximum storage available in the hospital.
Charlotte’s dissertation highlighted the need for more data to be available for tray turnaround time, demand and whereabouts. This will enable a more accurate estimation of the number of trays needed not just at GUH, but also at the other hospitals within ABUHB.
Overall, the optimisation results showed that there is sufficient storage space at GUH to allow for a maximum average service level of 99.988% for the emergency procedures. However, while this high service level can be achieved, the trade-off between service level and cost of equipment must be considered. If the surgical trays required are not available to be moved from other hospitals, they will have to be purchased. This may mean a large cost in equipment for a small increase in service level.
Trish Chalk, Head of System Planning at ABUHB: “Charlotte’s dissertation has involved the move of emergency and high acuity elective surgery to the GUH. Due to the pandemic the hospital was opened four months early which meant accelerating timescales that had been in place since the project conception. Charlotte’s work enabled the Division to test and understand if the planning assumptions made for Theatres were correct and if any immediate remedial actions were going to be required.”
Terry Watkins, Senior Programme Manager at ABUHB: “When Charlotte joined the division, in the middle of the Covid 19 Pandemic, she very quickly identified the need to standardise trays because of the various types of procedures carried out on different sites by different surgeons who had their specific instrumentation. This was a pivotal development in the analysis and allowed the teams to significantly reduce the storage space required at the new hospital.
Charlotte’s work has allowed us to evidence the changes needed to change the layout and storage configuration and also secure the funding for the new system. Charlotte’s work has been highly valued and formed an important analysis: without it we could have been in a very different position which would have affected service delivery.”
MEASURING TEAM DISRUPTION
(Mohammed S. Agha, LSE, MSc Operational Research and Analytics)

The LSE Operational Research and Analytics Masters programme has a long-standing and valued relationship with Satalia, which has regularly hosted summer consultancy projects and employed several of its graduates. Satalia is a thoughtleader in AI, pioneering the future of work by combining technology with organisational psychology to create swarm-like organisations and many of the projects that students have worked on involved the development of novel approaches to the challenges Satalia’s clients are facing. In this case, the focus was on the potential use of social network analysis and data science to measure and minimise disruption to high-performing teams.
Mohammed’s project explored two specific questions that arise when members exit a team: who are the critical members that may disrupt the team when removed, and what is the effect on the team when certain members are removed? The analytical approach, the use of a synthetic network generator for testing, and results are described in detail in a Satalia Blog post (see http://bit.ly/ SataliaBlog).
LSE students who wish to apply for a particular project submit their applications to the LSE Projects Coordinator who compiles a shortlist of candidates for each client to choose from. Mohamed was shortlisted and subsequently selected because his application showed good insight into the problems, because he had demonstrated the necessary technical abilities, and because his background, and motivation and character matched the needs of the project. The core was the application of methods taught on the course but exploratory projects like this one demand much more of the student than technical skills, especially when they must be delivered completely remotely due to COVID restrictions. The student must have the ability to succeed and be self-starting, but also have the confidence to take on a project where there is no predetermined methodology and which might, through no fault of their own, fail to produce a positive outcome.
Laura Weis, Satalia’s project supervisor said:” Both our students this year were extremely professional and reliable and coped well with the complexity of their projects and some of the challenges we faced with regards to providing them with data. Mohammed’s experiments confirmed the usefulness of a wide variety of network metrics in measuring and preventing disruption and there are valuable results we could build on in further projects. We were pleased to hear that he received a Distinction for this part of his degree and wish him well for the future”.
The open brief had initially given Mohammed pause for thought, but the Satalia team had given a talk to students earlier in the year so he knew who he would be working with, and that they had a track record of successful projects with LSE. He commented “The project offered me a great chance to work with advanced techniques on real problems and test my analytical thinking and decision making. There were inevitably moments when we seemed to be going backwards instead of solving the problem, but I am really pleased with the way the project eventually worked out”.
The aim of the projects on the MSc programme is to develop and test the consultancy and project management skills taught on the course as well as the students’ technical ability. This is demanding on the students and on the LSE’s supervision team, who coach and mentor them through the project. However, LSE believes the result is a more rounded and more employable graduate who has demonstrated more than technical competence. Mohammed is now building his career in the UK as an optimisation practitioner.

© Viacheslav Lopatin/Shutterstock
SECRETS OF SUCCESS WITH LOAN PRICING OPTIMISATION
BARRY HONEYCOMBE AND MARC DROBE
HERE WE EXAMINE HOW LOAN PRICING OPTIMISATION WORKS and how it prompted a 29% increase in new sales for Home Credit Russia. Financial organisations looking to achieve their portfolio goals in these difficult times should investigate loan pricing optimisation. Increasing your precision around pricing can virtually guarantee a significant boost in profitability, without a massive IT project. A good example of this comes from Home Credit Russia, which operates across three continents, mainly in markets with high growth potential. Petr Kapoun, Chief Risk Officer at Home Credit Russia used optimisation to achieve remarkable results: a 26% rise in portfolio profit and a 29% increase in new sales.
WHAT DID HOME CREDIT RUSSIA WANT? The overall objective for Home Credit Russia was for its portfolio management to maximise profit within
defined constraints. Its initial target was set to achieve a minimum 10% increase at constant risk costs. Due to local regulations and potential impacts on regulatory capital, it also needed to control risk weighted assets as linked to interest rates threshold.
Another core objective was to increase transparency and manageability. Home Credit Russia was looking to reduce complexity in parameters used for limit calculation. It wanted to move from risk based to risk and revenue-based pricing.
The strengths behind loan pricing optimisation platforms were clear to Petr Kapoun and Home Credit Russia. Results can be achieved within a few months, there is no need for lengthy IT projects or long-term planning. Whilst optimisation can be deployed as a real-time process, the best practice in banking and financial services is to create the chosen strategies in an off-line planning environment, taking account of the portfolio and accountlevel constraints and determining a preferred scenario that meets the bank’s strategic objectives. Once this scenario is stress-tested to understand how it will hold up under a number of different economic scenarios, it is then output in a format that can be easily available for real-time deployment in the bank’s existing systems. This approach ensures minimal IT integration.
This was particularly important given the financial climate faced in 2020 and beyond, brought on by the pandemic. With resources already stretched thin, it was crucial to Home Credit Russia that the on-boarding and activation process for new accounts was streamlined and smooth.
THE TRADITIONAL APPROACH In loan pricing optimisation — as, indeed, in any decision modelling and optimisation project — the traditional approach to formulating a decision strategy gets flipped around. The traditional approach, illustrated in Figure 1, starts with the known and available information, e.g. credit bureau data, demographic data, customer application data, and the predictive models that assess factors like response likelihood or risk level. Typically, the segmentation of the applicant universe into different tree branches, and the assignment of actions to each end node, is done judgmentally.
Once implemented, the results of this strategy can then be measured along the defined KPIs, typically using metrics such as revenues, losses, costs, and capital.
The problem is that there is a universe of possible decisions for each customer, and thousands of possible alternative strategies that cannot be evaluated within traditional champion-challenger approaches. In the example above, there are the price, amount, term, and accept/ reject decisions where each customer only gets one decision per category. However, the decision being made in constructing a decision strategy has multiple facets - where to set the cut-off, how to segment, which action to assign to which segment – and is multi-dimensional, as risk, revenues, take-up, etc. all need to be considered. For expert strategies, these are essentially estimates supported by unidimensional predictions.
WORKING BACKWARDS FROM THE OBJECTIVES Rather than start from the data on the left and work toward the outcomes on the right, in optimisation we start with the objective and work backwards, as shown in Figure 2. The overall objective of a retail lending strategy is typically to maximise profit, but there can also be secondary goals, for example portfolio growth, keeping the accept rate constant, or reducing the loss rate.
With decision modelling and optimisation, the starting point
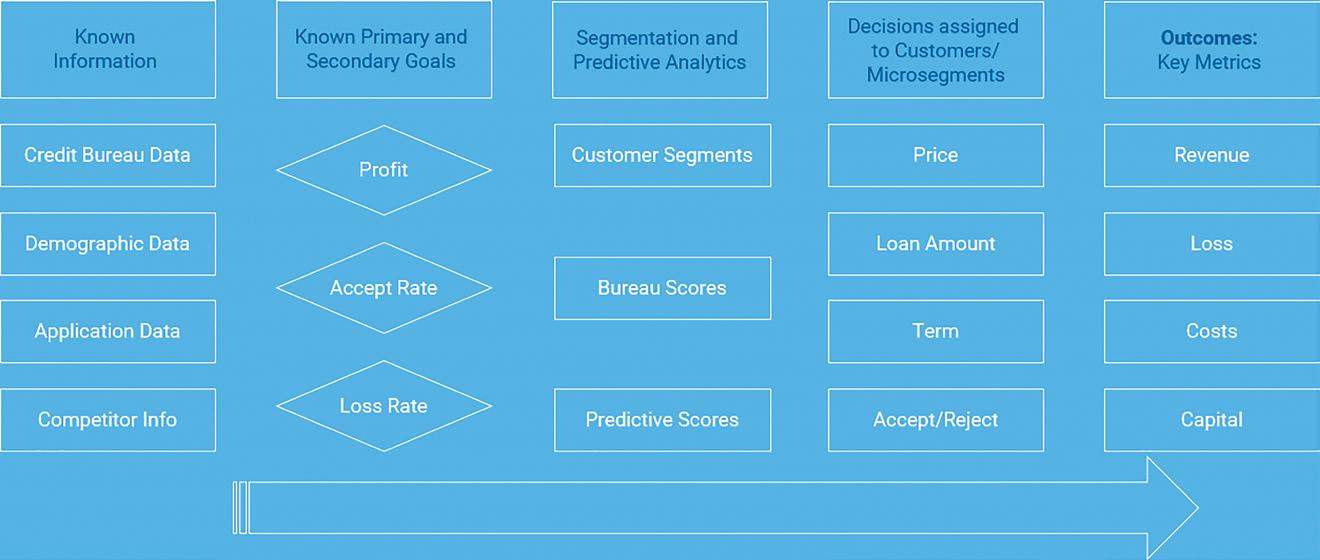
FIGURE 1 THE TRADITIONAL APPROACH
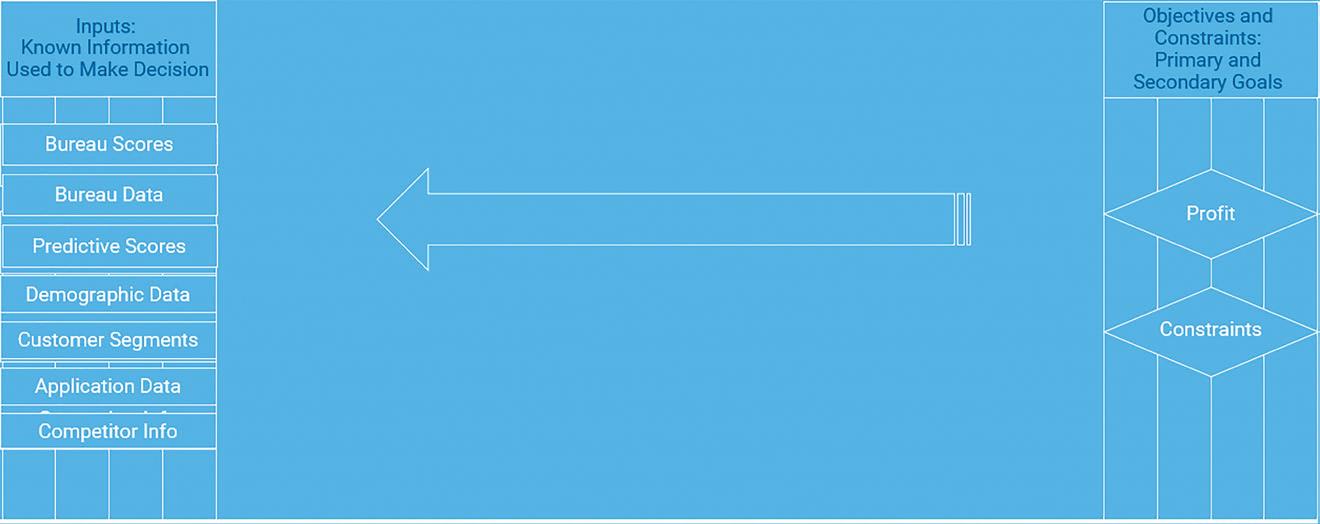
FIGURE 2 THE DECISION MODELLING APPROACH
includes some known information. But rather than working from left to right, where objectives are present and strategies designed to achieve these goals, the process moves from right to left. It is then possible to define the key metrics that are driving the objectives and constraints can be calculated and measured.
At this stage, rather than segmenting the portfolio and assigning one action, within the decision modelling and optimisation framework it is important to look at all possible actions that can be taken for each customer. Key aspects are action-effect models, which encode the relationship between a given action and the likely response, that are built into the solution. This provides the basis for optimisation algorithms to search through a gigantic space of possible alternatives in a way no person developing a strategy ever could, identifying optimal decisions for each customer.
ASKING THE “WHAT IF” QUESTIONS The optimisation framework enables greater collaboration between the data scientists and the business manager. This is especially useful when you need to rapidly project the results of scenarios in which certain variables or segmentation criteria are changed.
The typical question a portfolio manager will ask is a what if – such as what is the impact on my portfolio if I change my strategy? In this example, we are using pricing decisions that drive revenue, but also need to consider price sensitivities that impact take-up and volume.
For the business as usual (BAU) strategy, i.e. what if I keep the same pricing, certain data should be immediately available: number of applications, approval rate, take-up rate, average loan amount, etc.
What should also be known are the constraints that are defining the action space, i.e. the ‘room’ in which alternative strategies may be found. These can be regulatory constraints, such as capital; business constraints, such as funds available; or management guidance, such as ‘keep the market share’. No financial institution is operating in a completely unconstrained environment.
So the question becomes, given that I have different, competing objectives, what is the impact on my KPIs if I move away from BAU and:
• Maximise net interest income (NII)? • Maximise origination volume? • Can I increase both?
As you see here, the BAU strategy is our starting point, to which we are comparing different scenarios where we have optimised within the scenario parameters, or constraints.
So, let’s look at the first question: what if I maximise NII? What is the most we can increase it by, and how much origination volume must we give up to achieve this? As you can see in the scenario shown in Figure 3, the NII will increase by approx. 20%, but origination volume will drop from 12 to 10.5 million.
On the other end of the scale, maximising origination volume, we see a substantial drop in NII.
All other points on the efficient frontier here are representing operating points balancing NII and originations volume to different degrees, constraining the origination’s volume.
In addition to answering the “what if?” questions through a process of simulation, we combine this with optimisation scenarios which tell us what action, in this case pricing, we need to deploy to achieve a given level of profit within our constraints. The combination of simulation and optimisation scenarios and subsequent comparison enables the business user, such as Home Credit Russia, to determine their preferred strategy that meets the goal of the business within the constraints.
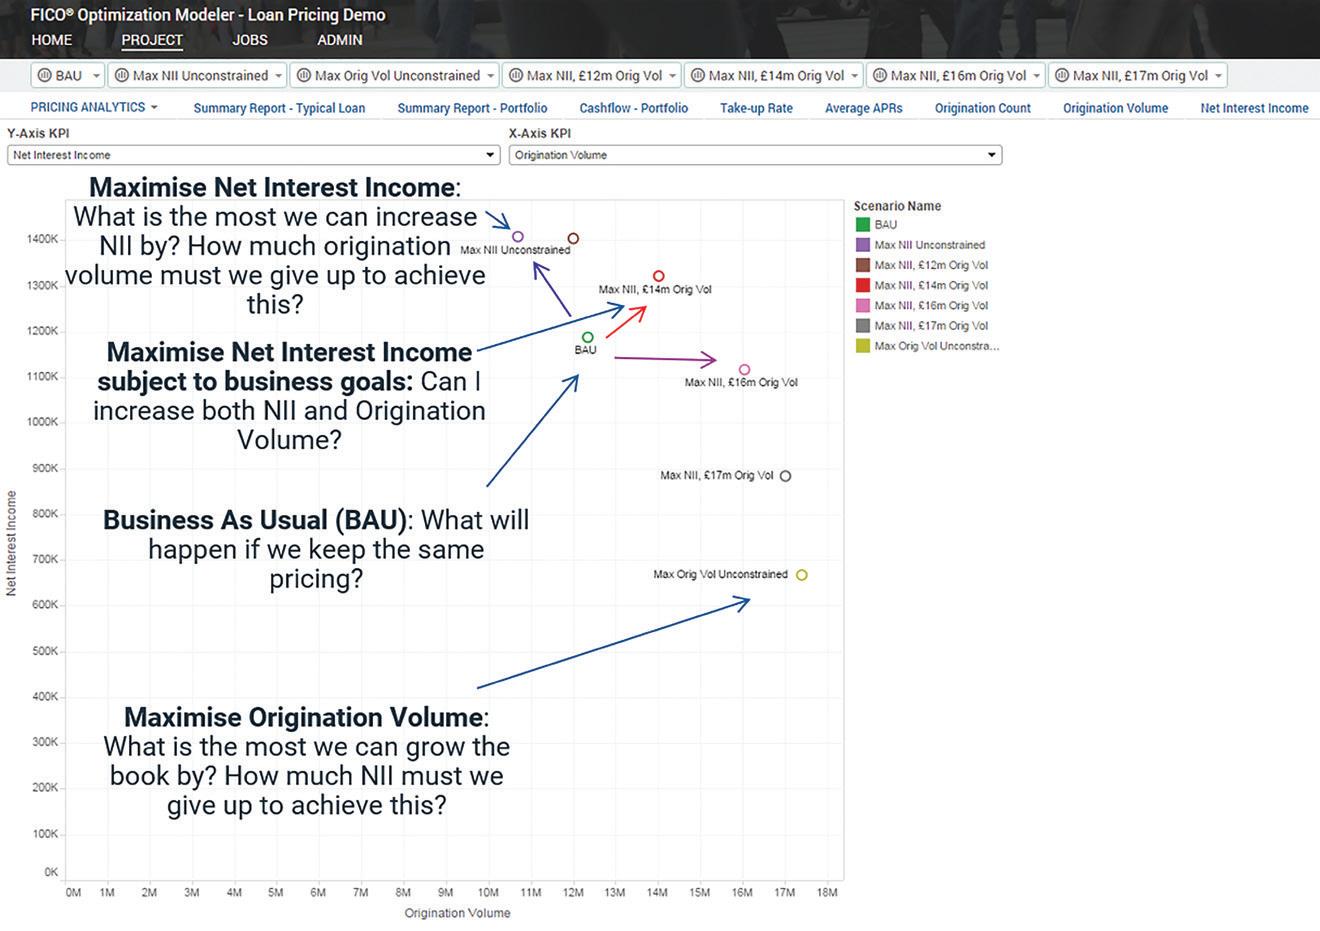
FIGURE 3 FICO OPTIMISATION MODELER, LOAN PRICING DEMO
RESULTS AT MULTIPLE LEVELS The results speak for themselves. Home Credit Russia has used FICO optimisation to achieve remarkable results: 26% increase in portfolio profit and a 29% increase in new sales.
In addition, Home Credit identified loss making pockets in the portfolio that had been accepted before due to lack of granularity. Scenario analysis allowed them to deeply understand trade-offs, e.g. volume, interest and take-up rate.
Kapoun said: “Activating the loan pricing optimisation framework has truly benefitted Home Credit Russia. There are two main reasons for this. Everyone faced a disruption or change to their financial position in 2020. From job losses to payment holidays, there was so much activity it would have been extremely difficult for us to provide the same level of service our customers expect. Optimisation crunches the numbers, inputs all the factors, and produces the correct offers.”
Optimisation establishes a clear structure where there have been many overlapping policy rules, different pricing tables, and difficult simulations of what happens if Home Credit Russia does change its policies. Kapoun and Home Credit also found that optimisation helped identify where the business can use analytics expertise to deliver significant business impact.
With FICO’s optimisation tools, Home Credit began to see the benefits in its various teams and overall optimisation should usher in further cooperation. Business and risk will work together to find the best trade off, discussions are driven by data rather than assumptions, and there is more of a forward-thinking mentality.
It appears that there has never been a more pertinent time to adopt loan pricing optimisation tools and platforms within financial organisations. With COVID came new working strategies, a plethora of changes to financial agreements, and confusion. But it is clear that COVID and its aftermath will linger for years, even once the vaccine has been globally administered.
With optimisation, all of the relevant parties at a lender come together quickly and efficiently to understand how their objectives can be managed together with a common objective based on fact rather than assumptions.
For more information on decision optimisation and the Home Credit Russia case study, check out the video recordings of a roundtable webinar with Petr Kapoun and FICO’s Marc Drobe and Barry Honeycombe here: www.fico.com/blogs/loan-pricingoptimization.
Barry Honeycombe is a principal consultant at FICO, responsible for optimisation solutions delivered to clients across Europe, Middle East & Africa. He has more than 25 years of experience in applying advanced analytics across the customer lifecycle including marketing, pricing, customer retention and collections.
Marc Drobe is a principal consultant at FICO with 30 years of experience in various roles in the financial services industry. Marc is a trained banker and has worked both in line positions as a risk manager and in consulting positions advising customers on risk and revenue management. In his current position at FICO, Marc is advising customers on designing and implementing solutions based on the FICO Decision Management Platform, including decision modelling and optimisation.

© Image courtesy of the Department for Transport.
CREATING NOVEL MOBILITY INSIGHTS IN A NATIONAL LOCKDOWN
JORDAN LOW AND SAM ROSE
PRIOR TO THE PANDEMIC, more people than ever were travelling for work and leisure. Now though, it can be hard to remember a time when commuting into the office was commonplace and seeing other people involved deciding on where to meet, not which video conferencing software to use. For over a year, coronavirus restrictions of some form have guided where the UK public can travel to and who we can see when we get there. So at some point you might have been curious whether this stay-at-home guidance was being followed on a large scale, what effect it has had on patterns of movement and commuter habits, or what sorts of events or occasions might make it more or less likely that people will travel?
These questions might simply be interesting to most people, but for
those making critical decisions they’re essential information. Whenever decisions like the coronavirus travel restrictions are planned or implemented, decision makers want and need to monitor and understand their impact so that, if necessary, changes can be made.
Where the coronavirus travel restrictions differ from many transport policy issues however, is that every mode of travel is affected, and we needed to know what was happening in near real time. Near real time mobility data across all modes wasn’t something which the UK Government’s Department for Transport (DfT) had been faced with before and so we needed a new approach.
UNDERSTANDING MOBILITY IN NEAR REAL TIME Many openly available sources that are now online were not openly available at the start of the pandemic and were not representative enough for these purposes as they looked only at specific groups of people. Instead, DfT worked with O2 Motion to access data from the mobile phone network, which had not previously been used for this purpose in government. (NB. All data, insights and trends throughout are anonymised and aggregated, never allow identification or mapping of individuals, and operate within strict privacy guidelines). This data is anonymised and aggregated to local authority level. We then looked at other existing data sources such as the Office of National Statistics (ONS) census information and the resulting dataset formed the basis for a range of analysis and insights to support aggregated mobility monitoring both during and after each lockdown, as well as enabling deep-dives into regional issues. Within days this became a daily reporting function alongside other leading indicators for individual transport modes that supported the monitoring and decision making in government.
On 23rd March 2020, the UK entered lockdown. From our first look at the mobile telecoms trip data on the same day, the department’s Analytics Unit paused existing project delivery and put out the first mobility insights pack to the operations teams working on the pandemic less than 48 hours later. The starting objective of this work was simply to understand patterns of national mobility, so these daily packs included the total trips being undertaken both across the UK and in geographical areas, benchmarked against typical trip levels from before the pandemic. Figure 1 is representative of charts included in these packs, showing changes in total mobility compared to pre-pandemic levels, which were later produced for different trip purposes and geographical areas (axis removed for publication). During the height of lockdown, road travel dropped by over 75%.
DEVELOPING CRITICAL ANALYSIS It rapidly became clear however that the dataset presented additional utility beyond these high-level measures. A close working relationship between the O2 Motion team and the DfT enabled additional datasets to be brought online as the project expanded, including hourly data to help understand the potential pressures on public transport at peak times, insight into commutes and leisure trips in travel patterns, and critically an Origin-Destination matrix, which provided mobility information not readily available from any other source. This became particularly important when England moved to a tier system and there was a requirement to look at cross border travel and identify potential future hotspots.
Throughout lockdown the team continued to develop new insights through linking these new data sources to existing Government data both

FIGURE 1 AN EXAMPLE OF CHARTS PRODUCED TO SHOW THE IMPACT OF A NATIONAL LOCKDOWN ON POPULATION MOBILITY © Crown Copyright, DfT
nationally and regionally as well as additional open source data when it was available. Through the mobility data, we could investigate connectivity between hot spot areas and the rest of the UK. As cycling became more prominent in how people might travel, we linked total mobility estimates with other modal data to derive cycling estimates. This later became a new daily cycling series, which had not previously been created. And by bringing in more ONS census data we could move into predictive analytics, looking at key workers and shopping habits to estimate expected levels of mobility under key policies. Up to 32 different analytical products were being produced at peak, over four main areas, some of which are listed in the panel. As cycling became more prominent in how people might travel, we linked total mobility estimates with other modal data to derive cycling estimates
A COMPLETELY NEW WAY OF WORKING To enable rapid working against the intensely demanding timescales of the pandemic crisis, the team developed new ways of working on top of the already challenging move to remote working. Each time new analysis, data series or products were developed the team were quick to automate these and continued to improve them throughout. Enabled by shared software, we were able to ensure resilience by alternating who worked on each task and through regular updates. Normally the Analytics Unit’s shortest projects last weeks to months, so this represented a completely new way of working for many in the team.
FAR-REACHING IMPACT This work has produced evidence to support monitoring and decisions as the crisis has unfolded. But in addition, while meeting the mobility information needs of the crisis, the team has ensured that the benefits of improved insight into mobility will be sustainable, meeting the longer-term needs of Government and
A WIDE RANGE OF ANALYTICAL PRODUCTS The tempo of working, repeated needs from central government, and the department’s access to anonymised, aggregated insight from mobile telecoms data meant that at peak periods, the team were producing up to 32 different analytical products daily and weekly for different purposes, highlighting the range of possibilities that this sort of data presented. Products included:
Daily mobility updates
Looking at big trends in national mobility to answer questions on how mobility is changing as a result of lockdown, and throughout restart, as well as more focussed analysis on geographic areas and times of day.
Predictive Analytics
These products answered questions on what effect on total mobility should be expected due to the lockdown, so that this can then be compared to insights coming from the daily updates, and areas or times which were different than estimated can be identified.
Local lockdown connectedness
We also provided analysis for planners, identifying potential areas for future outbreaks and looking at how people are moving at different times of day.
Cycling
Data on trips by bicycle in near real time has not previously been available on a regular basis, but by combining the mobility data with other available sources the team derived a measure for the change in usage.
highlighting what is possible with this sort of data. We continue to work with stakeholders across the department to identify new areas where this data source can be used and with wider Government on how to source and use data like this in the future.
Feedback has demonstrated this wide-ranging impact, as “The support provided to us has been incredibly useful in understanding how patterns of movement have changed during the course of the pandemic which has informed decision making… and has provided an important source of quality assurance on mobility trends from other new sources or novel methodologies”.
Fundamentally, this project has meant that the DfT and wider Government have been able to support the UK community with more evidenced based decision making, furthering their use of new and innovative data sources and supporting a more robust response to what is the largest National Emergency in decades.
Jordan Low is a senior operational research analyst within the Department for Transport’s Advanced Analytics Division. Sam Rose is Deputy Director of Advanced Analytics and Head of Profession for OR in the Department for Transport.
This work was awarded the OR Society’s President’s Medal in 2020.
© Crown copyright 2021, DfT. This material is licensed under the terms of the Open Government Licence except where otherwise stated. To view this licence, visit http:// www.nationalarchives.gov.uk/doc/ open-governmentlicence/version/3 or write to the Information Policy Team, The National Archives, Kew, London TW9 4DU, or email: psi@ nationalarchives.gov.uk.
