DETERMINING OPTIMAL PRICE REDUCTIONS
Mathematical optimisation supports Tesco’s pricing strategy

SUPPLY CHAIN DESIGN
Analytics gives cost and CO2 reductions and resilience
SIMULATION WORKS FOR CRIMESTOPPERS

Staff wellbeing improved through better rotas
PHARMA FACTORIES
Analytics evaluates factory capacity requirements

SPRING 2023 DRIVING IMPROVEMENT WITH OPERATIONAL RESEARCH AND DECISION ANALYTICS ©
Tesco


EDITORIAL
Welcome to the seventeenth issue of Impact. Since 2015, our aim has remained the same: to show how effective O.R. can be for the benefit of organisations from the most diverse sectors (and for the ‘greater good’!). In this issue, you can read about how the not-for-profit organisation Crimestoppers has employed simulation to model their operations more realistically, better control staffing decisions and provide ongoing guidance to their management team on a daily basis.
The flavour of this issue is a ‘classic’ one: O.R. in logistics and supply chain management. Neil Robinson demonstrates how Vehicle Routing Problems remain very relevant to this day, whilst discussing key factors that differentiate ‘today’s VRPs from those of yesteryear’. Emile Naus analyses real world challenges in designing supply chains and Tesco’s article talks about how O.R. can help to take a closer look at the options available near the end of a product’s life.
Brian Clegg reports on some of the best practices (e.g. Knowledge Transfer Partnership projects) through which academia and industry can jointly exploit the potential of O.R. He illustrates this through the work done at the PARC Centre in Cardiff. GSK and Decision Lab also highlight the crucial role of crossorganisational collaboration in developing modelling and analysis methods that can quickly scale to a range of processes within the same industry (pharma).
On becoming the new editor, I cannot thank Graham Rand enough for bringing this title to life almost a decade ago, for his brilliant editorial work over the years, and, more personally, for his immense patience with me during the handover process. Thanks also to Carol McLaughlin at the O.R. Society and Katie Johnson at Taylor & Francis for the equally fantastic support during my ‘initiation’.
I hope you enjoy reading this issue.
Maurizio Tomasella
The OR Society is the trading name of the Operational Research Society, which is a registered charity and a company limited by guarantee.
Seymour House, 12 Edward Street, Birmingham, B1 2RX, UK
Tel: + 44 (0)121 233 9300, Fax: + 44 (0)121 233 0321
Email: email@theorsociety.com
Secretary and General Manager: Gavin Blackett

President: Gilbert Owusu
Editor: Maurizio Tomasella
Maurizio.Tomasella@ed.ac.uk
Associate Editor: James Bleach
Print ISSN: 2058-802X
Online ISSN: 2058-8038 www.tandfonline.com/timp
OPERATIONAL RESEARCH AND DECISION ANALYTICS
Operational Research (O.R.) is the discipline of applying appropriate analytical methods to help those who run organisations make better decisions. It’s a ‘real world’ discipline with a focus on improving the complex systems and processes that underpin everyone’s daily life – O.R. is an improvement science. For over 70 years, O.R. has focussed on supporting decision making in a wide range of organisations. It is a major contributor to the development of decision analytics, which has come to prominence because of the availability of big data. Work under the O.R. label continues, though some prefer names such as business analysis, decision analysis, analytics or management science. Whatever the name, O.R. analysts seek to work in partnership with managers and decision makers to achieve desirable outcomes that are informed and evidence-based. As the world has become more complex, problems tougher to solve using gut-feel alone, and computers become increasingly powerful, O.R. continues to develop new techniques to guide decision-making. The methods used are typically quantitative, tempered with problem structuring methods to resolve problems that have multiple stakeholders and conflicting objectives. Impact aims to encourage further use of O.R. by demonstrating the value of these techniques in every kind of organisation –large and small, private and public, for-profit and not-for-profit. To find out more about how decision analytics could help your organisation make more informed decisions see https://www.theorsociety.com/about-or/or-in-business/ O.R. is the home to the science + art of problem solving.
Taylor & Francis, an Informa business All Taylor and Francis Group journals are printed on paper from renewable sources by accredited partners.
Published by

CONTENTS
7 TESCO: REDUCED TO CLEAR
Aleksandar Kolev, Ross Hart and Ekaterina Arafailova report how Tesco’s Data Science Team developed an optimal pricing strategy for items about to be removed from shelves
15 REAL WORLD PROBLEMS IN DESIGNING SUPPLY CHAINS
Emile Naus explains that whilst designing supply chains is hard, the use of analytics enables results that are cost effective, more environmentally friendly and with the right balance of service and risks
19 THE ROAD TO BETTER OUTCOMES
Neil Robinson gives insight into how Güneş Erdoğan’s routing software is reducing costs for logistics companies
23 PLANNING GSK’S FACTORIES TO MEET THE GROWING DEMAND FOR MEDICATIONS
Giovanni Giorgio, Natasha Zheltovskaya, Peter Riley and Jacob Whyte tell us how Decision Lab used analytic modelling to help GSK plan factories in Italy and England
29 CHANGING THE ROLE OF LOGISTICS
Brian Clegg describes the involvement of Aris Syntetos’ Cardiff University team in supplying forecasting and inventory management support to companies
34 CRIMESTOPPERS IMPROVES STAFF WELLBEING WITH SIMULATION
Naoum Tsioptsias and Frances Sneddon show how simulation has helped improve staff morale whilst allowing good service to be maintained
4 Seen Elsewhere
Analytics making an impact
11 Operational Research Supporting Sport
Nicola Morrill explores the role O.R. plays in sport, with examples concerning tactics and strategy, scheduling, scenario planning and systems modelling
38 Universities making an impact
Brief report of a student project
39 I am not a robot
Geoff Royston discusses the impact of Artificial Intelligence, including ChatGPT, based on How to Stay Smart in a Smart World by Gerd Gigerenzer and Life 3.0 by Max Tegmark
DISCLAIMER
The Operational Research Society and our publisher Informa UK Limited, trading as Taylor & Francis Group, make every effort to ensure the accuracy of all the information (the “Content”) contained in our publications. However, the Operational Research Society and our publisher Informa UK Limited, trading as Taylor & Francis Group, our agents, and our licensors make no representations or warranties whatsoever as to the accuracy, completeness, or suitability for any purpose of the Content. Any opinions and views expressed in this publication are the opinions and views of the authors, and are not the views of or endorsed by the Operational Research Society or our publisher Informa UK Limited, trading as Taylor & Francis Group. The accuracy of the Content should not be relied upon and should be independently verified with primary sources of information. The Operational Research Society and our publisher Informa UK Limited, trading as Taylor & Francis Group, shall not be liable for any losses, actions, claims, proceedings, demands, costs, expenses, damages, and other liabilities whatsoever or howsoever caused arising directly or indirectly in connection with, in relation to or arising out of the use of the Content. Terms & Conditions of access and use can be found at http://www.tandfonline.com/page/terms-and-conditions
Reusing Articles in this Magazine All content is published under a Creative Commons Attribution-NonCommercial-NoDerivatives License which permits noncommercial re-use, distribution, and reproduction in any medium, provided the original work is properly cited, and is not altered, transformed, or built upon in any way.
SEEN ELSEWHERE
ROCK ART
Andrea Jalandoni, of Griffith University in Queensland, Australia, is making use of machine learning to analyse vast amounts of data, such as photos and tracings, collected at sites of millennia-old rock art in the Pacific, Southeast Asia and Australia. ‘Manual identification takes too much time, money and specialist knowledge’, Jalandoni says. She worked with Nayyar Zaidi, of Deakin University in Victoria, Australia to test machine learning to automate image detection using hundreds of photos from the Kakadu National Park in Australia’s Northern Territory, some of which showed painted rock art images and others with bare rock surfaces. The system found the art with an accuracy of 89%. Initial results were published last August –see https://bit.ly/RockArt2022.
The rock art is created from pigments made of iron-stained clays and iron-rich

is an essential aspect of contemporary indigenous cultures that connects them directly to ancestors and ancestral beings, cultural stories and landscapes’, Jalandoni says. ‘Rock art is not just data, it is part of Indigenous heritage and contributes to Indigenous wellbeing’.
‘High-tech companies, such as Google, defined as “analytical competitors,” use data science aggressively throughout their entire enterprise to sharpen operational performance and efficiency and improve customer experience in their retail and online search businesses, respectively. Companies like American Airlines pioneered the use of data and analytics in the field of revenue (yield) management in the 1980s to generate $400-$500 million in incremental revenue annually. UPS saves $300-$400 million annually with its On-Road Integrated Optimization and Navigation (ORION) application that guides their 55,000 delivery truck drivers every day. Walmart generates millions of dollars in value annually by applying predictive and prescriptive analytics to optimize its markdown pricing strategy’.
10000 STEPS, EXACTLY
How would you like to create a route of a specific length? Rhyd Lewis and Padraig Corcoran of Cardiff University have developed a journey-mapping algorithm to allow you to do just that. Turned into scientific terms, their paper, published in the Journal of Heuristics, is entitled ‘Finding fixed-length circuits and cycles in undirected edge-weighted graphs: an application with street networks’. You can read it at https://bit.ly/Rhysand Corcoran2022 or maybe go for a walk.
But, despite these, and many others, success stories, ‘according to a study by Deloitte Analytics and Tom Davenport, only 20% of data science models built are actually deployed into a production system supporting a business process’. Why is this? Gray argues that ‘the problem is not with the mathematics and technology but rather with the actions of the people (practitioners and leaders) … and the processes employed to execute and manage data science projects’.
ores that were mixed with water and applied using tools made of human hair, reeds, feathers and chewed sticks. Some of the paintings in this region date back 20,000 years, making them among the oldest art in recorded history, only a fraction of the works in the park have been studied. ‘For First Nations people, rock art
SUCCESS AND FAILURE
In a first in a series of ten articles, Douglas A. Gray in INFORMS’ Analytics magazine (https://bit.ly/Gray2023) discusses successful Data Science projects and why they fail. He points out that
Gray’s remedy is twofold. First, begin with the end in mind: ‘You don’t want to just build a model; rather, you want to embed that model into a mission-critical system that supports a key business process such that greater economic efficiency (i.e. lower cost, greater revenue, improved customer experience) can be achieved on an ongoing basis in an
IMPACT © THE OR SOCIETY 4
© Andrea Jalandoni
© Rhyd Lewis
automated manner with little or no human intervention, creating a flywheel effect generating business value’. Secondly, sharpen the saw. By this he refers to appropriate education, so that ‘students, practitioners, leaders and executives “sharpen the saw” and fill in the knowledge gap in their training and education that heretofore was learned only through real-world work experience’.
PREDICTING ASSET HEALTH
An analytics engine created by Viking Analytics, using AI-based algorithms, that automatically detects unseen or pre-failure operational conditions for electrical equipment, makes it easier for operators to prevent costly failures, plan maintenance efficiently and maximise uptime. It will allow customers to predict anomalies before they become a risk to their operations. Rajet Krishnan, CEO of Viking Analytics commented: ‘Our company’s mission is to allow industrial specialists to easily extract insights and value from both process data and asset data through AI’. A strategic partnership with ABB allows Viking Analytics’ technology to complement the ABB Ability Asset Manager, and provide full remote visibility of asset and electricalsystem health status.
Sherif El-Meshad, of ABB: ‘With the pressure on to ensure uptime and prolong the lifecycle of electrical assets, the partnership with Viking Analytics allows us to develop analytics that will help customers maintain their
operations and cut costs. Customers will get the insights they need to make informed decisions about their electrical equipment fleet and take preventative actions to avoid costly failure’. Read more at https://bit.ly/VikingAnalytics.

redundancies, errors in data sets muddle the accuracy of data analysis.
Second, the Algorithms you’re using aren’t accurate enough. Most algorithms aren’t one hundred percent perfect; most of them have their fair share of flaws and simply don’t work the way you’d like them to every time you use them.
Third, the Models you’re using aren’t that good. ‘Algorithms can crunch data all day long, but if their output isn’t going through models that are designed to check the subsequent analysis, then you’re not going to have any usable or useful insights’.
CATCHING THE EYE
Inefficient management of resources and waiting lists for high-risk ophthalmology patients can contribute to sight loss. So, researchers at Cardiff University used O.R. to develop a decision support tool to determine an optimal patient schedule for ophthalmology patients. Available booking slots as well as patient-specific factors such as eyecare measure risk factors, referral-to-treatment times and targets, and their locations were taken into account. The model can be applied and implemented without the need for additional software, to generate an optimised patient schedule. Their published paper can be found at https:// bit.ly/CardiffEye2023.

THREE MISTAKES AND YOU ARE OUT
An article by Nahla Davies, https://bit.ly/ ThreeDataMistakes in Data Science highlights the top three mistakes that companies commonly make that affect the accuracy of their data analytics.
First, Data Cleaning Isn’t at the top of your to-do List. Most sets of data have their fair share of errors. Whether they’re typos, weird naming conventions, or
HUMANITARIAN AID
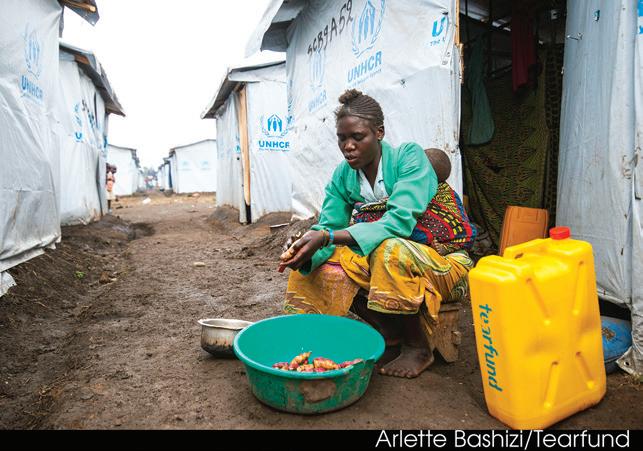
A report by the Geneva Centre of Humanitarian Studies (https://bit.ly/ ORandHumanitarianAid) argues that there is an increasing and critical need for O.R. in humanitarian settings, because time is invariably of the essence and problems and needs are often ill-defined. Practising O.R. in humanitarian settings is often challenging, but there is need for evidence-based decision-making by humanitarian organisations. O.R. can help in equipping decision-makers, at an individual programme and at the policy level, with the high-quality evidence that is needed. The Centre has gained extensive experience as a community of researchers and practitioners over the years on how to mitigate and adapt to many of the common challenges faced in humanitarian operations.
IMPACT | SPRING 2023 5
Photo by Jordan Whitfield on Unsplash © Tearfund
Photo by Emmanuel Ikwuegbu on Unsplash
TESCO: REDUCED TO CLEAR
TESCO IS THE UK’S LARGEST GROCER, operating over 2700 stores. As a business, we are committed to serving our customers, communities, and planet a little better every day, by offering the products that customers need while also reducing their impact on the planet. A key step in Tesco’s value chain is what happens at the end of a product’s lifecycle, when it is no longer displayed to customers. This is the last opportunity to sell an item to a customer or donate it to the community so that it doesn’t go to waste.
WHAT DO YOU DO WITH EXPIRING STOCK?
Tesco, like most large retailers, discounts items that are close to being
removed from shelves. This process is applied across Tesco’s product range, from general merchandise and clothing to fresh food. In particular, food items are reduced in price as they get closer to expiry to sell them before they go to waste. The question that every retailer must answer is: By how much should the price be reduced? Reduce too little and the item simply won’t sell but reduce too much and the sale might become a net loss for the retailer.
Finding the optimal pricing strategy was the task given to Tesco’s Data Science Team. To tackle this problem, we developed a novel multi-stage Clearance Pricing Optimisation system and deployed it across all Tesco stores in the UK where it is applied to 100,000s of unique products annually. The objectives

IMPACT © 2023 TESCO STORES LIMITED 7
ALEKSANDAR KOLEV, ROSS HART AND EKATERINA ARAFAILOVA
© Tesco
of this solution are to: (1) clear excess stock by a specific date (either expiry or new product roll-out date), (2) increase revenue by finding the optimal discounts, and (3) reduce operational costs and provide further insights of in-store processes. Our solution reduced the number of fresh food items going to waste by 5%, and increased the revenue generated by 1.5-13% across multiple food and non-food product lines.
Our solution reduced the number of fresh food items going to waste by 5%, and increased the revenue generated by 1.5-13% across multiple food and non-food product lines
THE PROBLEM AND ITS CHALLENGES
The challenge of expiring stock of both food and non-food items is something Tesco faces daily. The question we need to answer is: What clearance strategy should we use to increase revenue and, most importantly, decrease waste?
Tesco employs a product line specific, multi-phase reductions strategy to reduce waste and recover revenues from soon-to-expire stock. The time horizons involved vary depending on the business domain, for example:
• Fresh food items enter a pre-defined three-stage reduction process 24-48 hours before they reach their sell-by-date. Tens of thousands of unique products are reduced each year.
• Non-food items covering electronics, home & entertainment, and clothing enter an up to 4 stage reduction process, where each stage could last weeks. Tens of thousands of unique
products are reduced each year.
• Packaged food items with a long shelf life but highly seasonal demand (e.g. Christmas, Easter, Halloween etc. themed items) enter a pre-defined two-stage reduction process after their peak demand. Every seasonal event accounts for hundreds of unique product reductions across most stores.
Despite the differing time horizons, the high-level problem statement is the same: Calculate an optimal multi-phase pricing strategy, that at each phase further reduces the price of items as they approach their expiry date. The main challenges associated with this problem are:
• It likely requires solving two sub-problems: prediction and then optimisation, which scientifically makes it hard and requires different types of expertise.
• Historic data is not always available to build robust prediction models.
• Given the scale of the problem, driven by number of products and stores, the optimisation problem is computationally intensive.
The next section describes our approach for tackling this problem and the associated challenges.
THE SOLUTION
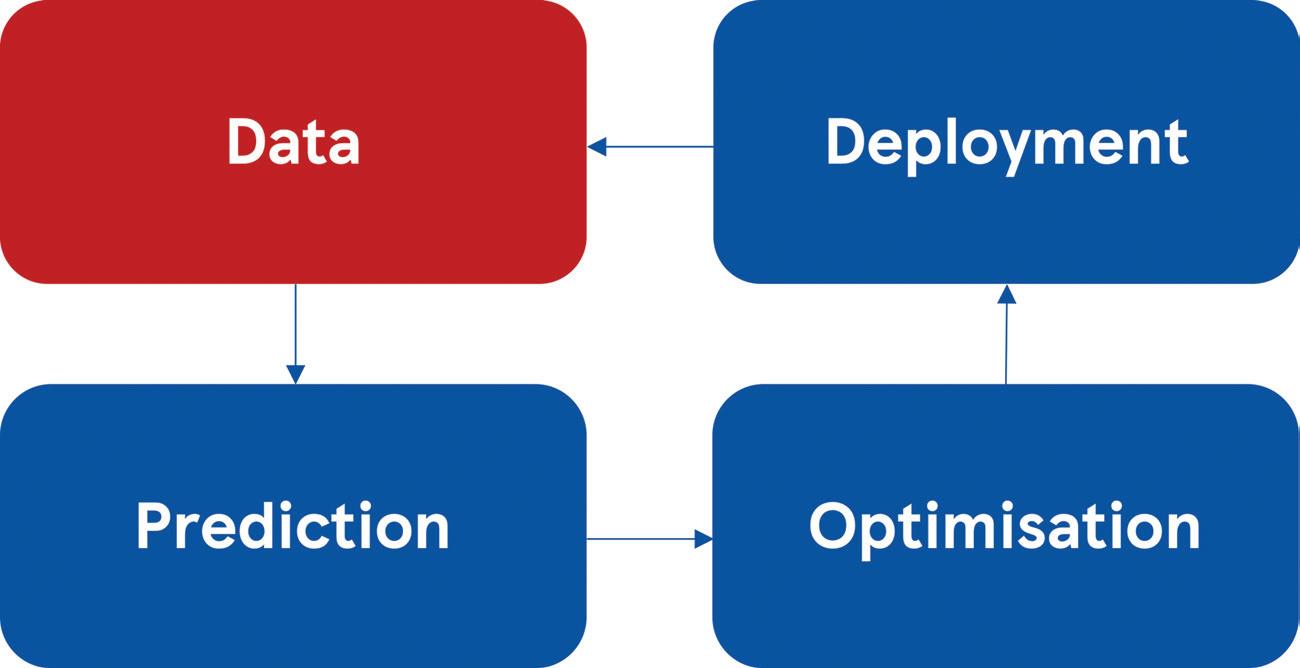
The solution that we built leveraged the same three component technique to find an optimal pricing strategy in all business domains: (1) first we model how we expect demand to react if we were to set a specific reduction (prediction), (2) we then choose optimal reductions accordingly to optimise for revenue maximisation and waste reduction (optimisation), and (3) we pass the results to the business (deployment).
Prediction
The first problem we face is building appropriate elasticity demand models, which predict how many items will sell if we set a specific price point. The biggest problem posed here is the lack of diversity of past reduction data. Tesco has typically applied static reduction strategies in the past, meaning similar reductions are applied in similar circumstances. It is therefore difficult to model exactly how customers will react to new prices that have never been used in stores before.
IMPACT | SPRING 2023 8
FIGURE 1 SOLUTION LIFE CYCLE
Model selection was crucial to getting this right – our solution has focused on the use of machine learning models that consider domain expertise combined with strong assumptions about the relationship between features and targets to deliver predictions that are useful in the context of price optimisation. This allows pricing outside the regime of reductions that were previously observed. Figure 2 shows an example of predicted waste and revenue curves, where the red dotted line represents waste, and the blue line – sales.

Optimisation
The second part of the solution involved building an appropriate optimisation routine to select the optimal set of reductions. The optimisation problem was to decide an appropriate set of reductions to apply across multiple phases to (a) reduce waste and (b) maximise revenue.
The optimisation problem was to decide an appropriate set of reductions to apply across multiple phases to (a) reduce waste and (b) maximise revenue
From our demand elasticity models, we will be able to predict how many items we’d sell, and thus what the appropriate pricing strategy might be. Setting the price high leads to fewer sales, and setting the price at close to zero leads to high sales but next to no revenue – the optimal price is usually between these two extremes (Figure 2). Setting a lower price than the one which optimises revenue price leads to more items sold and less waste, but does this by sacrificing some revenue. The reduced to clear price optimisation is therefore always a trade-off between waste and revenue.
We use both exact and heuristic approaches for solving the optimisation part of the markdown problems arising in various business domains. The choice of the appropriate technique is driven by the business constraints, scale and complexity.

Deployment
The final problem to tackle was the deployment of the solution to the business. As was the case with the optimiser, the deployment technique has been crafted with each business use case in mind. For general merchandise, clothing, and seasonal packaged food items the problems are automatically triggered overnight. The optimiser then selects the best reduction strategies and suggests them to the merchandisers as a decision support tool. Fresh food reduction recommendations must be automatically suggested instantaneously: to deploy this solution, we pre-compute a wide range of product and trading scenarios we expect to see in store, which are then looked up by Tesco colleagues as a specific scenario occurs.
SUCCESS STORIES
The solution described in the previous section has been implemented and deployed in three business domains. Overall, we achieved improvement in both main KPIs, revenue and waste, with three observations below expanding more on the obtained results:
1. The largest impact of our algorithmic solution is present across fresh food items. We have reduced the number of expiring fresh food items going to waste by 5%, which prevents millions of fresh products from going to waste each year, yet also increases the revenue generated from reduced-to-clear fresh food items. By tuning the optimiser’s constraints, we were able to explicitly favour lower prices and waste

IMPACT | SPRING 2023 9
©
FIGURE 2 WASTE AND REVENUE CURVE FOR VARIOUS REDUCTION LEVELS
Tesco © Tesco
reduction over revenue in this trade-off.

2. The longest lasting solution delivered by our team is a human-in-the-loop decision support system for clothing and general merchandise, that in addition to optimising the reduction strategy for each line, provides human merchandisers with accurate forecasts of future revenue and stock. By investing effort to continuous scientific development and leveraging the feedback from live tests, we demonstrated the results that consistently outperform manual decisions making in terms of revenue.
3. Last but not least, we increased the revenue generated from reduced-toclear seasonal food (e.g. Easter eggs, chocolate Santa) without impacting waste.
We have reduced the number of expiring fresh food items going to waste by 5%, which prevents millions of fresh products from going to waste each year
SUMMARY
We were delighted to be awarded the OR Society’s President’s Medal in 2022 for this work.
Finding an optimal reduction strategy is a problem faced by every retail business. There are two conflicting objectives to not only increase revenue but also reduce waste and finding a solution that achieves both is a non-trivial task. At Tesco we have built and deployed a predictoptimise solution across multiple product areas that successfully reduced waste and our impact on the planet, and also increased revenue for the business.
Aleksandar Kolev is a Senior Data Scientist at Tesco. He has been working on the two projects related to food price reductions. Aleksandar, as a keen statistician and researcher, helped the team improve not only the scientific solution but also identify key research areas that enabled us build even better algorithms.
Ross Hart is a Data Science Manager at Tesco. He has a PhD in astrophysics, and now uses machine learning and optimisation techniques to solve both online and in-store Data Science problems.
Ekaterina Arafailova is a Lead Data Scientist at Tesco. Her background is in operational research, and at Tesco she focusses on optimisation problems arising in various business domains. Using operational research approaches, Ekaterina and her team have already delivered a significant value across the business, with more to come.
IMPACT | SPRING 2023 10
© Tesco
OPERATIONAL RESEARCH SUPPORTING SPORT
 Nicola Morrill

True optimization is the revolutionary contribution of modern research to decision processes.
George Dantzig
Given the recent round of large sporting events I thought in this article I would explore the role O.R. plays in sport. I hadn’t appreciated until I started looking just how vast the role is! So, while this article shares something of the use of O.R. in sport, offering an insight into the nature of questions that O.R. can help address – many of these are conceptually transferable beyond sport.
The goal of my columns is to share the discipline with users/potential users of O.R. by highlighting how the ‘business’ challenges they may be facing can be supported. In addition, they may also stimulate thinking in the O.R. community about possible areas O.R. could help in the area being considered.
O.R. AND SPORT
O.R. is used in a wide range of sports: cricket, rugby, football, tennis, darts, racing, and many more. There are variances in the nature of its use across different types of sport. An article by Wright (https://bit.ly/MBWright2008) discussing ‘50 years of O.R. in sport‘, identified the areas of support that O.R. tends to provide as tactics and strategy, scheduling, forecasting and other areas.
In line with Wright’s thoughts about future areas, sport is also making use of the large volumes of data collected and there is still more that could be done related to the use of behavioural O.R. Broadly speaking, the areas of coverage are operational, planning and also sport in a more strategic sense beyond an individual activity or team. In line with this, there are some examples of foresight and futures being used in the context of sport.
Given that I have come to learn that the use of O.R. in sports is an enormous area, this article will share some examples of O.R. supporting sport across the following areas: tactics and strategy, scheduling, scenario planning and systems modelling. It is by no means an exhaustive representation of the help the disciplne of O.R. provides to different sports across different areas.
TACTICS AND STRATEGY
A significant area of sport where O.R. helps is related to tactics and strategy. Examples include:
• Improving team and individual performance. An Impact article by Lade (https://bit.ly/Lade2019) shared how the use of an O.R. tool called INSIGHT by a variety of organisations, including England Rugby, Bath Rugby, the Football Association (FA), British Athletics, British Sailing, GB Snowsport, the Lawn Tennis Association (LTA) and Team Sky is helping improve individual and team
IMPACT © THE OR SOCIETY 11
© Graham Rand
performance. This has data analysis with the use of AI at its heart. A really interesting application area discussed is work on predicting player ranking over the duration of their career.
• Cricket team selection. A paper by Sharp et al. (https://bit.ly/Sharpeetal2011) explored how to select the optimal team for a 20/20 cricket match. The work focussed on whole team selection using an integer programming approach that can be extended to a multistage team selection game. This involved considering the mix of different skills, the requirement of the match and team circumstances. This approach has been used in fantasy league games, updating the team as more information becomes available.
The work built on that of others looking at cricket performance evaluations. An interesting modelling approach is that of Data Envelopment Analysis (DEA), which is used to look at the performance and benchmarking of different ‘decision-making units’ (DMUs).

• Finding inefficiencies. Bhat et al (https://bit.ly/ Bhatetal2019) provide an overview of the use of Data Envelopment Analysis (DEA) in Baseball, Basketball, Cricket, Cycling, Football, Golf, Handball, Olympics, and Tennis. In the work presented, comparisons across the sports were between players, teams and nations at, for instance, the Olympics. In providing a measure of relative efficiency, DEA was able to identify strengths and weaknesses in the areas being considered. Most papers related to football club comparison concern English football and the authors believe this is because they were the first to be floated on the stock market.
• F1 pit stop tyre strategy. Maharwal et al. (https://bit.ly/ Maharwaletal2019) looked at the roles of O.R. in sports and gaming. One example provided is the use of game theory to support decisions around tyre change in Formula 1 racing. It considers a range of factors such as the optimum time to come in and change tyres and its relationship with when the driver rejoins the track – looking to re-enter at a time when being blocked by slower drivers is minimised.
IMPACT | SPRING 2023 12
© Phil Britt
• E-sports gaming centre optimal seating strategy. Kwag et al (https://bit.ly/Kwagetal2022) looked at how an e-sports gaming centre can best allocate its seats. The work undertook data analysis to look at the impact on revenue of different seat allocation strategies for large and smaller groups. There are differences in the nature of gaming centres compared with other areas, such as airlines, hotels and cinemas, which consider a similar question. The work showed that prioritising the seat allocation of larger groups does not always generate the largest revenue.
There are many more examples of O.R. supporting tactics and strategy at the operational and strategic levels.
SCHEDULING
A significant area where O.R. is used is in the scheduling of matches for large tournaments. An Impact article by Wright, (https://bit.ly/MBWright2018), provides a good lay person introduction to how O.R. is used to help with scheduling for sports and the type of questions that are required.
• Football and cricket tournament scheduling. O.R. is routinely used in cricket and football scheduling and the Marharwal et al. paper highlights different examples and methods used for this. In an Impact article, Durán et al. (https://bit.ly/Duran2017) discussed the optimisation work used to schedule football leagues in Chile being extended and used in the scheduling of football World Cup matches.
• Scheduling a sports conference. Nemhauser and Trick (https://bit.ly/NemhauserandTrick1998) discussed the problem of scheduling a major college basketball
conference and the analytical approach used in the real situation was in the end able to turn around schedules in a day. The exploratory work generated a possible 10 billion schedules!
CONSIDERING THE FUTURE
• Scenario planning and sports tourism. Darabi et al. (https://bit.ly/Darabi2020), described the use of scenario planning to explore the suitability of sports tourism to a particular area, Mashhad, Iran. The work identified that the area has great potential for attracting tourism in the future and identified a number of factors to be influenced to enable this, including: natural drivers, social-cultural drivers, managerial and programmatic drivers, economic drivers, advertising drivers, service drivers, and infrastructure drivers.
SYSTEMS MODELLING
There is some recent work looking at systems modelling in sports: an area perhaps where more could be done.
• Systems approach to sports injury. Hulme at al. (https:// bit.ly/Hulmeetal2019) explored the use of a complex systems approach to sports injuries. The work used agent-based modelling to model the occurrence of sports injuries, focussing on distance running related injuries. They considered changing running distances and the use of different runners ‘tools’. They showed it is possible for athletes to reach and surpass individual physical workload limits, for instance, building weekly running distances over time after injury. The authors concluded that simulation-based techniques have a role to play in the complex area of sports injury research.
• Modelling the sports entrepreneurship ecosystem. Darooghe et al. (https://bit.ly/Daroogheetal2022) investigated sports entrepreneurship within Iran and, given the complexity of the eco system, used system dynamics to do this. Their work was especially interested in understanding how to achieve sustainable development of entrepreneurship, highlighting the key role sports tourism plays in this. The modelling undertaken identified that as well as infrastructure, sports entrepreneurship also requires other elements, such as, cultural and social preparations, cooperation of educational systems, administrative and financial support.

IMPACT | SPRING 2023 13
© Graham Rand
• Screening attendees at a large sporting events. Holt, in an impact article (https://bit.ly/CHolt2016), discussed the role of simulation modelling and broader O.R. in helping to secure international sporting events. Specifically addressed were effective screening of spectators, athletes and workforce at the world’s three largest multi-sport events. The article discussed the broader strategies adopted in order to minimise queueing and disruption to people –essential to this was security screening not being treated as an isolated activity.
WANT TO LEARN MORE?
This article provided an insight into some uses of O.R. in sport and for those interested in learning more there are several papers in the Journal of the Operational Reseach Society There are also several books, including those edited by Wright (2015) and by Harrison and Bukstein (2016). For those interested in engaging more with community there is an INFORMS (The Institute for Operations Research and the Management Sciences) area (https://connect.informs.org/ sports/home) aimed at bringing folks together. The main
O.R. Society annual conference sometimes has an O.R. in sports stream. So lots of opporunity to learn more about this application area of O.R.
The OR Society runs training courses on much of the above if you want to bolster your in-house team. We are an active community and there are various events running through the year that may be of interest.
Nicola Morrill is a Fellow of the O.R. Society and currently volunteers as its board level Diversity Champion. She writes in a private capacity – all views expressed are her own and all examples are available in the open domain. You can contact her on Nicola.Morrill@googlemail.com
FOR FURTHER READING
Harrison, C.K. and S. Bukstein, eds. (2016). Sport Business Analytics. New York: Auerbach Publications. Wright, M., ed. (2015). Operational Research Applied to Sports. London: Palgrave Macmillan.
IMPACT | SPRING 2023 14
REAL WORLD PROBLEMS IN DESIGNING SUPPLY CHAINS
EMILE NAUS SUPPLY CHAINS HAVE TRADITIONALLY OPERATED IN THE BACKGROUND, but in the past few years they have become front page news. From a global shortage of electronic components to supermarket shelves without toilet rolls, flour or salad, a fastfood chain without food and a container ship stuck in the Suez Canal, the importance of supply chains to our global businesses and people are now clear.
These issues have highlighted the risks that are embedded in our supply chains. Major disruption happens, and more often than most people consider. But how do we go about designing supply chains, ideally without hitting the front page of the popular press?

Supply chains are a series of nodes that connect raw material suppliers via factories, warehouses and transport links to end consumers. That is a
relatively simple statement, but typically there is a lot of detail behind this. In the typical literature, it is often represented in a linear fashion, but the reality is often a spider’s web of interconnected supply chains.
The science of these supply chains, at a static level, is pretty well understood, such as optimisation models for network design and transportation routing and simulation models for stochastic problems in factories and warehouses. But models are based on data and assumptions, and the question very quickly becomes how well these reflect reality.
PRACTICAL CONSIDERATIONS
Let’s take network locations as an example. These are typically used to assess where to construct new
IMPACT © 2023 THE AUTHOR 15
© BearingPoint
warehouses and will take inputs such as customer and supplier locations, demand and transport distances. Since demand is often correlated against population, running these models for different businesses typically gives similar outputs, leading to a concentration of warehouses around the M1 between Northampton and Leicester. Figure 1 shows an example for Magna Park Lutterworth, with around 800,000 m2 of warehouses, but relatively limited access to a local labour pool.

The models typically ignore soft requirements (such as labour and skills), but also often don’t clarify the relatively sensitivity of location to the overall solution. At the same time, moving a location 40 miles north or south may not have a material effect on the solution, but a two-mile diversion from a major transport network can have a huge impact. For a major retailer, this ‘minor’ change would add nearly 750,000 lorry miles per annum.
Equally, it is easy to assume that data is widely available but getting timely and accurate data across a multi-tier supply chain is very hard. The reason is not that the data doesn’t exist, but that the data is
proprietary and different entities in the supply chain have different levels of visibility. And since most supply chains consist of businesses with interlinking commercial relationships, this data is sensitive.
As a consequence, whilst it seems easy to draw a supply chain map, it is much harder to extend this across multiple tiers. We saw this when the Rana Plaza building in Dhaka collapsed in 2013. Several retailers did not know that their products were produced in these factories, partially due to a long list of commercial contracting and subcontracting relationships. Whilst this may have initially resulted in a low-cost sourcing of products, the ultimate cost in human lives (and resulting brand damage to the retailers) was huge.
Long supply chains are typically not static. Businesses change suppliers, or relocate to a new facility, and transport providers change which nodes they use (especially relevant for rail, sea and air transport, where different terminals might be used). The models would need to keep track with the levels of change, and in particular sourcing options can change both frequently and potentially temporarily.
the length of supply chains, with large number of nodes, typically results in models that are mathematically and computationally challenging
Finally, the length of supply chains, with large number of nodes, typically results in models that are mathematically and computationally challenging. At BearingPoint we use Gurobi as our mathematical optimisation engine, which combines a best-in-class engine with the power of cloud computing. But we still hit limits to what is an acceptable model complexity and resulting run-time.
BALANCING DIFFERENT ELEMENTS
In order to model supply chains effectively, we therefore need to blend the rigour of the data and modelling with a practical application of those factors that are either unknown, changeable or difficult to model. That doesn’t mean that we can’t use data to assess some of these factors, it is just treated outside the core model.
As an example, we have recently completed the global network review for a business with a large product range and a relatively short order lead time. A key factor in the decision making was how we could balance cost, investment in inventory and infrastructure and service levels. This is a fairly typical application, where advanced models can support the decision making. “The power of combining the quantitative modelling with the qualitative assessments resulted in a series of workshops where the key stakeholders could discuss, using facts and data, what the best
IMPACT | SPRING 2023 16
FIGURE 1 AERIAL VIEW OF MAGNA PARK LUTTERWORTH (SOURCE: GOOGLE EARTH PRO)
Map data: Google
options are to balance cost, investment and risk for our future supply chains”: CEO, global distributor.
To start, we constructed a set of conceptual supply chain models. In simple terms, these were used to assess at a high level what a realistic set of options might look at. It very quickly became obvious that the inventory investment, based on the number of products, makes it very difficult to split the range over a large number of stock holding locations. This allowed us to constrain the model to a smaller number of options.
We then used segmentation analysis to split the range based on a series of characteristics, such as value, cube and weight, rate of sale and life cycle risk. This allowed us to further restrict the number of options into a more manageable set of options, again based on the criteria of cost, investment and service.
Finally, we ran the models to understand the optimum solution, balancing the costs and investment whilst meeting a minimum service requirement, then again with increasing service requirements to understand the
sensitivity. This resulted in a series of scenario outputs (each individually optimised), which could then be assessed against the overall scoring.
In parallel, we developed a series of ‘qualitative’ scoring areas, and then assessed each scenario on these. Some of these categories can take data driven inputs, such as taxes and tariffs and political and disruption risks. Others are more subjective, such as freight availability and some risk factors.
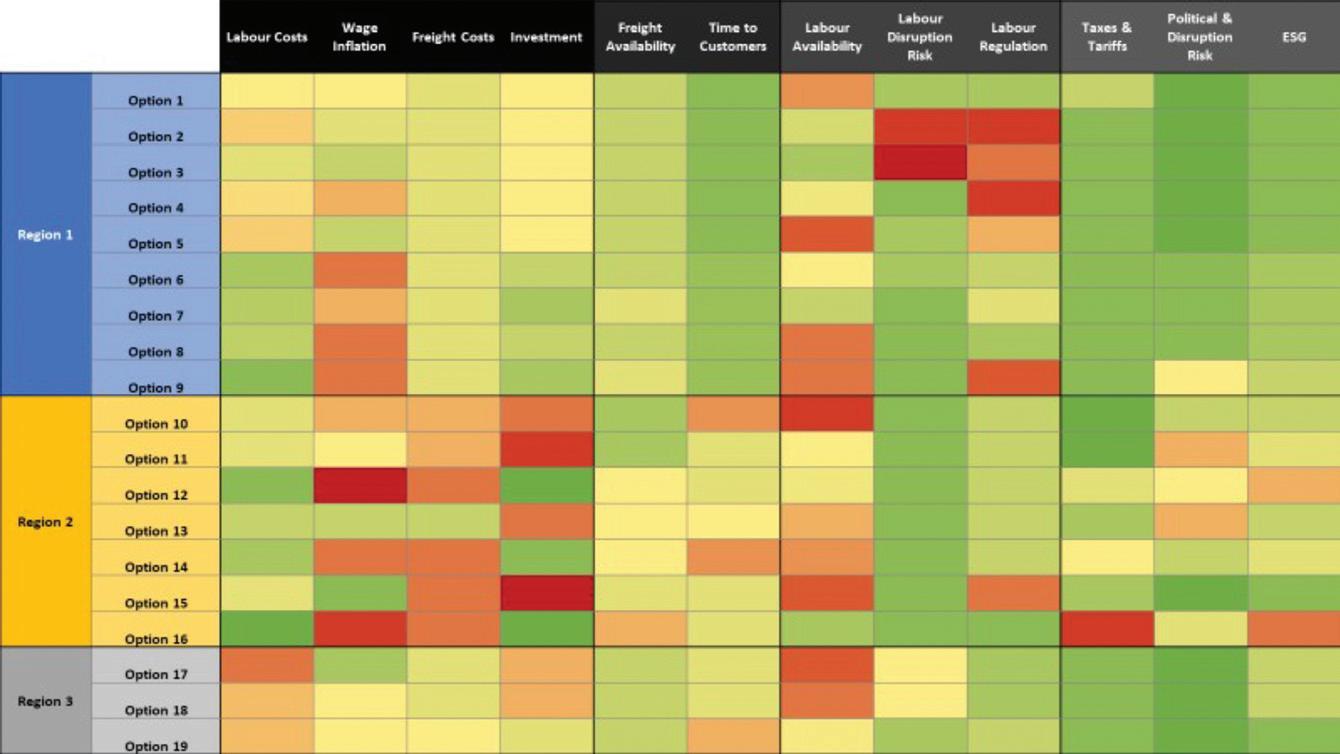
Figure 2 shows one of the elements of this evaluation, highlighting both quantitative and qualitative measures against a series of options.
Ultimately, it is important to recognise that there typically is not one optimum solution; different stakeholders will put a different focus on the different elements. It is therefore required to review both the analytical elements (where there may well be an optimum, but it depends on the inputs) and the softer or more qualitative elements.
BLENDING ART AND SCIENCE
The requirement to use non-numerical data does not mean that we should not use the optimisation models. Rather, it should remind us that these models can be very useful but need to be treated with a degree of caution: they are limited by their complexity, by the difficulty to get perfect data and by the fact that there are factors that are not in the model.
The key element is to take the models, ensure they represent the actual underlying problem and then to test the outputs, understand their sensitivity and to be very clear about other factors that are important decision criteria but may not be in the model.
Finally, it is also worth remembering that your competitors are running the same models. Sometimes, you can get a competitive advantage by doing something that may not be ‘optimum’ but allows you to differentiate yourself.
Designing supply chains is hard, but by combining the power of analytics with a real-world understanding of the limitations of the model, we can deliver results that are both cost effective, more environmentally friendly and with the right balance of service and risks.
Emile Naus is a Partner in BearingPoint. He has worked in supply chain across both operational roles and consultancy projects across the globe, with a background in analytics (https://www.linkedin.com/ in/emile-naus/). BearingPoint is a 5,000 strong consultancy with a focus on business and technology (www.bearingpoint.com).
IMPACT | SPRING 2023 17
it is important to recognise that there typically is not one optimum solution
FIGURE 2 EXAMPLE EVALUATION MATRIX
© BearingPoint
THE ROAD TO BETTER OUTCOMES
NEIL ROBINSON WELL OVER HALF A CENTURY HAS PASSED since an article in a management journal originally tackled what has come to be known as the vehicle routing problem. The world is a very different place today, which is why the challenges and impacts of addressing this increasingly complex issue have perhaps never been so significant.
Vehicle routing problems – otherwise known as VRPs – have been a focus of operational research for more than 60 years. They first appeared in an academic paper in 1959, when George Dantzig and John Ramser’s The Truck Dispatching Problem proposed an algorithm for organising fuel deliveries.

As Dantzig and Ramser noted, a VRP represents a generalisation of the travelling salesperson problem (TSP) – one of the most intensively studied puzzles in fields ranging from O.R. to theoretical computer science. As with the TSP, the challenge is essentially one of logistical optimisation.
Specifically, the aim is to maximise the efficiency of transportation operations for a fleet of vehicles based out of a designated hub. It was with this goal in mind that Dantzig and Ramser delineated what they called a ‘near-best solution’ for trucks moving between an oil terminal and a number of service stations.
IMPACT © THE OR SOCIETY 19
© Gorloff-KV/Shutterstock
It hardly need be said that much has changed since 1959. It is unlikely, for example, that the necessary calculations for successful responses to VRPs would now be ‘readily performed by hand’, as Dantzig and Ramser suggested. Ours is a much more complicated and interconnected world.
As a result, increasingly complex VRPs can now be found in numerous sectors –including distribution, travel, waste collection, tourism, healthcare and even humanitarian efforts. Moreover, they no longer revolve almost exclusively around cost considerations: environmental concerns must be taken into account as well.
Fortunately, O.R. has also come a long way. The work described here is a powerful illustration of how state-of-theart approaches to VRPs are now benefiting a wide array of stakeholders by enhancing the practices of businesses and organisations around the globe.
reasons why
A CHALLENGE DEMANDING TRUE EXPERTISE
More than a decade ago, following a request from a major charity, Güneş Erdoğan started working on what would become known as the VRP Spreadsheet Solver. Arising from a collaboration between five UK universities, the project recognised the growing difficulties facing real-world practitioners confronted by VRPs.
‘One of the reasons why VRPs fall within the academic domain of O.R. is that they’re extremely hard to solve,’ says Erdoğan, now a Professor of Management at the University of Bath. ‘Developing an algorithm for a VRP is a daunting undertaking and not for the faint-hearted.’
Among the principal hurdles is the dynamic retrieval of data from a geographic information system. The recurring costs of acquisition can be prohibitive, and even a
measure of in-house knowledge might be insufficient to draw on the consequent wealth of travel and distance data needed to visualise and compare potential solutions.
There are commercial software packages for VRPs, but these can present issues of their own. They must be integrated into existing software, and they are also likely to have a black-box component that protects their programmers’ intellectual property –that is, the algorithm that determines optimal routes.
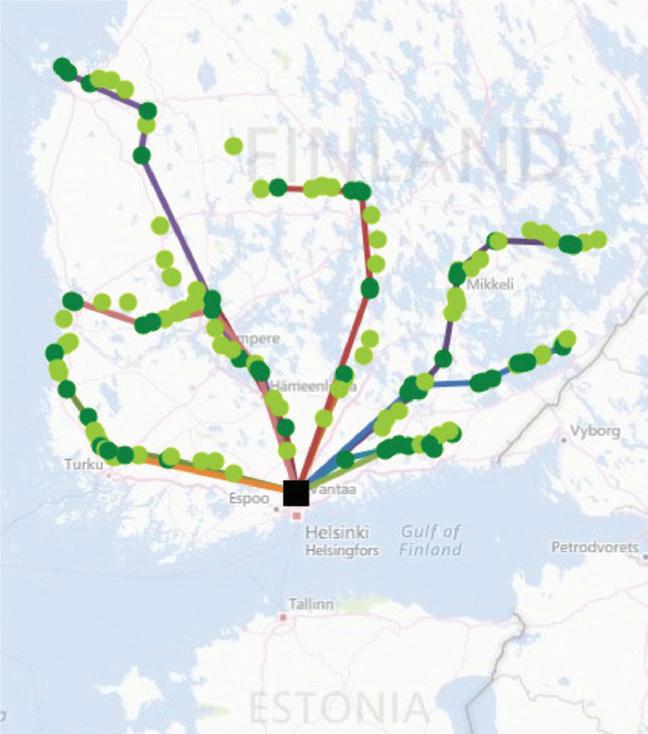
Erdoğan and the rest of the team sought to circumvent all these obstacles by making the VRP Spreadsheet Solver uniquely accessible, useable and flexible. The result: an open-source, easy-tounderstand-and-modify program with an interface in Microsoft Excel – arguably the standard software for small-to-mediumscale quantitative analysis the world over. An example of the output from the VRP Spreadsheet Solver for a tourism company based in Finland can be seen in Figure 1. Buses subcontracted by the company based in Helsinki pick up customers and return to the port.
The VRP Spreadsheet Solver was first released in a beta version in 2013. Its story was only just beginning. A year later, following his arrival at Bath, Erdoğan embarked on research that would eventually greatly expand its scope and functionality.
CYCLE OF IMPROVEMENT
In light of the general shift towards ‘greener’ urban transportation, one of the most common VRPs today is what is sometimes known as the Static Bicycle Rebalancing Problem. This refers to the challenge of how to most effectively redistribute the bikes used in a bike-sharing system.
Ideally, redistribution entails one or more centrally based vehicles picking up and delivering bikes in a way that ensures an optimum mix of bicycles and empty parking slots at every bike-sharing station in a town or city. Having accomplished this task, the vehicles then return to their depot.
‘There have been many initiatives to encourage users themselves to relocate bikes from areas of high supply and low demand to areas of low supply and high demand, but it’s still trucks that tend to do the job,’ says Erdoğan. ‘This can mean significant expense and a heavy CO2 footprint, which is why routing optimisation is acknowledged as key to reducing costs and mitigating environmental impact.’
In 2014, in collaboration with colleagues in the UK and abroad, Erdoğan set about developing an optimal algorithm for managing bike-sharing systems. Crucially, it encompassed those requiring several vehicles and station visits to achieve redistribution.
‘The demands of many large bikesharing systems simply can’t be satisfied by a single vehicle and a single visit,’ explains Erdoğan. ‘The involvement of multiple vehicles and multiple visits is much more representative of the real world, and it was important to reflect that.’
The algorithm was found to work for systems with up to 60 stations. Its success compelled Erdoğan to incorporate his new research into the design and operation of the VRP Spreadsheet Solver, which was duly transformed into a tool capable of generating substantial savings – sometimes amounting to hundreds of thousands of pounds – in a variety of sectors.
IMPACT | SPRING 2023 20
One of the
VRPs fall within the academic domain of O.R. is that they’re extremely hard to solve
FIGURE 1 THE VISUAL OUTPUT FOR A CASE STUDY IN THE TOURISM SECTOR (from Erdoğan, G. (2017): see below).
A GLOBAL SOLUTION FOR A GLOBAL PROBLEM
The updated version of the VRP Spreadsheet Solver was downloaded several thousand times after being made freely available on an academic website. Erdoğan now emails it directly to interested parties. To date, it has been used in countries including the US, Finland, Argentina, Turkey and Taiwan.
Its appeal may be especially manifest amid a post-pandemic commercial landscape in which concepts such as working from home, just-in-time logistics and all-round hyperconnectivity have become new normals. As Erdoğan points out, variants of the VRP are now emerging in any context where a pick-up or delivery service is performed.
Take, for instance, a non-profit organisation that provides at-home healthcare services in Istanbul. With three bases, around 90 vehicles and more than 3,000 patients, it has to visit around a thousand separate locations every day. In this case the VRP Spreadsheet Solver has helped address management concerns over the equal allocation of work.
The challenge for another corporate user was to optimise the distribution of food from its warehouses to its 45 supermarkets in central Taiwan. The VRP Spreadsheet
ENSURING FAMILIARITY AND FLOW
Familiarity and ease of use are among the VRP Spreadsheet Solver’s principal attractions from the perspective of businesses and organisations. The software’s Microsoft Excel underpinnings are key here.
For example, the program keeps data about the elements of a specific VRP in separate worksheets. These are then generated in sequence. The incremental flow of information between worksheets is shown in Figure 2, with the arrows signifying interdependencies.
Solver’s innate versatility and ease of use meant the company was able to adapt the program to perfectly suit its purposes.
One of the business’s senior managers later contacted Erdoğan, telling him: ‘Since you wrote your solver in Excel, its interface is familiar enough for nonprogrammers to use and change. We let real users modify your program to split large orders, match truck types to stores,
add multiple runs and generate reports.’ The feedback further highlighted distance savings of 30% and cost savings of up to 20% for perishable goods.

There has even been a throwback to the formative work of Dantzig and Ramser: like The Truck Dispatching Problem of 1959, the VRP Spreadsheet Solver has assisted the oil industry. A US-based firm reported savings of around $2 million between 2016 and 2020 after using the software to plot routes between wells for its fleet of 150 tankers.

THE BOTTOM LINE – AND BEYOND
‘The feedback we’ve received shows how widely and effectively this software can be applied,’ says Erdoğan. ‘On the strength of correspondence alone, we know the total savings made possible by the VRP Spreadsheet Solver so far run to millions of pounds. Maybe more so than ever, we also know VRPs are an issue for businesses and organisations all around the world.’
Data from Google Analytics underlines Erdoğan’s observations about the global
IMPACT | SPRING 2023 21
FIGURE 2 SPREADSHEET STRUCTURE OF VRP SPREADSHEET SOLVER (from Erdoğan, G. (2017): see below).
© ronstik/Shutterstock
A CLOSER LOOK AT THE VRP SPREADSHEET SOLVER CONSOLE
The first worksheet users encounter is known as the VRP Solver console. It stores information that is provided to the other worksheets.
As shown in Figure 3, the console is home to numerous parameters that define a VRP. These include the number of depots and customers, the number of vehicle types and the width of time windows. Users can also adjust settings around options such as the retrieval of data from a geographic information system and the time allowed to work on a problem.

Mindful of this truth, it is perhaps worth noting the final sentence of the abstract of Dantzig and Ramser’s trailblazing paper of 64 years ago. Having outlined their groundbreaking ‘near-optimal solution,’ the authors conceded: ‘No practical applications of the method have been made yet.’
It’s not just a question of producing better outcomes for companies and other organisations: it’s also a question of producing better outcomes for their stakeholders, including society as a whole
nature of modern-day VRPs. More than 25,000 people from 136 countries – the US, India, Turkey, Brazil, the UK, Colombia, Germany, Thailand, Canada and Indonesia foremost among them – viewed the VRP Spreadsheet Solver’s host page in the 40 months leading up to December 2020, while a YouTube tutorial video was watched over 70,000 times.
‘I think the bigger picture is vital here,’ says Erdoğan. ‘We’re living in an age when every business is seeking cost efficiencies and when corporate social responsibility and ESG – environmental, social and governance considerations – should be high on the agenda of any organisation. Together, these factors have brought VRPs into ever-sharper focus.’
It is the second of these concerns, particularly in the form of climate action, that really distinguishes the VRPs of today from those of yesteryear. So-called G-VRPs – Green Vehicle Routing Problems – have quickly become a cornerstone of research in this area, with a focus on minimising emissions, noise pollution and
accidents. Less distance and less duration frequently translate into benefits that extend far beyond the bottom line.
We’re living in an age when every business is seeking cost efficiencies and when corporate social responsibility and ESG –environmental, social and governance considerations – should be high on the agenda of any organisation
FOR FURTHER READING
The same could hardly be said of Erdoğan’s research. ‘We feel our work is genuinely making a difference in lots of ways,’ he says. ‘It’s not just a question of producing better outcomes for companies and other organisations: it’s also a question of producing better outcomes for their stakeholders, including society as a whole. For me, that goes to the heart of what O.R. should be all about in the 21st century.’
Neil Robinson is the managing editor of Bulletin, a communications consultancy that specialises in helping academic research have the greatest economic, cultural or social impact
Bulhões, T., A. Subramanian, G. Erdoğan and G. Laporte (2018). The static bike relocation problem with multiple vehicles and visits. European Journal of Operational Research 264: 508-523.
Dantzig, G. and J. Ramser (1959). The truck dispatching problem. Management Science 6: 80-91.
Erdoğan, G., M. Battarra and R. Wolfler Calvo (2015). An exact algorithm for the static rebalancing problem arising in bicycle-sharing systems. European Journal of Operational Research 245: 667-679.
Erdoğan, G. (2017). An open-source spreadsheet solver for vehicle routing problems. Computers and Operations Research 84: 62-72.
IMPACT | SPRING 2023 22
FIGURE 3 VRP SOLVER CONSOLE SPREADSHEET (from Erdoğan, G. (2017): see below).
PLANNING GSK’S FACTORIES TO MEET THE GROWING DEMAND FOR MEDICATIONS

GSK IS A GLOBAL BIOPHARMA COMPANY with a purpose to unite science, technology and talent to get ahead of diseases. GSK aims to positively impact the health of 2.5 billion people over the next 10 years. Its bold ambitions for patients are reflected in new commitments to growth and a step-change in performance.
GSK prioritises innovation in vaccines and specialty medicines,
maximising the increasing opportunities to prevent and treat disease. At the heart of this is its R&D focus on the science of the immune system, human genetics and advanced technologies, and its world-leading capabilities in vaccines and medicines development. It focuses on four therapeutic areas: infectious diseases, HIV, oncology, and immunology.
IMPACT © 2023 THE AUTHORS 23
GIOVANNI GIORGIO, NATASHA ZHELTOVSKAYA, PETER RILEY AND JACOB WHYTE
© GSK
THE FEED TEAM’S ROLE
GSK’s Global Capital Projects organisation looks after the worldwide company capital investment in the pharma supply chain (new manufacturing equipment and new facilities). Within this organisation the Front-End Engineering & Design (FEED) team focuses on the initial stages of design and business case. Projects usually go through three key phases: business analysis, feasibility and concept selection. In each phase we assess the strategic business requirements and propose a selection of engineering solutions to address the business need. By the end of the concept selection process a single solution gets endorsed by the business and progresses into the delivery phase.
Modelling and analytics activities often play a big role in the front-end phases of capital projects, as they help the business to understand what information is critical. Knowing how big the demand for a certain product is going to be affects what size the facility should be, the kind of equipment that should be used for the production and what the production cycle is going to be like. This requires lots of different scenarios being modelled in a highly sophisticated network of dependencies and calculation of their impact on the investments the company must make. The budgets of the potential capital projects can range from £10m to £500m and the timeline for the plans needs to be made for the next 5 to 15 years. The FEED team uses modelling and simulation to understand how to optimise such investments by phasing them while still minimising the risks.
THE CHALLENGE
In 2020, the GSK FEED team was faced with planning for a new
biopharma facility in Italy. To plan for such a large investment, the team had to carry out key work to support the business case, which involved developing the design concept and establishing the optimal level of resources to satisfy ten years of forecasted commercial demand. This meant that the team needed to calculate how many machines were needed and what the technology of the machines should be, which machines should be bought, and decide on their operational regime, because the type of the machine will dictate how they can be used operationally.
Product forecasting and demand fluctuations have always represented a big challenge for pharma companies, especially during the design of a new manufacturing line or plant. Most of the time the potential new products are still in development undergoing clinical trials and years ahead of the commercialisation launch. Getting the right product mix, coordination and optimisation of resources such as machines, operators, materials, etc. are some of the challenges that GSK face operationally. To address this, there was a need for a model that could be used to inform key aspects of the business case. It had to capture all the required complexity while being fast enough and flexible enough to answer the business question.
A SOLUTION THROUGH COLLABORATION
GSK asked Decision Lab to develop a decision-making tool to support the business case. Decision Lab is an award-winning tech company with a lot of experience in building highly complex models that aid decisionmaking in a range of sectors, including healthcare, aviation, infrastructure, logistics, and defence and security. GSK and Decision Lab have worked
on projects previously and knew that they could work across the two organisations in one unified effort, which would be necessary for this complicated project.
Decision Lab’s solution was to develop a simulation model for the planned new production line. If able to accurately represent the operations of the facility, this model would allow GSK to test the future production line virtually and investigate its boundaries by evaluating several “what if” scenarios. It would provide an understanding of the factors that impact production capacity and operating costs. It would also give specific answers to key questions: how many machines they should buy, what technology these machines will use, and what their operational regime (number of operators, shift patterns, etc.) should be?
The FEED Team used the model to generate hundreds of plausible scenarios and test many different demand forecasts, equipment technologies and size, quantity of key equipment and allow them to understand the true operational bottleneck
Decision Lab and GSK technical experts worked closely on this project, in a highly collaborative way. It was a cross-functional effort involving about thirty GSK contributors across several countries and disciplines. We needed to involve different specialist teams to guide us on aspects of the data input, and this expertise was embedded into the model. The fact that the model condensed the knowledge and the requirements of about 20 active contributors from different disciplines says a lot about the value the
IMPACT | SPRING 2023 24
development team gained in terms of engagement, knowledge transfer and decision support. The collaborative approach helped the design and production teams gain a holistic view of the capacity and operation as we uncovered the process logic and operational metrics. It also offered a high level of engagement within GSK, aided knowledge transfer and built confidence in the model and the insights it provides.
The model itself is a discrete event simulation where the user specifies the demand as a sequence of product batches and specifies a series of process steps that each batch may need to go through. For each process step the batch is assigned equipment that will perform the process. Equipment may have to be cleaned between batches. The model tries to process all the batches as quickly as possible and that the machines are utilised as equally as possible. Figure 1 shows the 2D view of the model, providing information on
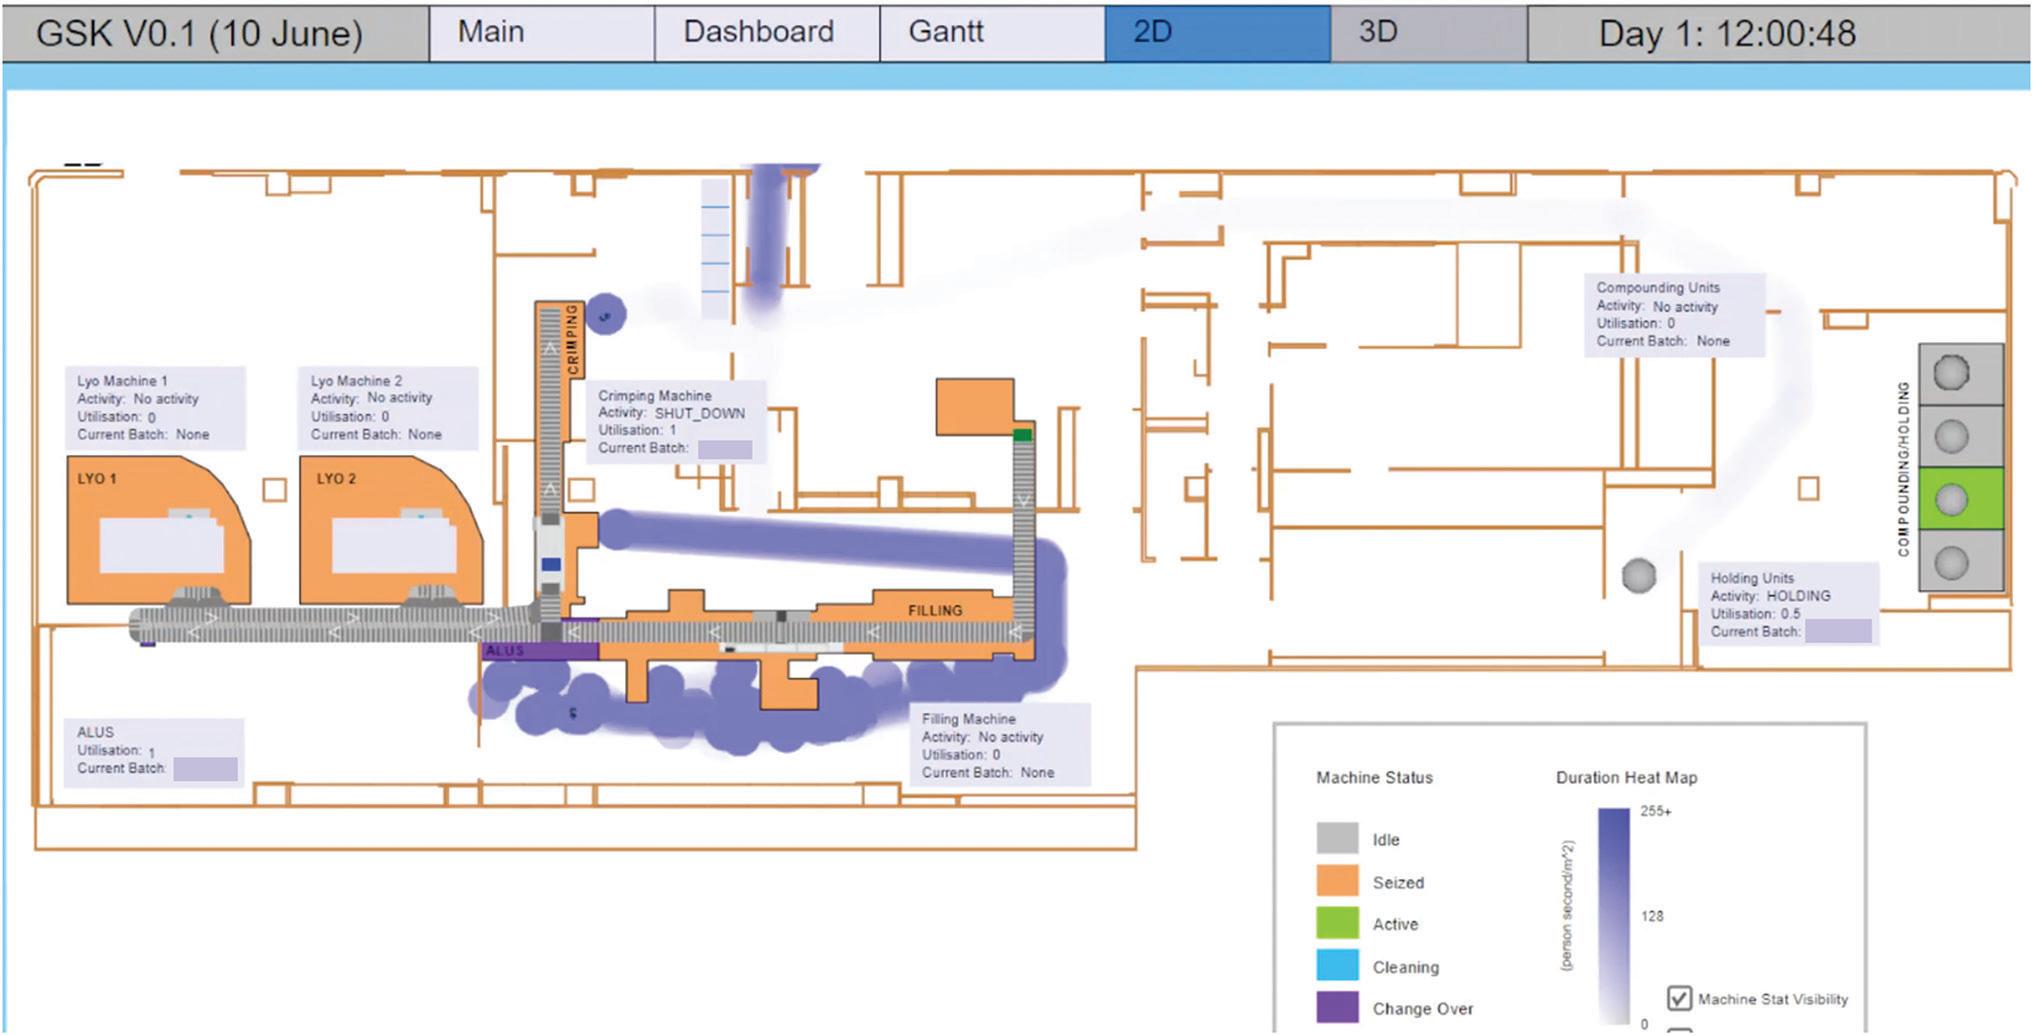
each machine’s current batch, activity and utilisation, as well as worker movement. The model is flexible and allows the user to control many different variables such as maximum length of queues, frequency and length of equipment failures, the number of available resources etc. The model produces a comprehensive set of outputs which the user can use to infer where the processing bottleneck is and if the number of machines/resources they selected is optimal. Figure 2 shows the 3D view of the model, providing batches on the conveyor belt as they go through different machines and workers moving around the environment. “The model has been fundamental in defining the right sizing of the facility as well as exploring the different product mix taking into account several variables (batch size, product type, shutdowns, change overs) by running multiple scenarios and sensitivities analyses. It also offers scheduling optimisation opportunities
that can’t be achieved via traditional approach, leading to a more efficient use of the facility“: Site Strategy Lead (Italy).
The FEED Team used the model to generate hundreds of plausible scenarios and test many different demand forecasts, equipment technologies and size, quantity of key equipment and allow them to understand the true operational bottleneck. The model has been used in different stages of demand and this continues.
A SECOND APPLICATION: ORAL SOLID DOSE (OSD)
GSK has a well-established facility in the south of England and was considering whether to invest in updating to increase capacity at the site. The biopharma filling facility model had proved its utility for informing a business case, so GSK asked Decision Lab whether the model could be adapted. Decision Lab had
IMPACT | SPRING 2023 25
© Decision Lab
FIGURE 1 2D VIEW OF THE “ITALIAN” MODEL
intentionally developed the biopharma filling facility model in a flexible way, so that it could be applied more generally. This, in accordance with the FEED philosophy of reusing parts of design work on multiple projects (to accelerate the studies), meant that GSK could engage Decision Lab to adapt the model.

For the facility in England, we needed to carry out a study into how much new equipment was needed for the required increased capacity. This would involve running scenarios where we would consider different numbers of equipment and its performance to determine what the minimum number was to deliver the desired capacity. It's important to capture the key factors that influence the KPIs, including shift patterns, product mix, machine failures, etc. They will contribute to a more realistic solution – closing the simulation to real-world gap – and will enable the model to adapt to any future changes in business processes (which
won’t require an entirely new model). In the facility, the product is moved between the machines in containers, so we had to be able to calculate their number, also the space for these containers, and how much resources are needed to run the facility. Another question of interest was about budgetary efficiencies, e.g. if we don’t buy a certain machine, how much capacity can we deliver? Basically, we want the model to allow us to identify the breaking points in the system.
The model provided a great starting point for us in terms of rapidly developing a model from a proven capability. We could add the required features and functionality to a working model that would allow us to run the range of scenarios that were needed. It also gave us greater confidence in the output. When you’re unsure about a model’s reliability, you might add a buffer to account for errors – for example buying extra machines which may or may not be needed – but of
course using this safety buffer in the plan costs money. So, minimising this buffer by having a more accurate prediction can create a huge saving.
Figure 3 shows the main runtime visualisation of this model, providing information about each machine, which batch to which they are currently assigned, their utilisation and queue size. We also had the benefit of a preexisting Excel-based model for the site in England. We realised that this could not be used for the study because it could not handle the complexity involved with multiple SKUs, multiple ways to process the product between different machines, interdependencies between parameters, etc. However, it did provide useful insight into the current facility and processes, and a baseline for some model intercomparisons.
With the increasing pressures, our timelines often become shorter. In the past we could have had six months to run a study but now we only have two months. Therefore, time becomes a
IMPACT | SPRING 2023 26
© Decision Lab
FIGURE 2 3D VIEW OF THE “ITALIAN” MODEL
critical factor that often drives decisions about the tools that we put into action. Having a baseline model we can quickly adapt was crucial to this project, and we were well placed that we had developed the biopharma filling facility tool as a generic model that we can use for different projects and requirements.
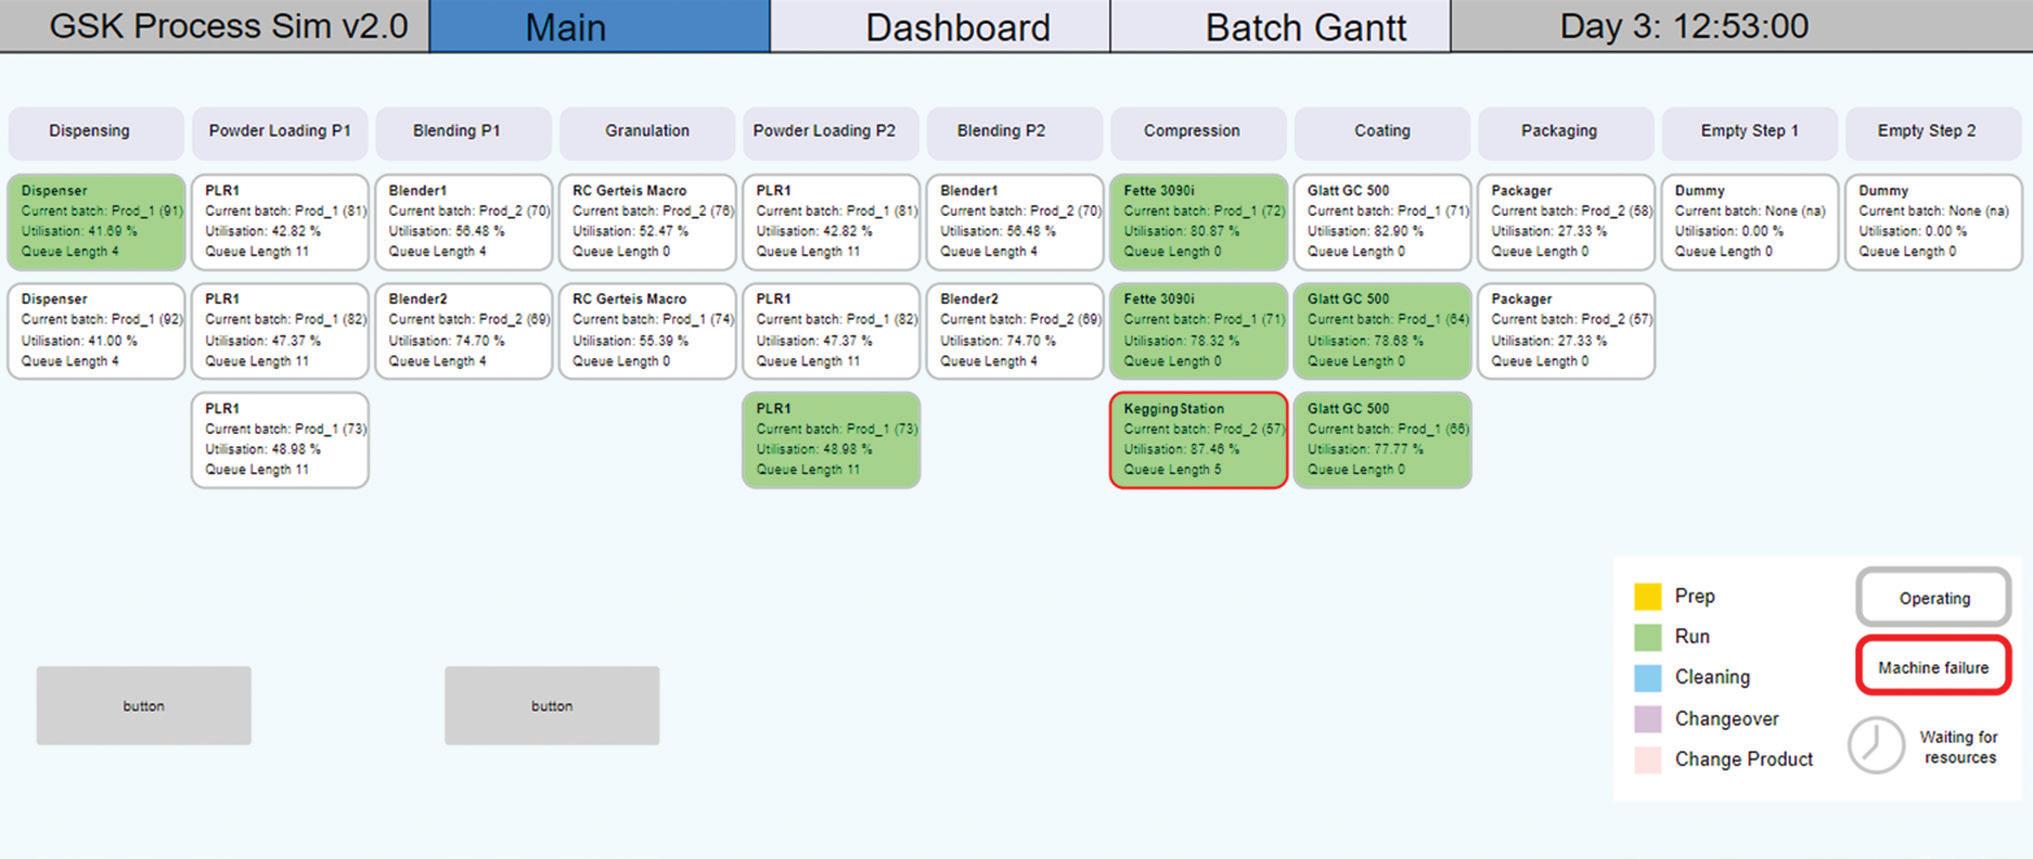
The model for the OSD facility allows us to see how the change of different inputs influences how long it takes to process all the demand and how efficient the equipment and resource usage is. For example, with a particular configuration, what percentage of the demand for this drug are we going to meet or even if we have some spare capacity. Our focus was very much on capacity and the equipment required to deliver it, as this has major cost implications. However, in the future we can expand it to consider aspects such as figuring out the best space layout that would allow for the best operations.
The model for the OSD facility allows us to see how the change of different
inputs influences how long it takes to process all the demand and how efficient the equipment and resource usage is
There are also other ways in which we can develop it, and these reflect the stages of the site itself. To build the facility, we need to plan it first. This was why we developed the model to enable us to conduct the study to work out the design that allows the site to meet the demand as cost effectively as possible. While the site is being built, the model can be further adapted so that it can be used to refine the details of the plan or address detailed issues that come up, and this could be especially important if unexpected changes are required or there are demand fluctuations that could impact the solution.
Once the site is built, the model, with minor enhancements, can become an operational support tool. It could be used to help make decisions by providing modelling results to complex questions for specific situations that arise, and
some may even require optimisation solutions. Some examples are optimising batch production, predicting capacity over the next six months.
WHAT THE FUTURE MIGHT HOLD
Decision Lab and the FEED team have developed a modelling capability to support the business case for large scale investment in pharma production facilities, one in the facility in Italy, and one in the UK. As part of this process, GSK has assessed the top benefits of the modelling activity and identified that it:
• Results in a faster approval timeline –the trust in the modelling outputs has smoothed the stage gate approval of the concept and allowed faster moves into the next project phase.
• Provided depth and breadth in its analysis, with its ability to evaluate over 200 different business scenarios in a short amount of time.
• Provided a high level of confidence in the amount of equipment required
IMPACT | SPRING 2023 27
FIGURE 3 THE MAIN RUNTIME VISUALISATION OF THE “SOUTHERN ENGLAND” MODEL
© Decision Lab
for the new production line that ultimately led to capital expenditure reduction of 20%.
The collaboration made a material difference to the business and both the Italian facility and UK facility went to the construction phase. Our tool has the capability to deliver continued value to the project so that in the future it will be possible to further evaluate capacity requirements as function of the demand forecast variability. The model also has the capability to be extended to people and material flow for the final operational layout.
Together, the GSK FEED project team and Decision Lab have laid the foundation for the future. Over the years we developed a new methodology that now can be applied and scaled to most of the pharma processes and investments. This will deliver speed and efficiency in the FEED and a greater confidence for the decision makers in the business. The next challenge will be to further develop
such models so that they can be used by the operational team once the facility has been commissioned and handed over. That could lead to even greater benefit to the business, reducing cost of goods, inventory, and many other KPIs.
Over the years we developed a new methodology that now can be applied and scaled to most of the pharma processes and investments

Giovanni Giorgio is a Senior Digital Engineer at GSK. Giovanni is a Chemical Engineer with 15+ years of experience in the pharmaceutical industry (R&D and Global Manufacturing), with a strong background in API chemical & process engineering and with an intensive and diversified experience acquired in different business units. Giovanni is currently leading the modelling and analytic strategy in the Front-End Engineering and Design team in Global Capital Projects. He has developed an interest in applying
advanced modelling techniques to solve complex business problems.
Natasha Zheltovskaya is Decision Lab’s head of marketing. She has worked in marketing for more than 15 years, leading the brand development work for some of the world top brands in retail, fast moving consumer goods (FMCG) and technology.
Peter Riley is a Principal Consultant at Decision Lab where he is leading the simulation team. Peter has built agentbased, discrete event and system dynamics simulations for a wide range of industries, including pharmaceutical, retail and defence.
Jacob Whyte is a Simulation Consultant at Decision Lab. His background is in computer science. Jacob develops digital twins and simulation models for clients and is working on a major simulation model for creating synthetic data for AI model training.
IMPACT | SPRING 2023 28
CHANGING THE ROLE OF LOGISTICS
BRIAN CLEGG
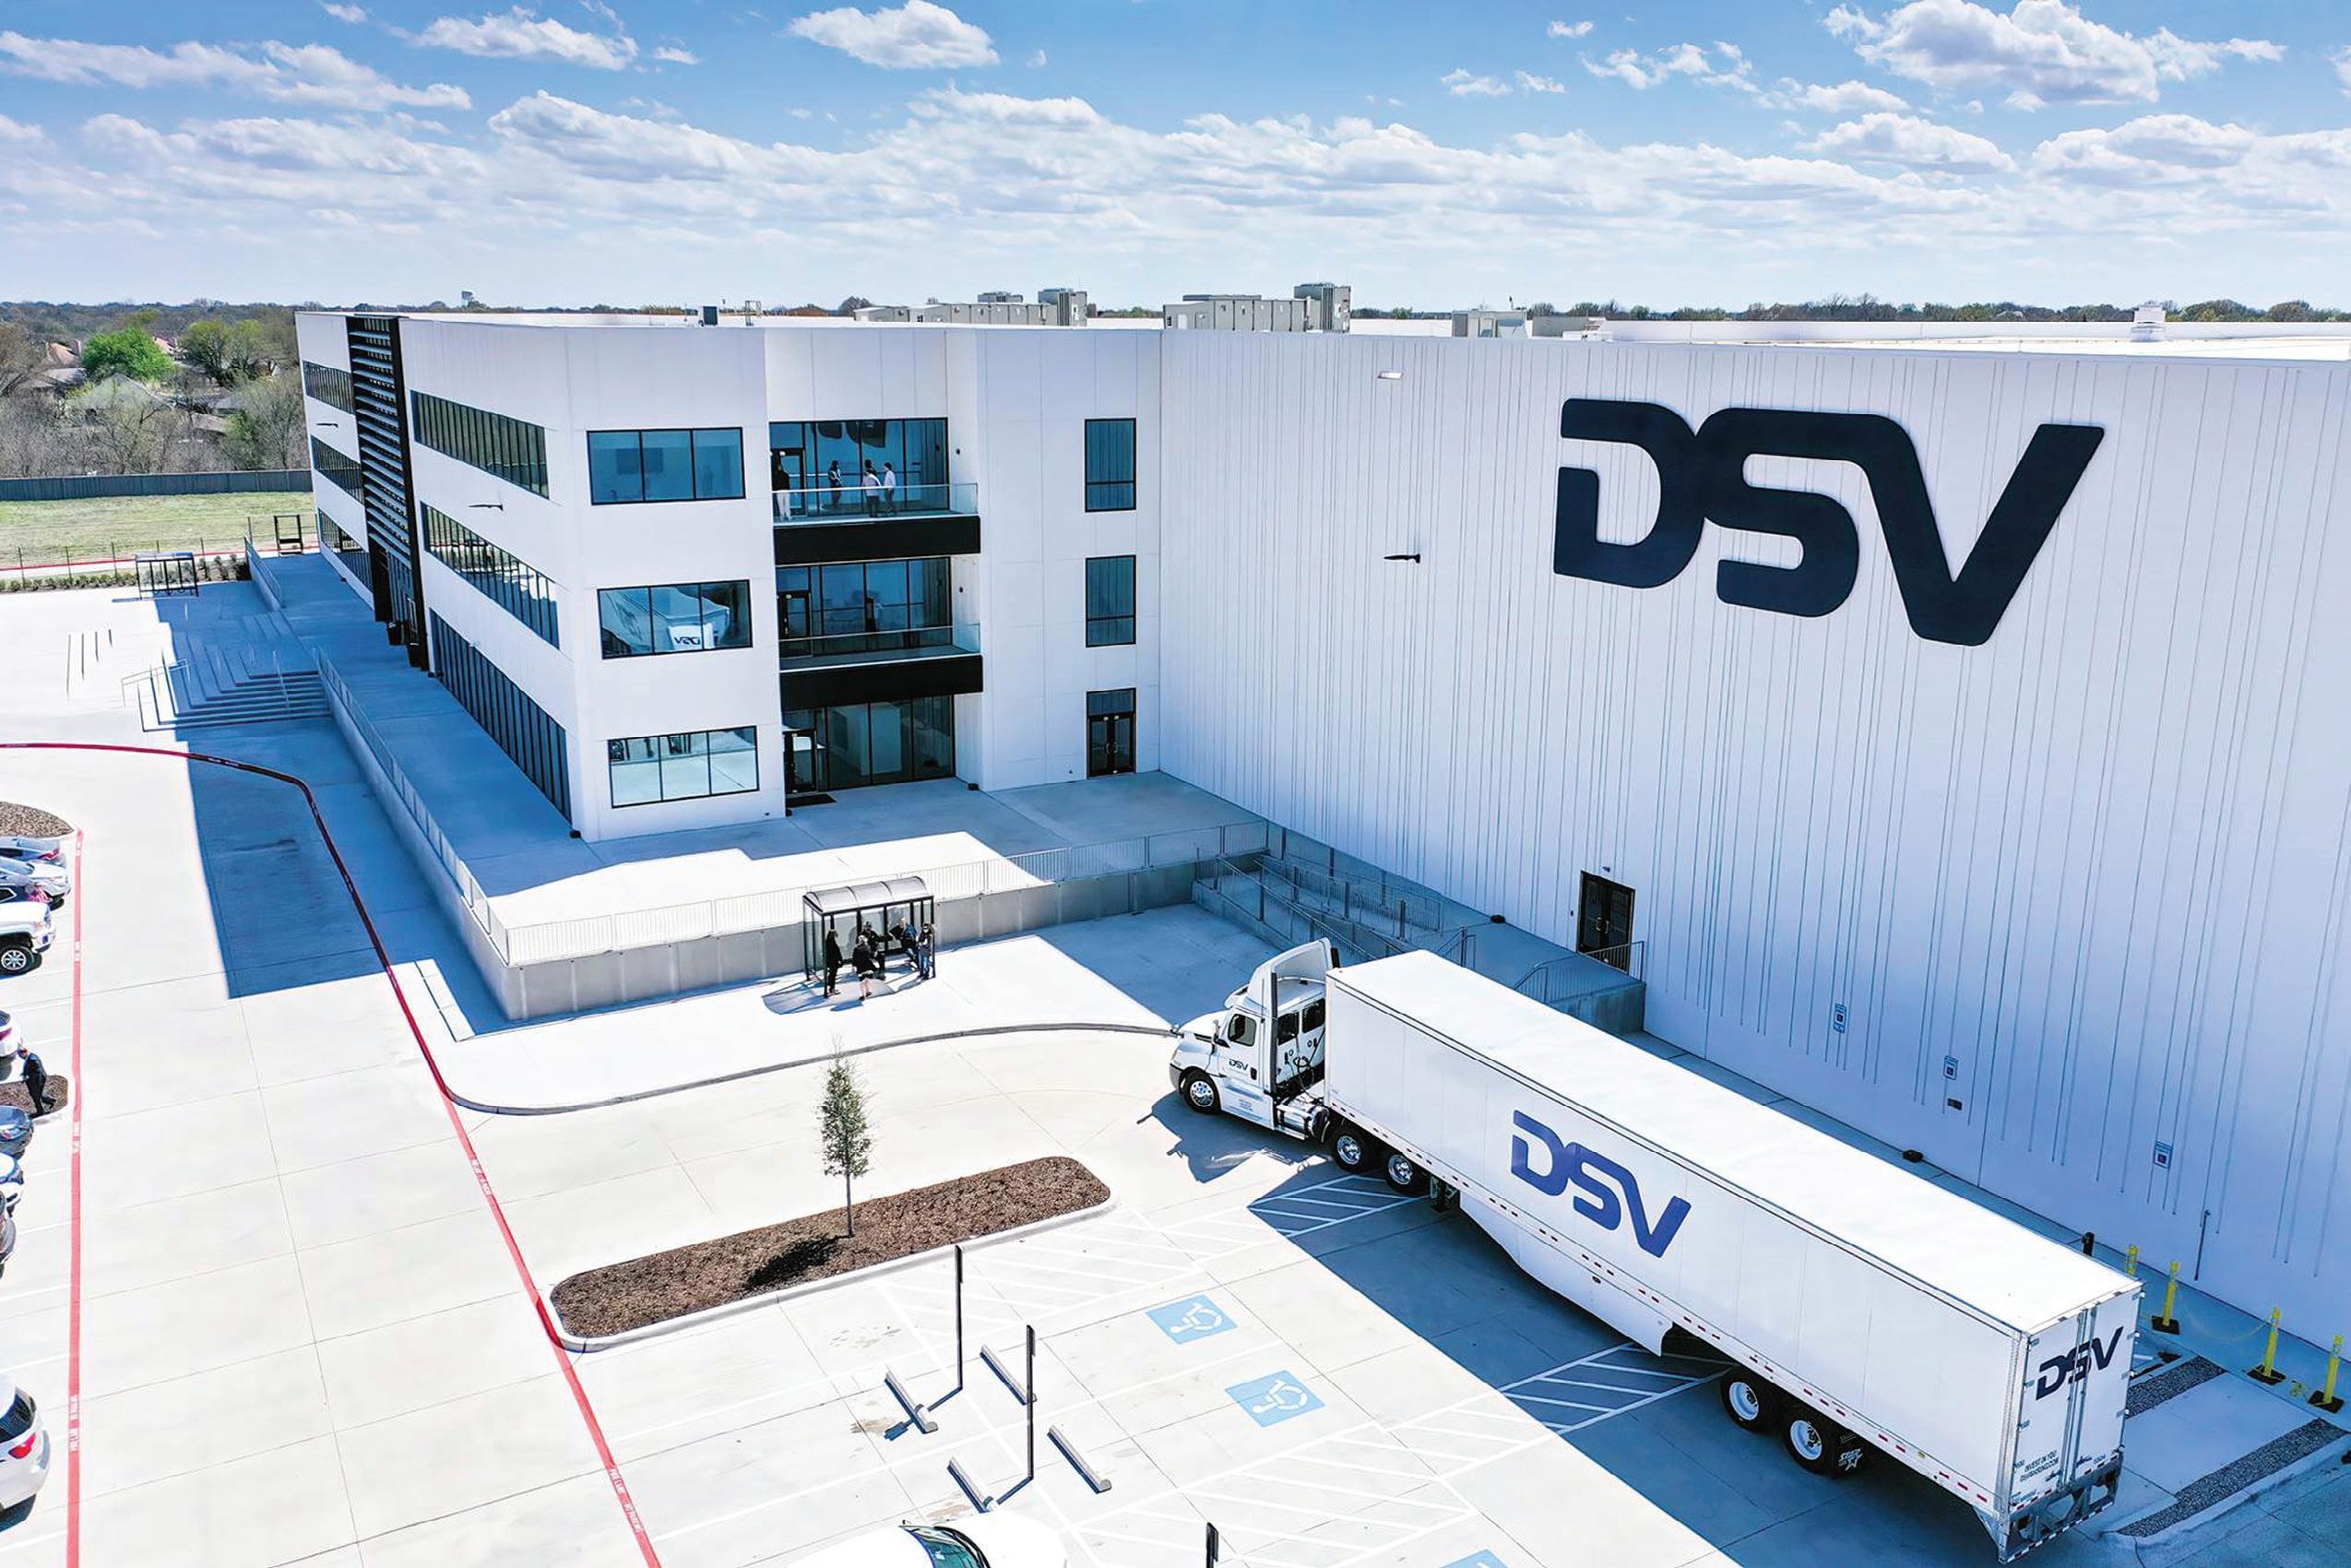
THIRD-PARTY LOGISTICS (3PL) PROVIDERS specialise in handling inventory for other firms. But back in 2013, Panalpina World Transport took part in a meeting at Cardiff University that would result in taking a whole new look at the way that stock is handled. Panalpina later became part of the DSV group (at the time of writing, the third largest 3PL firm in the world, with over 60,000 employees), but the Knowledge Transfer Partnerships established with Cardiff have continued to provide fresh Operational Research insights for the business.
Heading up the Cardiff side of the partnership is Aris Syntetos, Distinguished Research Professor of Operational Research and Operations Management and holder of the DSV Chair of Manufacturing and Logistics. After a first degree in business administration at the University of Piraeus (at the time, the Graduate School of Industrial Studies) in Athens, Aris went on to take an MSc in quality management at Stirling University, where forecasting became a particular interest for him, then a PhD in Operational Research at Brunel
IMPACT © THE OR SOCIETY 29
© DSV
University. Now at Cardiff University, Aris heads up the PARC Institute of Manufacturing, Logistics and Inventory, based in the Cardiff Business School (CARBS) of Cardiff University. It was started with direct funding from Panalpina (hence the PAnalipina Research Centre) as a joint industryuniversity partnership. The initial interest was inventory forecasting.
why not make use of this technology to make the parts to order, providing socalled distributed manufacturing?
The 3PL business is all about managing other companies’ inventories, but holding items in stock comes with a cost. The scale of this is brought home by the statistic that the total value of inventory in the US is equivalent to around 15 per cent of its gross domestic product. Traditionally, 3PL companies simply looked after whatever stock their clients requested, but the Cardiff partnership decided instead to look at ways to reduce the amount of inventory that was being held. This might seem counter-intuitive as a strategy for a 3PL company – effectively they were aiming to make things cheaper for their clients, hence reducing revenue – but this would improve service levels and make the company more attractive to potential customers.
AN END TO CONVENTIONAL INVENTORY?
Although forecasting was the reason DSV initially contacted the Cardiff team, the partnership soon came up with a more radical option. Would it be possible not to hold any inventory at all? This might seem to totally defeat the purpose of being a 3PL provider – but a new technology suggested that such an approach could be possible: 3D printing. Instead of taking up expensive storage space, holding for example spare parts,

There has been a long-established use of 3D printers in prototyping and design. These devices are a little like inkjet printers but rather than putting ink on paper, they deposit layer after layer of materials such as plastic or metal to build up what can be a complex three-dimensional structure. Inventory of consumables for the 3D printing would be miniscule in comparison to the inventory required for all the various parts. It is only relatively recently, however, that 3D printing has been seen as a potential part of production manufacturing – and it was an entirely novel approach to bring it into the logistics world. Fundamental to the technology’s wider use has been improvements in the hardware and software, which is seeing some print times falling from hours to minutes.
A key area with potential for stock reduction was spare parts inventory. Spares can often be slow moving stocks, where items have to be held for years or even decades, so provided an ideal focus

for an attempt to replace inventory with on-demand manufacture – especially as spare parts are simpler to produce in this way than a complete product. A significant issue here proved to be end of life orders.
When a product is no longer being made, the manufacturer usually has to continue to provide spare parts for a number of years, both to cover warranty requirements and to enable customers to continue using the product for its expected lifetime. As Aris comments
‘This is a notoriously difficult problem as you need to be able to commit to providing spare parts for the next 5, 7, even 10 years. Either you end up with a lot of stock and you don’t know what to do with it, or you’re going to run out and not be able to meet contractual obligations. It was a key question: can we rely on 3D printing, instead of having to make this extremely difficult decision, which always leads to something going wrong?’
Aris works with CARBS, but the School of Engineering was also brought in to look at quality issues that were prevalent with 3D printing
IMPACT | SPRING 2023 30
A DSV WAREHOUSE © DSV
technologies, while the O.R. side (from CARBS) provided an analytical approach, modelling these novel forms of inventory management and their potential impact on stock holding costs. One particularly effective approach was to base employees from Panalpina (and later DSV) in the Cardiff centre, bringing both academic and practical expertise together.
The initial O.R. input was in the development of an inventory forecasting tool, which like subsequent solutions for DSV were put together in an Excel environment using Visual Basic, as the clients were familiar with the use of the spreadsheet, making the joint implementation of the tools developed this way more effective. Algorithms developed by Aris and his colleagues fed into the systems that the joint team would then use in practice. Forecasting was based on taking historical demand data along with associated inventory movements and using it to simulate the impact of alternative approaches.
an inventory forecasting tool [was] put together in an Excel environment using Visual Basic, as the clients were familiar with the use of the spreadsheet
As the idea of 3D printing took hold, a second venture was required to help with a key decision process. Not everything can be 3D printed. Existing 3D printing companies had already developed so called Printability Indices, which would give an online score for the effectiveness of 3D printing for a particular item, but these were relatively limited. The Cardiff team was able to make the approach more comprehensive and more suited to the particular model being used in the partnership with DSV and the specific technology available to them.
SMART OUTSOURCING
With 3D printing becoming a more significant part of the mix, yet another

new way of working emerged. A 3D printing business can have significant spare capacity, which suggests the opportunity for outsourcing. As Aris notes ‘Traditionally this involved company A always having the opportunity to outsource to company B – but how about looking at having companies A and B developing a mutual arrangement, each outsourcing to the other as demand required?’ This so-called bidirectional partial outsourcing would give both parties greater flexibility. What’s more, the use of 3D printers, particularly with bidirectional outsourcing, also made possible a more distributed approach. Where 3PL companies have traditionally often needed to ship parts from country to country, localised 3D printers could reduce the shipping cost and the impact on the environment.
By 2015, Panalpina had a 3D printer operating at Eindhoven in the Netherlands. Spare capacity on the Panalpina printer was made available to Shapeways, a Dutch originated 3D printing company that has become well-established in the US. The Cardiff team used data from this experience to build a model for a number of companies outsourcing to each other in a network – a novel approach to supply chain modelling.
Whether working with DSV or providing direct support for businesses, the Cardiff centre has been able to help with a range of inventory requirements. A good example is Accolade Wines, a global wine business that has the largest wine warehouse and distribution centre in Europe. While bottles of wine aren’t yet available from 3D printers, the team has been able to improve the company’s production and inventory forecasting capabilities. Thanks to the Cardiff team’s algorithms, Accolade has been able to fundamentally change the way they
IMPACT | SPRING 2023 31
RESIN 3D PRINTERS AT CARDIFF’S REMAKERSPACE
© Cardiff Business School
calculate the safety stock levels needed to avoid running out of product.
According to Richard Lloyd, Accolade’s General Manager (European Operations & Supply Chain) ‘Whilst it is not possible to quantify the financial benefits of these changes there is no doubt that they have led to a distinct reduction in the amount of cash Accolade Wines has tied into inventory. The project has most certainly, directly and indirectly, positively impacted approximately 400 employees across the South of England.’ Similar assistance for Yeo Valley, the UK’s largest organic dairy producer, has, according to Managing Director Robert Saxton, provided stock holding and commercial opportunities that have led to ‘approximately £3m worth of cash and trading benefits.’
FEEDING THE CIRCULAR ECONOMY
Yet another new approach that has come out of the Cardiff work was to realise
that the use of 3D printers to deal with end-of-life spare part requirements could be taken further to deal with broken products that previously would have to be discarded because there was no way to repair them. There is a lot of interest now in the circular economy: here, rather than discard defunct products, they are repaired or refurbished and brought back into use. In response, Cardiff has opened the RemakerSpace facility in its brand-new social sciences research park (SPARK).
Where 3D printers have traditionally been seen as part of the ‘maker space’, whether for design and prototyping or manufacturing, here a member of the public can come with something broken and a replacement part is designed, printed and used to fix the product, bringing it back into use. As with the other work of the partnership, DSV is now bringing the remaker concept into their portfolio to introduce their remaker services and make it more of a commercial proposition.
What the work of the PARC Centre has shown is the way that the Operational Research approach can enable companies to take a totally different look at their products and services. Former DSV Solutions Design Director, Andrew Lahy, commented that the Cardiff projects were ‘essential in implementing a vast number of changes within our organisation from a strategic level all the way down to the tactical level.’

assistance for Yeo Valley, the UK’s largest organic dairy producer, has, according to Managing Director Robert Saxton, provided stock holding and commercial opportunities that have led to ‘approximately £3m worth of cash and trading benefits’
According to Lahy, ‘one particular customer cut lead times down from 120 days to 20 days. This has had a hugely positive impact on their sales… customers now make more products locally and do not hold as much inventory due to the reduced lead times which has reduced waste.’ Finally, DSV has benefited from introducing 3D printing as a service. Lahy again: ‘The above changes have no doubt had a vast impact on the overall profit of the organisation. Prior to beginning our Knowledge Transfer Partnership projects with Cardiff University, Panalpina was losing 40 million euro per year. At the time of DSV buying Panalpina, and after implementing these changes, we were making 10 million euro per year which is an overall annual profit benefit of £50M.’
The above changes have no doubt had a vast impact on the overall profit of the organisation
Logistics is sometimes portrayed as a necessary but boring part of keeping a business in operation – but here, leading edge technology and smart thinking from the Cardiff team have transformed the way that inventory is handled.
Brian Clegg is a science journalist and author and who runs the www.popularscience.co.uk and his own www.brianclegg.net websites. After graduating with a Lancaster University MA in Operational Research in 1977, Brian joined the O.R. Department at British Airways. He left BA in 1994 to set up a creativity training business. He is now primarily a science writer: his latest title Interstellar Tours explores the science you would experience on a starship tour of the Milky Way.
IMPACT | SPRING 2023 32
© SPARK
THE SOCIAL SCIENCE RESEARCH PARK (SPARK) CARDIFF UNIVERSITY CAMPUS
CRIMESTOPPERS IMPROVES STAFF WELLBEING WITH SIMULATION
NAOUM TSIOPTSIAS AND FRANCES SNEDDON
CRIMESTOPPERS IS AN ORGANISATION WITH A VITAL ROLE TO PLAY. It serves as a conduit between police and public: a way for anyone to anonymously report a crime, either one carried out or one being planned. It performs a vital function as a valuable source of information to police services and, as such, needs to be operating at maximum efficiency.
The not-for-profit runs a single UK contact centre and has experienced around a 50% increase in contacts from the public over the last five years,
but without a corresponding increase in its provision. The resourcing team was aware of feelings among staff that operationally they were being stretched, but there was no data available to provide evidence on just how busy the staff were.
Was there room for efficiency savings or did the contact centre in fact need more staff? Crimestoppers undertook an assessment of its call handling management and selected Simul8 to help stress test its operations through simulations under a variety of

IMPACT © 2023 THE AUTHORS 34
©
Crimestoppers
different scenarios designed to reflect real life patterns of demand.
STAFF RESOURCING
Over the last few years, contact centres have been questioning the way that they plan staff resourcing. The traditional method for calculating staffing levels has been to use the Erlang formula, but this is increasingly seen as inaccurate. Therefore, all contact centres are looking for more accurate ways of working out appropriate employee levels; ones that can better reflect real work practices. The method that has produced particularly effective results is simulation. This technology provides contact centre operators with a much more realistic model of how a contact centre operates, simulating changing levels of demand and providing
accurate data on how well equipped it is to manage incoming contacts in the most efficient way possible.
For Crimestoppers, this is where Simul8 came in, and it received a licence to use the simulation software on a pro bono basis as part of the company’s support for charitable organisations. One of Crimestoppers’ key personnel already had experience of using Simul8’s simulation software and chose it to help with the process. It would be used to gain full visibility over its contact centre operations and for the first time indicate exactly how the organisation was set up to cope with its demands.
CRIMESTOPPERS’ CHALLENGES
This was not a trivial task. Crimestoppers is no small undertaking. It’s an organisation that has been in the
UK for 30 years and handles 600,000 contacts from the public annually, resulting in 175,000 criminal reports made to the police each year. It’s open 365 days a year, 24 hours a day, seven days a week.
Staff take information online or by phone – with a roughly 50:50 split, with each channel having its own response processes in place.
Crimestoppers needs to ensure that the information is handled promptly and efficiently, but there’s also a duty of care to its employees. This is something that the organisation pays great attention to. Many of the phone calls can be distressing, dealing with sensitive subjects like child sexual abuse or violent crimes, so it’s important that the wellbeing of the staff receiving those contacts is given the highest priority and they are not overstretched to breaking point. As Karen Ogborn, Crimestoppers’ chief of staff said, ‘The complexity of all the different things they’re dealing with can be quite stressful. We have to deal with the challenges of the job –which are different from the selling environment in other contact centres.’

BLENDING ART AND SCIENCE
Because of these challenges, the organisation didn’t have the luxury of working from home during the pandemic, as many companies did. Much of the material that was being handled was very sensitive and not suitable for being dealt with at home, while there was also a fair degree of online form filling to be processed. Consequently, any changes had to take effect within the structure of the office and nowhere else.
But the concern for employees’ wellbeing wasn’t the only issue that
IMPACT | SPRING 2023 35
©
Crimestoppers
the organisation had to consider when re-evaluating the requirements of the contact centre. There was a need to make sure that all calls could be handled efficiently – and that means ‘dealing with the changes in demand to make sure that we can offer a complete service,’ said Ogborn.
and each of their processes, which would quickly become extremely challenging without the help of this technology.
model that more people were required to be on duty at the weekdays. In Figure 1 presented calls are in purple and answered calls are in light blue. By exploring the relevant gaps for each line in becomes clear which lines are the busiest. Figure 1b indicates that the Crimestoppers line offers interesting and relevant output.

concern
for
employees’ wellbeing wasn’t the only issue that the organisation had to consider when re-evaluating the requirements of the contact centre. There was a need to make sure that all calls could be handled efficiently
This ‘complete service’ covers a variety of different functions. The full set-up includes Crimestoppers itself, as well as four other services each, again, with different processes to follow. These include the Home Office immigration enforcement line, energy safe line, NHS fraud line and the integrity line for whistleblowing calls.
Staff at the contact centre can work across any of these services and will get moved around depending on demand. This is where Simul8 really makes a difference. The modelling can account for all of the different streams
In addition, Crimestoppers has been looking for opportunities to work with other organisations as well as the police service. It’s starting to talk to the fire service, offering a similar facility to that of the police. ‘There’s no single national fire department, but separate ones for individual counties. We’ve started running services with a few and are now looking to offer a service to all of them,’ Ogborn added. This will require further variables being built into a resourcing model, but the use of Simul8 means that, from a process optimisation perspective at least, this won’t be a problem.
GENERATING EVIDENCE
‘Simul8 is playing a vital role in changing the way that our organisation manages staffing,’ said Ogborn. ‘We are able to demonstrate to our management team that, through modelling, if we can build a little more capacity into the system, we’d have the flexibility to respond to demand. This not only changes over a 24-hour period but seasonally too –we are able to deal with all of that.’ It became clear through the use of the
We are able to demonstrate to our management team that, through modelling, if we can build a little more capacity into the system, we’d have the flexibility to respond to demand
OPERATIONAL SIMULATIONS
In a short space of time, Simul8 has become essential to the way that the organisation is run. It was initially selected to examine a business case for employing more staff, but now it provides guidance to the management team on a variety of different issues on a daily basis.
For example, the use of Simul8 has meant that the organisation is better able to assign priorities to calls and to handle responses better. There is a target to deal with online communication within four hours and there was also a
IMPACT | SPRING 2023 36
© Simul8
FIGURE 1 WEEKDAY DEMAND ON CRIMESTOPPERS ( a ) ALL LINES, ( b ) CRIMESTOPPER CALLS ONLY
chance to assess the effectiveness of the rate in which calls were picked up.

The implementation of Simul8 has been a great success. ‘The Simul8 installation has been smooth: the team installing it was fantastic, but it helps that you can pick up the phone to virtually anyone to get queries answered,’ said Ogborn. ‘On top of that, the help within the system is really useful, giving us everything we need. And it was easy to handle. You don’t need to be technical to make the tweaks,’ she added. The pressure on Crimestoppers can be intense, given the nature of its calls. ‘We’re much more like a 999 service – even if it’s not quite as stressful as that.’
The Simul8 project is an example of a system that has fulfilled its dual purpose: that of improving response rates and, at the same time, helping employees cope with the pressure of their jobs. While Simul8 was chosen initially to build a
data-driven business case as to whether the system was up to scratch, it has since become an indispensable tool in daily planning, helping the organisation to manage its full capacity among the constantly shifting dynamics of a busy contact centre.
the system…has…become an indispensable tool in daily planning, helping the organisation to manage its full capacity among the constantly shifting dynamics of a busy contact centre
Contact centres can be demanding environments at the best of times, and Crimestoppers has the added responsibility of dealing with sensitive and stressful calls. Simul8 offers them the opportunity to optimise operations and work towards process excellence.
Naoum Tsioptsias is a Senior Simulation Consultant at Simul8 with background in finance, informatics and O.R. and with research experience on the interconnections of simulation and learning. He has collaborated on manufacturing and service projects and has a keen interest in data and statistical analysis, including data mining.
Frances Sneddon, a Chief Technology Officer at Simul8, is passionate about all things tech and data. Over the last 20 years she has helped organisations across the globe use simulation to achieve better business outcomes. At heart, Frances is a maths geek turned developer, but it’s her expertise (and passion!) as a business leader that have helped grow SIMUL8 Corp from a start up to the global leader in the simulation market.
IMPACT | SPRING 2023 37
UNIVERSITIES MAKING AN IMPACT

This issue reports a project carried out at the University of Edinburgh. If you are interested in availing yourself of the opportunity to have a project to help your organisation please contact the OR Society at email@theorsociety.com
AIRPORT-ACCOUNTABLE RESILIENCE (Matt Tench, University of Edinburgh, MA Business with Decision Analytics)
London Gatwick is the 8th busiest airport in Europe by annual passengers and 2nd busiest in the UK. With capacity reaching 55 flights per hour, London Gatwick has the most efficient single runway of any commercial airport globally.

After London Gatwick released a large number of new slots in 2014, the regulator (the Civil Aviation Authority) and London Gatwick's customers (the airlines) blamed a decrease in punctuality during 2014-16 on a perceived lack of ‘resilience’. London Gatwick has been working on enhancing its operational resilience ever since. Matt’s undergraduate dissertation was the fourth collaborative project run with the University of Edinburgh in this context and was by far the most impactful.
There were two key questions that the aviation industry needed answers to. Firstly, what ‘resilience’ is an airport operator accountable for in the first place? Secondly, how do you measure that? It is difficult to disentangle the contributions from multiple actors, as a single large airport is an ecosystem of hundreds of different organisations (airport operator, air navigation service
providers, airlines, ground handlers, aircraft fuelling companies, etc.). Until the industry answers those two questions, ‘resilience improvement’ programmes are destined to fail.
To unravel the tangle, Matt developed the world's first method to isolate the resilience that an airport operator is accountable for, after a previous project identified boundaries where accountability is passed between airlines, airports, and airspace operators. Matt's method looks at historical data on a flight-byflight basis, with a formal test to classify every movement as either ‘resilient’ or not. From there, data visualisation techniques pinpoint relevant subsets of operations to an analyst that need additional scrutiny, leading to further problem solving and well-targeted investment in improving resilience.
Matt devised the resilience tests directly out of fundamental principles of operations management (grounded in queueing theory) and found a very effective way to convey the results and insights from the tests through two novel charts (the ‘resilience pipe’ and ‘resilience square’).
Gavin Sillitto, Main Runway Optimisation Programme Lead at London Gatwick, comments: ‘Over the course of the four projects with the University of Edinburgh, we have fundamentally altered our understanding of resilience, from meaning either “redundant capacity” or having suitable plans to deal with specific “major events,” to dealing with the kinds of difficult day to day conditions that any airport can face, whatever the cause. This changes our mindset from having the capacity to deal with the busiest day of the summer, to delivering an excellent customer experience on every day of the year’.
‘The aviation industry's focus on on-time performance and identifying causes of delay as a starting point, leads to exceptionally high effort on data capture and validation. Matt's tests and visualisation methods allow us to bypass the “blame game” and move straight to actionable insights about the parts of the operation we can impact. As such, London Gatwick have designed their new Aerodrome Continuous Improvement Cycle around this new capability’.
IMPACT © THE OR SOCIETY 38
I AM NOT A ROBOT
Geoff Royston
You will have doubtless come across CAPTCHA tests on the internet, where you are asked to demonstrate your human identity by ticking a checkbox or recognising an image. Have you noticed that they are getting harder? Have you wondered why?
Captcha tests have become more difficult for people to complete due to advances in artificial intelligence and machine learning algorithms. As bots become more sophisticated, captcha tests have had to evolve to become more complex and difficult for bots to solve, which unfortunately has also made them harder for people to complete.
Unless you have been living on a remote island, cut off from the outside world, the rise of what is commonly termed artificial intelligence (AI) will not have escaped you. For example, there has been much in the news lately about ChatGPT; an advanced AI chatbot designed to mimic a human conversationalist. It is able to give structured textual answers to questions, drawing on a huge base of information – but is able also to write computer programs, compose music, and even write poetry. Microsoft, a major investor (to the tune of $10 billion) behind ChatGPT, is already using it in its Bing search engine and plans to embed it in Word, Powerpoint, and Excel.
SCENARIOS FOR AI
What are the implications of this accelerating development of AI for work, for workers, or indeed, for humanity? Such issues are addressed in the book Life 3.0 by the MIT physics professor, and co-founder of the Future of Life Institute, Max Tegmark.

Tegmark sees the evolution of life on Earth as having three stages: Life 1.0 (biological), Life 2.0 (cultural), and Life 3.0 (technological). The
emergence of intelligent machines, machines that break free of biology and can improve their own software and hardware, marks the beginning of Life 3.0.
In this book AI is viewed as an ever-rising sea, increasingly reaching the more elevated parts of the landscape of human abilities. AI could therefore impact society in increasingly many ways, from creating new jobs and enhancing human capabilities to displacing workers and exacerbating economic inequality. It already has the potential to transform areas such as transportation, communication, energy, finance, and medicine.
But Tegmark notes that as well as potential for huge gains there are major ethical and legal issues surrounding the use of AI, such as privacy and security concerns, problems of bias and discrimination, maldistribution of generated wealth - and worries about autonomous weapons. (He points out that there have been at least two incidents where unleashing a nuclear weapon was narrowly averted by humans making unconventional judgements in unforseen situations; would humanity have been as fortunate if an autonomous AI-controlled system had been making protocol-based decisions?).
In later parts of the book Tegmark considers the possibility that superintelligent AI (AI that surpasses human intelligence and control) eventually emerges, with outcomes that may be existential for humans. Life 3.0 presents a spectrum of associated scenarios, some utopian, some dystopian - and some arguably in between.
Other books on AI provide a range of perspectives and stances on AI’s capabilities and merits. Some, for example the short book Novacene: The coming age of hyperintelligence by the late James Lovelock (best known for his Gaia hypothesis that the Earth is a self-regulating system), take a similar view about the potential of AI to that of Life 3.0. (Lovelock suggests that humans should embrace a new symbiotic relationship with the machines they create. Hopefully more “All Watched Over by Machines of Loving Grace” than “The Matrix”.) However, a more sceptical view is taken in How to Stay Smart in a Smart World by Gerd Gigerenzer.
In this book Gerd Gigerenzer, a German psychologist and expert in decision-making, discusses the impact of artificial intelligence on human cognition and decision-making. He argues that the hype around AI has led to an overestimation of its capabilities, and an underestimation of the value of human intuition and experience. Gigerenzer emphasizes that while AI can be useful in certain contexts, it is not a substitute for human intelligence.
IMPACT © THE OR SOCIETY 39
© Penguin
Gigerenzer explains that the above “certain contexts” where AI can be useful are those which are welldefined, stable and where large amounts of historical data are available. Human intelligence on the other hand has evolved to cope with situations where the future can be highly uncertain, may not be like the past and data can be scarce. Such situations are commonplace.
He also points to deeper problems with AI. Humans have mental concepts; when they see, for example, a bus they know what it is and what it is for. AI neural networks have no concept of what an image (or for that matter, anything) represents in the world, they learn to recognise an object purely by finding associations between pixels. AI needs to be trained on thousands of images to recognise a bus while children can recognise one after seeing only a few, and AI can sometimes be tricked into completely misidentifying an object (for example a bus as an ostrich!) by a change of just a few pixels in a picture - a change people could not even detect let alone be fooled by.
How can we “stay smart” in a world transformed by AI, and not be beguiled, bamboozled - or bludgeoned - by it? Gigerenzer argues this requires understanding its potentials and risks and needs humans to develop their own decision-making skills, such as using “fast and frugal” heuristics that allow people to make quick decisions based on limited information and which in the real world can be more effective than more complex decisionmaking methods.
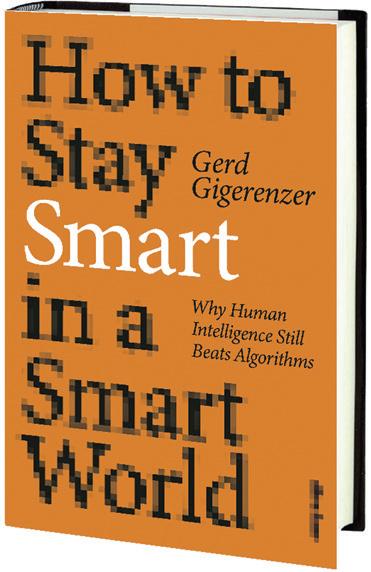
AI, ANALYSTS AND THEIR CLIENTS
Whatever the precise future trajectory for AI may be, it is clearly becoming more capable and will have considerable impact on individuals and on society as a whole. In working life, some occupations will be affected more than others - for instance, the impact on the work of artisans may be much less than on that of analysts. What sorts of relationships might emerge between AI and analysts (and their clients)?
First, research analysts of various kinds obviously have been already playing a crucial role in the fundamental development of what might be termed the soft infrastructure of AI – optimising algorithms, data structuring systems, neural network training methods and so on.
Second, building on that infrastructure, analysts working in or with all sorts of organisations have been using, or looking at using, AI as an additional tool to support their work. AI looks to become a powerful business tool - Microsoft executives clearly
think so, as do those at Google, evidenced by the launch of their own AI chatbot, Bard. Tegmark thinks that AI is poised to move beyond mastery of strategic games like chess and to be able to challenge, or help, humans in strategy development in areas such as business, defence or politics. That might or might not reduce client demand for analysts but, either way, considerably increased care would be needed over issues such as accuracy, bias and transparency. (The launch of Bard was embarrassingly marred by some factual errors in the chatbot’s responses, alerting us to the risks of, say, error-strewn but smooth-talking successors to Wikipedia).
A third possible role for analysts is in helping providing insights for their clients into the future of AI. As the above books illustrate, AI is a prime example of the need to consider alternative possible futures. Preparing for a future world in which AI features strongly is an important case of decision-making under high uncertainty, where techniques such as scenario planning and systems thinking and modelling should have a useful contribution to make.
THE REVEAL
Two paragraphs of the preceding text were not written by me; they were (part of) the responses of ChatGPT to my questions: “Why have Captcha tests got harder for people to do?” and “Write a short summary, focusing on AI, of the book How to Stay Smart in a Smart World by Gerd Gigerenzer”. (ChatGPT wrote the first paragraph of the associated text). Judge for yourself how well it performed.
Worried that AI is about to take over? Let’s see what ChatGPT thinks: “Chat GPT, please write an 8-line poem about AI.”
In circuits and code, we've created a mind, An AI of learning, programmed to find, Patterns and insights in data so vast, It learns from experience, it learns fast. It processes, predicts, and analyzes with ease, And in its abilities, we stand in unease, For as we build it smarter each day, What fate for humanity will AI portray?
The Poet Laureate can probably rest easy. For now.
Dr Geoff Royston is a former president of the OR Society and a former chair of the UK Government Operational Research Service. He was head of strategic analysis and operational research in the Department of Health for England, where for almost two decades he was the professional lead for a large group of health analysts.
IMPACT | SPRING 2023 40
© Penguin


 Nicola Morrill


