
Name:
DRAFT
Class Name:
SOUTH WALES SYLLABUS 2023 6
3
ASSESSMENT BOOK NEW
STAGE
Harry O’Brien
N W E S
Greg Purcell
MP_NSW_AB6_38220_TXT_5PP.indb 1 04-Sep-23 17:40:53
Oxford University Press is a department of the University of Oxford. It furthers the University’s objective of excellence in research, scholarship, and education by publishing worldwide. Oxford is a registered trademark of Oxford University Press in the UK and in certain other countries.
Published in Australia by Oxford University Press
Level 8, 737 Bourke Street, Docklands, Victoria 3008, Australia.
© Harry O’Brien and Greg Purcell 2023
The moral rights of the authors have been asserted.
First published 2023
All rights reserved. No part of this publication may be reproduced, stored in a retrieval system, or transmitted, in any form or by any means, without the prior permission in writing of Oxford University Press, or as expressly permitted by law, by licence, or under terms agreed with the reprographics rights organisation. Enquiries concerning reproduction outside the scope of the above should be sent to the Rights Department, Oxford University Press, at the address above.
You must not circulate this work in any other form and you must impose this same condition on any acquirer.
ISBN 978 0 19 033822 0
Reproduction and communication for educational purposes
The Australian Copyright Act 1968 (the Act) allows educational institutions that are covered by remuneration arrangements with Copyright Agency to reproduce and communicate certain material for educational purposes. For more information, see copyright.com.au.
Edited by Siddhi ChavanCover illustration by Wesley Valenzuela
Typeset by Newgen KnowledgeWorks Pvt. Ltd., Chennai, India
Illustrated by Gareth Conway, Gregory Baldwin and Daniel Rieley
Proofread by Carly Slater
Printed in China by Golden Cup Printing Co Ltd
DRAFT
Oxford University Press Australia & New Zealand is committed to sourcing paper responsibly.
Acknowledgements
NSW Mathematics K–6 Syllabus © NSW Education Standards Authority for and on behalf of the Crown in right of the State of New South Wales, 2023. NESA does not endorse model answers prepared by the Publisher and takes no responsibility for errors in the reproduction of the Material supplied by NESA.
Acknowledgement of Country
Oxford University Press acknowledges the Traditional Owners of the many lands on which we create and share our learning resources. We acknowledge the Traditional Owners as the original storytellers, teachers and students of this land we call Australia. We pay our respects to Elders, past and present, for the ways in which they have enabled the teachings of their rich cultures and knowledge systems to be shared for millennia.
MP_NSW_AB6_38220_TXT_5PP.indb 2 04-Sep-23 17:40:53
Printer FSC logo
Message to teachers
Maths Plus Assessment Book Year 6 is an easy-to-use book for both students and teachers. It provides students and teachers with an assessment book that should easily fit into the whole-school maths assessment policy of most schools.
The book is designed to diagnostically assess students at Year 6 level. Each assessment page is a snapshot of work that addresses the specific outcomes from the NESA Syllabus. The book provides students with a variety of opportunities to demonstrate their skills, knowledge and understanding of key concepts in Number, Algebra, Measurement, Space, Statistics and Probability. The pages in this book can assist with:
• assessing understanding of specific knowledge required by the NESA Syllabus
• diagnosing students’ knowledge to assist with future scaffolding of work
• providing evidence for A–E reporting
• providing meaningful work samples of students’ work and understanding. Supported by discussion, observation, hands-on experiences and teachers’ own observations, these assessment pages can become a useful component in assisting teachers to accurately assess their students.
Answers for the assessment tasks and a Student Book–Assessment Book correlation chart can be found online on the Maths Plus Teacher Dashboard.
Harry O’Brien, Greg PurcellA iii
MP_NSW_AB6_38220_TXT_5PP.indb 3 04-Sep-23 17:40:53 DRAFT
A iv Oxford University Press ISBN 9780190338220 Contents Assessment Outcomes Page Representing numbers Negative numbers Applies an understanding of place value and the role of zero to represent the properties of numbers MA3-RN-01 2 Decimals Compares and orders decimals up to 3 decimal places MA3-RN-02 3 Percentages Fractions Decimals Determines percentages of quantities, and finds equivalent fractions and decimals for benchmark percentage values MA3-RN-03 4 Additive relations Addition and subtraction Selects and applies appropriate strategies to solve addition and subtraction problems MA3-AR-01 5 Multiplicative relations Multiplication and division Selects and applies appropriate strategies to solve multiplication and division problems MA3-MR-01 6 Order of operations Constructs and completes number sentences involving multiplicative relations, applying the order of operations to calculations MA3-MR-02 7 Representing quantity fractions Fractions Compares and orders fractions with denominators of 2, 3, 4, 5, 6, 8 and 10 MA3-RQF-01 8 Fractions of measures and quantities Determines 1 2 , 1 4 , 1 5 and 1 10 of measures and quantities MA3-RQF-02 9 Geometric measure Cartesian plane Locates and describes points on a coordinate plane MA3-GM-01 10 Length Selects and uses the appropriate unit and device to measure lengths and distances including perimeters MA3-GM-02 11 Angles Measures and constructs angles, and identifies the relationships between angles on a straight line and angles at a point MA3-GM-03 12 Two-dimensional spatial structure Triangles and quadrilaterals Investigates and classifies two-dimensional shapes, including triangles and quadrilaterals based on their properties MA3-2DS-01 13 Area Selects and uses the appropriate unit to calculate areas, including areas of rectangles MA3-2DS-02 14 Area of parallelograms and triangles Combines, splits and rearranges shapes to determine the area of parallelograms and triangles MA3-2DS-03 15 MP_NSW_AB6_38220_TXT_5PP.indb 4 04-Sep-23 17:40:53 DRAFT
A v Oxford University Press ISBN 9780190338220 Assessment Outcomes Page Three-dimensional spatial structure Prisms and pyramids Visualises, sketches and constructs three-dimensional objects, including prisms and pyramids, making connections to two-dimensional representations MA3-3DS-01 16 Volume and capacity Selects and uses the appropriate unit to estimate, measure and calculate volumes and capacities MA3-3DS-02 17 Non-spatial measure Mass Selects and uses the appropriate unit and device to measure the masses of objects MA3-NSM-01 18 Time Measures and compares duration, using 12- and 24-hour time and am and pm notation MA3-NSM-02 19 Data Graphs Constructs graphs using many-to-one scales MA3-DATA-01 20 Data displays Interprets data displays, including timelines and line graphs MA3-DATA-02 21 Chance Probability Conducts chance experiments and quantifies the probability MA3-CHAN-01 22 MP_NSW_AB6_38220_TXT_5PP.indb 5 04-Sep-23 17:40:53 DRAFT
Negative numbers
1 Draw a line to match each positive and negative integer to a place on the number line.
Use the number lines to complete the number sentences. The first one has been started.
2 Use the number line at the top of the page to calculate each team’s final score.
Which team finished with the highest score?
Which teams finished with a negative score?
Match each temperature to a letter on the thermometer.
What is the temperature in Montreal, Canada, if it is 17°C less than the temperature in Brisbane, which is 25°C?
What is the temperature in Perth if it is 28°C higher than the temperature in Berlin, which is −5°C?
A 2 Oxford University Press ISBN 9780190338220
Applies an understanding of place value and the role of zero to represent the properties of numbers MA3-RN-01
–10 –8 –7 –5 –4 –2 –1 0 1 3 4 6 7 9 10 –9 –3 –6 5 2 8 4
4 − 5 − 6 + 9 = 9 8 7 6 5 4 3 2 1 0 1 2 3 4 5 6 7 8 9 −8 + 5 + 10 − 3 = 9 8 7 6 5 4 3 2 1 0 1 2 3 4 5 6 7 8 9 8 − 8 − 3 + 4 − 7 = 9 8 7 6 5 4 3 2 1 0 1 2 3 4 5 6 7 8 9
Team Mon Tues Wed Thur Fri Total Blue +10 −15 +6 −5 −2 Red +5 +4 −5 −6 +2 Gold +3 −8 +7 −6 +1 Green +4 −6 −3 +5 +8
−5°C + 10°C = 25°C + 15°C = −20°C + 50°C = 10°C − 30°C = 0°C − 5°C = 10°C − 35°C = −20°C + 40°C = 0° 5° 10° 15° 20° 25° 25° 20° 15° 10° 5° 30° 35° 40° 45° 50° 55° °C A B G C D E F
3 MP_NSW_AB6_38220_TXT_5PP.indb 2 04-Sep-23 17:40:54 DRAFT
A 3 Oxford University Press ISBN 9780190338220 Decimals Compares and orders decimals up to 3 decimal places MA3-RN-02 Give the place value of each bold digit. 1 85.387 2 52.456 3 63.079 4 369.878 5 365.964 6 502.593 Place these decimals in order from smallest to greatest. 7 5.603 5.360 5.063 8 33.326 33.263 33.632 9 952.798 952.987 952.872 Decide whether these statements are true (T) or false (F). 10 3.959 < 3.599 11 8.76 > 8.766 12 4.521 < 4.512 13 25.5 < 2.55 14 68.059 > 68.095 15 293.343 > 239.343 Show how the models can be recorded as a fraction and as a decimal. Model Fraction Decimal 100 100 100 Model Fraction Decimal 100 100 100 Convert each decimal into a fraction of 100 or 1000. 16 0.73 = _______ 17 0.29 = _______ 18 0.48 = _______ 19 0.65 = _______ Express each fraction as a decimal. 24 52 100 = 0. 20 0.259 = _______ 21 0.656 = _______ 22 0.792 = _______ 23 0.521 = ______ 25 85 100 = 0. 27 603 1000 = 0. 26 92 100 = 0. 28 758 1000 = 0. 29 77 1000 = 0. MP_NSW_AB6_38220_TXT_5PP.indb 3 04-Sep-23 17:40:54 DRAFT
Shade part of each length to match the percentage.
DRAFT
Hints for finding percentages
* 10% is equal to 1 10 , so to find 10% divide by 10
* 50% is equal to 1 2 , so to find 50% divide by 2
* 25% is equal to 1 4 , so to find 25% divide by 4 or halve and halve again
* 75% is equal to 3 4 , so to find 75% find 1 4 and multiply it by 3.
Calculate the amount of discount being offered on each item below. Subtract the discount from the marked price to give the sale price.
A 4 Oxford University Press ISBN 9780190338220
Determines percentages of quantities, and finds equivalent fractions and decimals for benchmark percentage values MA3-RN-03
Percentages Fractions Decimals
Write each fraction or decimal as a percentage. 16 33 100 _____% 17 71 100 _____% 18 0.5 _____% 19 2 10 _____% 20 0.42 _____% 21 0.81 _____% 22 1 10 _____% 23 0.02 _____% 24 10% off 25 25% off 26 75% off 27 50% off $300 $200 $120 $60 6 10% of 50 7 25% of 200 8 50% of 800 9 10% of 120 10 50% of 360 11 25% of 2000 12 75% of 100 13 10% of 3000 14 20% of 3000 15 75% of 400 Calculate these percentages.
Sale price
Discount $ $ $ $
$ $ $ $
25% 75% 10% 50% 100% 1 2 3 4 5
MP_NSW_AB6_38220_TXT_5PP.indb 4 04-Sep-23 17:40:55
Add the same amount to each number to make the subtraction easier.
Use strategies like rounding to estimate the difference between these numbers before completing the subtractions.
Use addition to check your answers to the subtractions. The first one has been started for you.
Solve the problems using any strategy you wish.
19 What is Willow’s mass if she is 2.345 kg less than Max, whose mass is 45.678 kg?
20 How long is the back path if it was 15.550 m before an extra 3.875 m were added?
21 How far did we travel if the car’s trip meter was showing 19.838 km at the end of the trip and 12.457 km when we started?
A 5 Oxford University Press ISBN 9780190338220 Addition and subtraction Selects and applies appropriate strategies to solve addition and subtraction problems MA3-AR-01
1 313 + 498 ≈ ____ 2 578 + 220 ≈ ____ 3 469 + 424 ≈ ____ 4 1289 + 332 ≈ ____ 5 3465 + 237 ≈ ____ 6 6295 + 697 ≈ ____
Estimate an answer by rounding each number to the nearest hundred.
7 4 1 6 1 – 2 9 9 7 8 6 3 3 7 – 3 9 8 9 9 3 0 0 5 – 1 9 9 8 becomes becomes becomes becomes becomes becomes 10 5 9 7 8 mL 11 7 5 8 2 kg 12 $8 8 . 6 2 13 1 9 9 . 5 6 3 8 2 8 mL 4 5 7 8 kg $5 8 . 9 5 1 0 0 . 7 9 Estimate: Estimate: Estimate: Estimate:
14 8 6 5 8 15 9 7 6 7 16 7 8 8 5 17 8 9 6 9 18 9 7 6 4 3 3 2 7 4 4 8 4 5 8 2 8 6 1 9 4 5 9 3 8 5 3 3 1 5 3 3 1 + 3 3 2 7 + 4 4 8 4 + 5 8 2 8 + 6 1 9 4 + 5 9 3 8
Example: 4595 becomes 4598 – 2997 becomes – 3000 1598 MP_NSW_AB6_38220_TXT_5PP.indb 5 04-Sep-23 17:40:55 DRAFT
Multiplication and division
Use mental strategies to calculate these products.
Use your knowledge of place value to multiply and divide decimals by 10 and 100.
To multiply by thousands: multiply the number in the thousands column and then place a zero in the hundreds, tens and ones columns The decimal point moves right when multiplying and left when dividing.
these multiplications.
Complete these divisions, recording any remainders as a fraction.
The remainder can be written as a fraction by putting the remainder over the divisor.

56 The cost of 5 tickets was $15. How much would 25 tickets cost? __________________
A 6 Oxford University Press ISBN 9780190338220 Selects and applies appropriate strategies to solve multiplication and division problems MA3-MR-01
1 25 × 4 = 7 200 × 4 = 13 5000 × 6 = 2 15 × 8 = 8 300 × 5 = 14 9000 × 5 = 3 32 × 4 = 9 600 × 8 = 15 8000 × 3 = 4 32 × 8 = 10 300 × 40 = 16 3000 × 20 = 5 16 × 5 = 11 400 × 50 = 17 6000 × 30 = 6 38 × 5 = 12 600 × 20 = 18 4000 × 50 = Round to
19 38 × 4 ≈ 21 195 × 4 ≈ 23 998 × 6 ≈ 25 4970 × 8 ≈ 20 98 × 6 ≈ 22 301 × 3 ≈ 24 905 × 4 ≈ 26 5017 × 6 ≈
mental
27 48 ÷ 4 = 30 72 ÷ 8 = 33 760 ÷ 10 = 36 120 ÷ 5 = 28 36 ÷ 4 = 31 96 ÷ 8 = 34 950 ÷ 10 = 37 360 ÷ 5 = 29 84 ÷ 4 = 32 168 ÷ 8 = 35 840 ÷ 10 = 38 450 ÷ 5 =
the nearest 10, 100 or 1000 to estimate the products.
Use
strategies to complete these divisions.
×10 ×100 ÷10 ÷100 39 3.5 43 72.3 40 6.8 44 85.6 41 7.75 45 3.57 42 8.93 46 6.97
Complete
47 8 6 7 5 × 6 48 3 4 7 4 × 8 49 5 6 2 8 × 5 50 8 5 9 6 × 9 51 6 3 4 2 × 3
52 3 ǀ 9 7 5 53 4 ǀ 1 8 0 8 54 5 ǀ 1 8 5 8 55 6 ǀ 2 6 2 3
$15 5 25
MP_NSW_AB6_38220_TXT_5PP.indb 6 04-Sep-23 17:40:55
DRAFT
Rules for order of operations
• Always do the work in the brackets first.
• Do multiplication and division before addition and subtraction.
• Do operations with division and multiplication from left to right.
• Do operations with addition and subtraction from left to right.
Follow the order of operations rules to complete these number sentences.
1 30 – 27 + 6 =
2 90 – 27 + 16 − 4 =
3 8 × 5 + 16 =
4 8 × (5 + 16) =
5 6 × (7 + 14) =
6
1 2 × 40 + 12 =
Tam and Eva solved the same problem but got different answers.
Tam said: 240 + 60 ÷ 5 = 60
Eva said: 240 + 60 ÷ 5 = 252
7 4 × (12 − 8) + 3 =
8 5 × 7 + 14 – 9 =
9 3 × 6 − 16 ÷ 4 =
10 81 – (9 + 6) × 4 =
= 42
= 32
12 5 × 8 − 4 + 49 =
13 Who do you agree with?
14 Explain why.
Draw a line to match the problem to a number sentence that could solve it, then solve the problem.
15 5 tins of paint @ $12 per tin and a $20 paintbrush
16 10 movie tickets @ $9 each, less a $10 discount
17 What is the weekly rent if Biko pays $90 and the other four housemates pay $120 each?
$50 − $20 – $12 =
4 × $120 + $90 =
10 × $9 − $10 =
18 How much change will I get from $200 if I buy a shirt for $30 and 4 pairs of shorts @ $20 each? 5 × $12 + $20 =
19 A $20 paintbrush and a $12 tin of paint paid for with a $50 note. What is my change?
20 10 movie tickets @ $9 each and 10 cartons of popcorn @ $7 each
10 × $9 + 10 × $7 =
$200 – 4 × $20 − $30 =
A 7 Oxford University Press ISBN 9780190338220 Order of operations
the order of operations to calculations MA3-MR-02
Constructs and completes number sentences involving multiplicative relations, applying
11 1 5 × (40 + 5) − 4 =
(2
5)
6
+
×
2
5
6
+
×
4 × 9 ÷ 3
= 12
9 + 6 – 8
MP_NSW_AB6_38220_TXT_5PP.indb 7 04-Sep-23 17:40:55
= 7
DRAFT
Fractions
Compares and orders fractions with denominators of 2, 3, 4, 5, 6, 8 and 10
Use the fraction walls below to answer true (T) or false (F).
10 Complete the additions to show what fractions have been added to make one whole.
Add these fractions with related denominators.
Complete these subtractions for fractions with related denominators.
A 8 Oxford University Press ISBN 9780190338220
MA3-RQF-01
Halves Quarters Eighths Thirds Sixths Twelfths Fifths Tenths 1 1 2 < 1 4 2 1 3 > 1 6 3 1 4 = 3 8 4 1 6 < 1 2 5 2 5 > 3 10 6 2 5 = 4 10 7 3 8 > 1 4 8 2 3 > 5 6 9 7 8 < 3 4
11 3 10 + 4 10 = 12 1 8 + 6 8 = 13 7 12 + 3 12 = 14 1 4 + 1 2 = 15 1 5 + 3 10 = 16 3 4 + 1 8 = 17 5 12 + 1 3 = 18 4 10 + 2 5 =
19 11 12 5 12 = 20 9 10 4 10 = 21 9 10 3 10 = 22 1 3 1 6 = 23 7 8 1 2 = 24 9 10 2 5 = 25 1 2 3 8 = 26 11 12 4 6 =
1 6 1 6 1 6 1 6 1 6 1 6 1 2 1 3 1 6 1 whole 1 1 + = 1 1 1 1 + + = 1 1 1 1 + + = 1 1 1 1 1 + + + = 1 MP_NSW_AB6_38220_TXT_5PP.indb 8 04-Sep-23 17:40:55 DRAFT
Use the tape diagrams to find these fractions.
1 3 5 of 30 = 2 3 4 of 60 = 3 7 10 of 50 = 4 1 2 of 21 = 2 ǀ 2 1 5 1 4 of 21 = 4 ǀ 2 1 6 1 5 of 21 = 5 ǀ 2 1 7 1 10 of 21 = 10 ǀ 2 1
Find these fractions of a collection. Use the equivalence chart to convert the remainder into a decimal. Use a calculator to check your answers.
Fractions of measures and quantities
Solve these problems and record any remainder as a fraction of the divisor.
8
How much water was used if Matilda used 1 5 of the 42 litres in the tank?
9 How far has Ollie run if he has completed 1 2 of the 9 kilometre course?
10 How much soil did Jake use if he used 1 4 of the 30 kilogram bag?
11 How many hours did Zali sleep for if she slept for 1 10 of the 25-hour flight to Europe?
A 9 Oxford University Press ISBN 9780190338220
Determines 1 2 , 1 4 , 1 5 and 1 10 of measures and quantities MA3-RQF-02 30 0 6 6 6 6 6 1 5 1 2 5 3 5 4 5 60 0 1 4 1 2 4 3 4 50 0 1 1 10 2 10 3 10 4 10 5 10 6 10 7 10 8 10 9 10 15 5 5 5 5 5 5 5 5 5 5 15 15 15
Fraction and decimal equivalence chart Fraction 1 2 1 4 1 5 1 10 Decimal 0.5 0.25 0.2 0.1 MP_NSW_AB6_38220_TXT_5PP.indb 9 04-Sep-23 17:40:56 DRAFT
Cartesian plane
1 Plot these coordinates on the Cartesian plane.
a (4,0) b (7,3) c (4,3)
d (1,6) e (−2,3) f (−5,3)
g (−2,0) h (−5,−3) i (−2,−3)
j (1,−6) k (4,−3) l (7,−3)
2 Connect the points in alphabetical order to create a shape.
Reflected shape
The coordinates used to plot this pentagon are: ( 6,5) ( 6, 5) ( 3, 5) (0,0) ( 3,5)
Plot these coordinates to create a reflected image of the pentagon.
Translated shape
The coordinates used to plot this hexagon are:
( 6,6) ( 6,1) ( 1,1) ( 1,3) ( 3,3) ( 3,6)
Translate the hexagon to a different quadrant by plotting these points.
Create a reflection of this octagon and record the 8 pairs of coordinates it has in its new position.
A 10 Oxford University Press ISBN 9780190338220 Locates
and describes points on a coordinate plane MA3-GM-01
–1 –1 1 6 5 4 3 2 7 y x –2 –3 –4 –5 –6 –7 6 5 4 3 2 1 7 –2 –3 –4 –5 –6 –7
(6,5) (6, 5) (3, 5) (0,0) (3,5) 1 –1 0 –2 –3 –4 –5 –6 2 3 4 5 6 x –6 –5 –4 –3 –2 –1 1 2 3 4 5 6 y 3 5
(1, 1) (1, 6) (6, 6) (6, 4) (4, 4) (4, 1) 1 –1 0 –2 –3 –4 –5 –6 2 3 4 5 6 x –6 –5 –4 –3 –2 –1 1 2 3 4 5 6 y 4 1 –1 0 –2 –3 –4 –5 –6 2 3 4 5 6 x –6 –5 –4 –3 –2 –1 1 2 3 4 5 6 y
( , ) ( , ) ( , ) ( , ) ( , ) ( , ) ( , ) ( , ) MP_NSW_AB6_38220_TXT_5PP.indb 10 04-Sep-23 17:40:56 DRAFT
Selects and uses the appropriate unit and device to measure lengths and distances including perimeters MA3-GM-02
Measure and calculate the perimeter of each shape in millimetres.
Calculate the perimeter of these shapes in metres.
Convert these length measurements into other units.
7 1.25 m = cm
8
13 Convert the length, width and height dimensions from millimetres into metres.
14 Sketch three rectangles with different dimensions that have a perimeter of 18 cm.
A 11 Oxford University Press ISBN 9780190338220
Length
P = mm P = mm P = mm P = mm 1 2 3 4 7.5 m 3.75 m 5m 7.5 m 3.75 m P = m 10 m 5 m 5 m 8.75 m 3.75 m P = m 5 6
3
10 2000 mm = m 11 3 m = mm 12 4.256 m
Vehicle Length Width Height mm m mm m mm m Toyota Camry 4855 1835 1475 Mazda 6 4865 1840 1455
m = cm 9 150 cm = m
= mm .
MP_NSW_AB6_38220_TXT_5PP.indb 11 04-Sep-23 17:40:56
DRAFT
Measure each angle. Supply the two missing measurements to complete the diagram without a protractor.
What did you notice about the opposite angles?
7 If Angle A is 70˚, what size is Angle D?
8 If Angle C is 40˚, what size is Angle F?
9 If Angle A + Angle C = 110˚, what size is Angle B?
10 What is the total angle of Angle D + E + F? Answer true or false.
11 Angles on a straight line add to 180˚.
12 One full revolution, starting at Angle A and returning to Angle A is equal to 360˚.
13 Trace over two arms in order to create a right angle.
14 Draw a set of adjacent angles that add to 180˚.
Use another colour to trace over any other right angles.
How many right angles can you see? _________
A 12 Oxford University Press ISBN 9780190338220 Angles Measures
a
and
a point
and constructs angles, and identifies the relationships between angles on
straight line
angles at
MA3-GM-03
40º 140º
1 ° 4 ° 3 ° 2 ° 5 ° 6 ° F A B C D E
MP_NSW_AB6_38220_TXT_5PP.indb 12 04-Sep-23 17:40:56
DRAFT
Triangles and quadrilaterals
Decide whether these statements are true or false.
1 Equilateral triangles have three sides the same length.
2 Isosceles triangles have only two sides the same length.
3 Scalene triangles don’t have any sides the same length.
4 Scalene triangles don’t have any angles the same size.
5 Equilateral triangles have three angles the same size.
6 Scalene triangles have two angles the same size.
7 Isosceles triangles have two angles the same size.
8 Colour the triangles these colours: Equilateral triangle: red Isosceles: green Scalene: blue Draw a line to match each right-angled triangle to its name.
9
10
An
11 12 13 14
Square
• 4 equal sides
• 4 right angles
• 2 sets of parallel sides
Parallelogram
• 2 pairs of equal sides
• 2 pairs of equal angles
• 2 sets of parallel sides
Rhombus
• 4 equal sides
• 2 pairs of equal angles
• Opposite angles are equal
Rectangle
• 2 pairs of equal sides
• 4 right angles
• 2 sets of parallel sides
A 13 Oxford University Press ISBN 9780190338220
Investigates and classifies two-dimensional shapes, including triangles and quadrilaterals based on their properties
MA3-2DS-01
Scalene triangle
Isosceles triangle Match each quadrilateral to its description.
MP_NSW_AB6_38220_TXT_5PP.indb 13 04-Sep-23 17:40:57
isosceles right-angled triangle has two sides the same length, two angles the same size and one right angle.
DRAFT
Calculate the area of these L-shape figures.
Draw a dotted line on each shape to break the L-shape into two rectangles.
Label one rectangle A and the other rectangle B.
Find the area of each rectangle and then calculate the area of the whole shape.
Rectangle A = _____ x _____ = _____cm2
Rectangle B = _____ x _____ = _____cm2
Rectangle A = _____ x _____ = _____cm2
Rectangle B = _____ x _____ = _____cm2
Total area = _____cm2
7 Calculate the area of Shape Y drawn on the 5mm grid and then check whether the area has changed after it has been translated to a new position named Shape Z.
Area Y = ____ cm2
Area Z = ____cm2
A 14 Oxford University Press ISBN 9780190338220 Selects and uses the appropriate unit to calculate areas, including areas of rectangles MA3-2DS-02 Use the area formula Area = length × width to calculate the area of these rectangles. 1 1 1 4
5 5 cm 8 cm 3 cm 2 cm 1 cm 6 2 cm 4 cm 3 cm 5 cm 2 cm 2 cm
3 cm 3 cm A = cm2 4 cm 4 cm A = cm2 5 cm 3 cm A = cm2 2 cm 4 cm A = cm2
Total area = _____cm2
2 3
Area 1 –1 0 –2 –3 –4 –5 –6 –7 2 3 4 5 6 7 x –6 –7 –5 –4 –3 –2 –1 1 2 3 4 5 6 7 y Z Y MP_NSW_AB6_38220_TXT_5PP.indb 14 04-Sep-23 17:40:57
DRAFT
Parallelograms can be rearranged to form rectangles in order to calculate their area. The formula for the area of a parallelogram is: Area = base × height.
Calculate the area of these parallelograms.
2 3 1 4
• The area of a triangle can be worked out by converting the triangle into a rectangle.
• This means that the total area of the shape has been doubled.
• Find the area of the rectangle, then halve it to find the area of the triangle.
5 Convert each triangle into a rectangle and then record the area of the rectangle and the triangle.
A 15 Oxford University Press ISBN 9780190338220
Area of parallelograms and triangles
Combines, splits and rearranges shapes to determine the area of parallelograms and triangles MA3-2DS-03
A = ______ cm2 A = ______ cm2 A = ______ cm2 A = ______ cm2 A = ______ cm2
A = 4 cm × 2 cm = 8 cm2
a c d e b 2 cm 4 cm Area of Area of a b c d e MP_NSW_AB6_38220_TXT_5PP.indb 15 04-Sep-23 17:40:57 DRAFT
Use the models and nets to name the prisms and pyramids. Record the number of faces, vertices and edges on each shape.
1
Name: _____________________________
Faces Vertices Edges
3
Name: ________________________
Faces Vertices Edges
2
Name: ________________________
Faces Vertices Edges
4
DRAFT
Name: _______________________________
Faces Vertices Edges
Top view
Front view Side view
5 On the grid, draw the top, front and side views of the prism below.
6 On the dot paper, make an isometric sketch of the prism. The top has been started.
Top
A 16 Oxford University Press ISBN 9780190338220
Prisms and pyramids
Front Side
Visualises, sketches and constructs three-dimensional objects, including prisms and pyramids, making connections to two-dimensional representations MA3-3DS-01
MP_NSW_AB6_38220_TXT_5PP.indb 16 04-Sep-23 17:40:57
Calculate the volume of each prism. Record the data in the table.
Record the level the water would rise to if the models made from cubic centimetre shapes were put in the jugs.
To calculate the volume of a prism, first find the area of the bottom layer and then multiply that by the number of layers.
A cubic metre is 1 metre long, 1 metre wide and 1 metre high.

Cubic metres are used to measure larger volumes. Example: 8 storage boxes = 1 m3
8 How many storage boxes would fit in a 5m3 skip bin if 8 boxes = 1m3?
A 17 Oxford University Press ISBN 9780190338220
10 20 30 40 50 60 70 80 90 10 20 30 40 50 60 70 80 90 10 20 30 40 50 60 70 80 90 10 20 30 40 50 60 70 80 90 Volume and capacity Selects and uses the appropriate unit to estimate, measure and calculate volumes and capacities MA3-3DS-02 4 5 6 3 cm 2 cm A 4 cm 3 cm 2 cm B 5 cm 4 cm 3 cm 10 cm C
Shape Area of bottom layer (length × width) Layers (height) Volume 1 A cm3 2 B cm3 3 C cm3
7 5 m3 1 m3 8
0
boxes
1 m 1 m 1 m 1 m 1 m 1 m 1 m 1 m 1 m 1 m 1 m 1 m Cubic metre MP_NSW_AB6_38220_TXT_5PP.indb 17 04-Sep-23 17:40:58 DRAFT
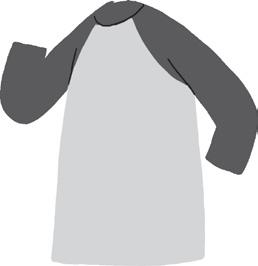
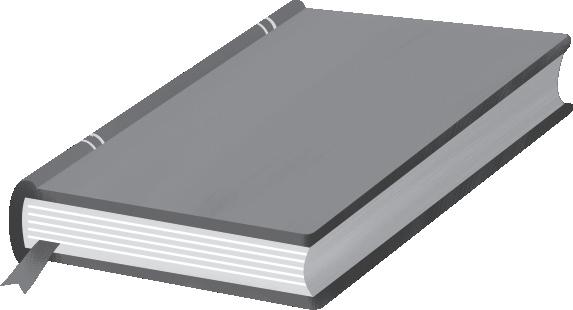
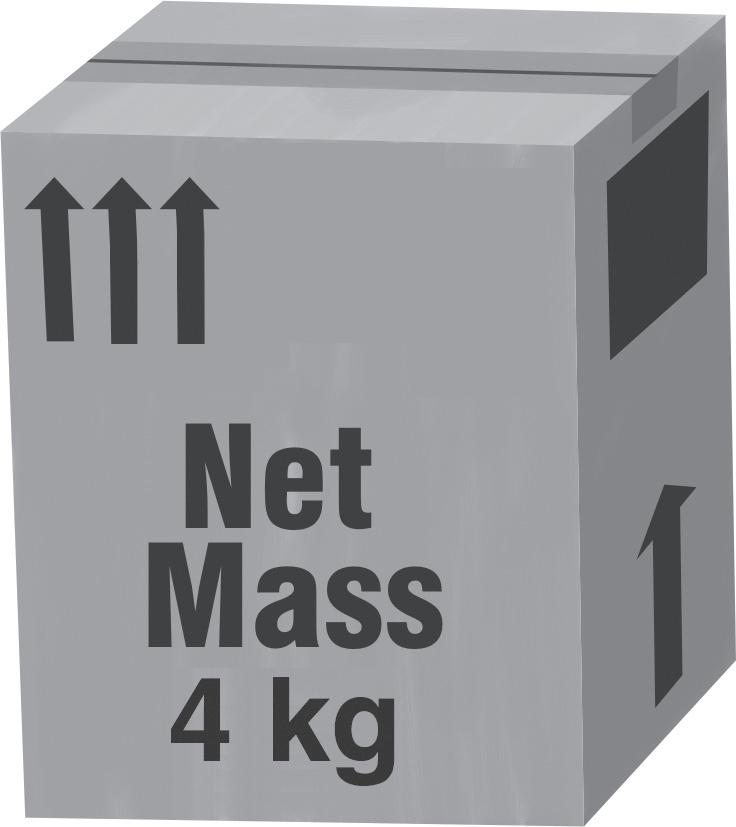
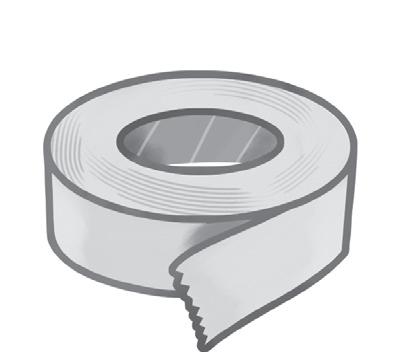
A cardboard box can hold a mass of 4 kg. How many of each item could be packed into a box of this type?
Gina was packing a bag for an overseas flight. The bag had to have a mass of no more than 25 kg when packed. The bag itself had a mass of 3.5 kg.
• The clothes she put into her bag had a mass of 12.765 kg.
• Her shoes had a mass of 1.452 kg and her hairdryer weighed 0.65 kg.
• The last things she put in her bag were three books that had a combined mass of 4.026 kg.
19 What was the total mass of the packed bag?
20 How much under the 25 kg limit was Gina?
A 18 Oxford University Press ISBN 9780190338220 Mass Selects and uses the appropriate unit and device to measure the masses of objects MA3-NSM-01 Convert each mass from grams to kilograms using decimal notation. 1 2 3 4 4356 g 2150 g 7120 g 38 375 g kg kg kg kg
250 g 800 g 200 g 50 g 5 6 7 8 Convert the mass units.
3000 g = kg
6000 g = kg
= kg
2000 kg =
8.5 t = kg 14 3.251 kg = g 15 2.75 kg = g 16 7.5 t = kg 17 1.125 t = kg 18 2.003 kg = g
9
10
11 1500 g
12
t 13
MP_NSW_AB6_38220_TXT_5PP.indb 18 04-Sep-23 17:40:59 DRAFT
Draw the analog times on the clock faces and then write each in 24-hour time.
Study the train timetable. How long does each trip take?
5 Redfern to Wynyard
6 Town Hall to Artamon
7 Central to North Sydney
When would you arrive if you caught the:
8 12:09 from Parramatta to Redfern?
Time can be partitioned so that it is easier to add or subtract minutes to the time of the day.
9 Regroup the units of time to add on or subtract the minutes.
4:50 + 45 minutes
2:55 + 20 minutes
3:45 + 55 minutes
8:10 – 25 minutes
9:15 – 45 minutes
10:10 – 30 minutes
10 If Sam left home at 11:40 am and arrived at his destination at 1:15 pm, how long was his journey?
Time can be expressed using decimals. For example: 2 hours and 30 minutes = 2.5 hours.
11 Express each time period using decimals.
a 1 hour 30 minutes
b 2 hours 15 minutes
c 1 hour 45 minutes
d 3 hours 15 minutes
A 19 Oxford University Press ISBN 9780190338220 Time Measures and compares duration, using 12- and 24-hour time and am and pm notation MA3-NSM-02
1 7:06 pm 2 2:15 am 3 9:52 pm 4 12:33 pm
Train timetable am pm pm pm pm pm PARRAMATTA 11:54 12:09 12:13 12:24 Granville 11:56 12:11 12:15 12:26 STRATHFIELD 12:07 12:15 12:23 12:30 12:37 12:45 BURWOOD 12:16 12:31 12:46 REDFERN 12:17 12:26 12:33 12:41 12:47 12:56 CENTRAL 12:20 12:29 12:36 12:44 12:50 12:59 TOWN HALL 12:23 12:32 12:39 12:47 12:53 1:02 WYNYARD 12:25 12:34 12:41 12:49 12:55 1:04 Milsons Point 12:29 12:38 12:45 12:53 12:59 1:08 NORTH SYDNEY 12:30 12:39 12:46 12:54 1:00 1:09 Artarmon 12:40 12:49 12:56 1:04 1:10 1:19
4:45 am + 45 minutes 15 30 4:45 + 15 = 5:00 + 30 = 5:30
MP_NSW_AB6_38220_TXT_5PP.indb 19 04-Sep-23 17:40:59
DRAFT
1 Which two sports have the greatest number of participants?
2 Which sport has the third highest number of participants?
3 How many more people play basketball than netball?
4 How many more people play netball than cricket?
5 How many more people do athletics compared to swimming?
6 Can you give a reason why swimming has the least number of participants?
A newspaper ran the following report and the illustration at right.
House prices go through the roof
A real estate report said that prices of houses in the city centre have risen sharply this year, meaning many people won’t be able to afford to buy in the area.
7 What is the actual increase in price between this year and last year?
8 Why does it look like the price has risen significantly?
9 How do the headline and image try to influence the reader?
A 20 Oxford University Press ISBN 9780190338220 Constructs graphs using many-to-one scales MA3-DATA-01 Graphs
0 4 8 12 16
People
Sports played in a small country town
$505 000 $502 000 $500 000 Last year This year MP_NSW_AB6_38220_TXT_5PP.indb 20 04-Sep-23 17:40:59
Athletics Basketball Cricket Netball Rugby league Soccer Swimming Australian Rules
DRAFT
1 How far did they travel between 8 am and 10 am?
2 What was their average speed over the first two hours?
3 How far did they travel between 10 am and noon?
4 Beginning at noon, how long was their lunch break?
5 Approximately how far had they travelled by 2:30 pm?
6 How much further did they still have to travel at 3 o’clock?
7 How long did the trip take?
8 What is the distance from Sydney to Dubbo?
9 Examine the data presented in the graph to decide whether these statements are true or false. True
1 55% of males aged 15–24 participated in sporting activities.
2 35% of females aged 15–24 participated in sporting activities.
3 45% of males aged 25–34 participated in sporting activities.
4 25% of females aged 25–34 participated in sporting activities.
5 The percentage rate of males aged 35–44 was equal to females aged 15–24.
6 Females aged ≥ 45 had the lowest participation rate.
A 21 Oxford University Press ISBN 9780190338220 Interprets data displays, including timelines and line graphs MA3-DATA-02 Data displays Sydney to Dubbo Time 0 50 100 150 200 250 300 350 400 450 Kilometres travelled 8am 9am10am11amnoon1pm2pm3pm4pm
false
or
10 20 30 40 50 60 15–24 25–34 35–44 ≥45 Years Participation rate %
Sydney Primary School went on an excursion to the Western Plains Zoo in Dubbo.
Male Female MP_NSW_AB6_38220_TXT_5PP.indb 21 04-Sep-23 17:40:59
First Nations people participating in sport and physical activities
DRAFT
Probability
Write a fraction to describe the chance of the spinner landing on:
1 yellow
3 red
5 blue
2 pink
4 green
6 Which combination of two colours would have a chance of 1 2 ?
Colour the spinner to match the probability data in the table.
7 8 9 10 11
Colour pink green white blue red
Probability 1 10 20% 1 5 0.4 10%
Draw a line from each colour to a point on the probability scale that matches the probability of that colour marble being the first one chosen from the container.
Draw a line from each spinner to a point on the probability scale that matches the probability of the spinner landing on the white section. 16
A 22 Oxford University Press ISBN 9780190338220 Conducts chance experiments and quantifies the probability MA3-CHAN-01
12 Gold
13 Silver
14 Red
15 Lime
17 18
20 0 10% 20% 30% 40% 50% 60% 70% 80% 90% 100%
19
red red red pink blue blue blue blue white green yellow yellow G S G R G G G R G R G L G R R S G L R G Marbles 20 0 0.9 0.8 0.7 0.6 0.5 0.4 0.3 0.2 0.1 1 MP_NSW_AB6_38220_TXT_5PP.indb 22 04-Sep-23 17:41:00
DRAFT
DRAFT
A 23 Oxford University Press ISBN 9780190338220 Notes MP_NSW_AB6_38220_TXT_5PP.indb 23 04-Sep-23 17:41:00
ASSESSMENT BOOK
PRACTISE, MASTER, ASSESS
Maths Plus NESA Syllabus / Australian Curriculum Edition, Year K to 6 is a whole-school program based on the NSW Education Standards Authority Mathematics K–6 Syllabus for the Australian Curriculum.
Maths Plus follows a graded and spiralling approach, allowing teachers to revisit concepts throughout the year. It provides students with opportunities to sequentially develop, practise and master their skills and knowledge in the content strands of the for the Australian Curriculum: Mathematics:
• Number
• Measurement
• Statistics
• Algebra
• Space
• Probability
The Assessment Books feature post-tests to assess the concepts and skills developed in the Student Books and Mentals and Homework Books. Answers can be found online on the Maths Plus Teacher Dashboard.
www.oxfordowl.com.au
Oxford Owl is the home for Oxford Primary professional resources.
6 STAGE 3 Printer FSC logo visit us at oup.com.au or contact customer support
oup.com.au/help
780190 338220
at
9
MP_NSW_AB6_38220_TXT_5PP.indb 24 04-Sep-23 17:41:00 DRAFT
ISBN 978-0-19-033822-0