News
PAGES International Project Office Sulgeneckstrasse 38 3007 Bern Switzerland Tel: +41 31 312 31 33 Fax: +41 31 312 31 68 pages@pages.unibe.ch Text Editing: Leah Christen Layout: Christoph Kull
Julie Brigham-Grette, Christoph Kull and Thorsten Kiefer, Editors
Circulation: 3700
VOL.14, N°2 – AUGUST 2006
www.pages-igbp.org
U.S. Earth System History Science
ISSN 1563–0803
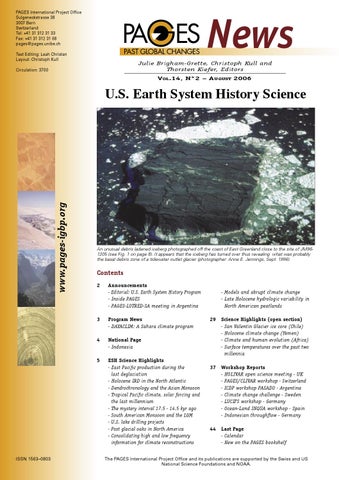
An unusual debris ladened iceberg photographed off the coast of East Greenland close to the site of JM961205 (see Fig. 1 on page 8). It appears that the iceberg has turned over thus revealing what was probably the basal debris zone of a tidewater outlet glacier (photographer: Anne E. Jennings, Sept. 1996).
Contents 2
Announcements - Editorial: U.S. Earth System History Program - Inside PAGES - PAGES-LOTRED-SA meeting in Argentina
3
Program News - DAYACLIM: A Sahara climate program
4
National Page - Indonesia
5
ESH Science Highlights - East Pacific production during the last deglaciation - Holocene IRD in the North Atlantic - Dendrochronology and the Asian Monsoon - Tropical Pacific climate, solar forcing and the last millennium - The mystery interval 17.5 - 14.5 kyr ago - South American Monsoon and the LGM - U.S. lake drilling projects - Post glacial oaks in North America - Consolidating high and low frequency information for climate reconstructions
- Models and abrupt climate change - Late Holocene hydrologic variability in North American peatlands 29 Science Highlights (open section) - San Valentin Glacier ice core (Chile) - Holocene climate change (Yemen) - Climate and human evolution (Africa) - Surface temperatures over the past two millennia 37 Workshop Reports - HOLIVAR open science meeting - UK - PAGES/CLIVAR workshop - Switzerland - ICDP workshop PASADO - Argentina - Climate change challenge - Sweden - LUCIFS workshop - Germany - Ocean-Land INQUA workshop - Spain - Indonesian throughflow - Germany 44 Last Page - Calendar - New on the PAGES bookshelf
The PAGES International Project Office and its publications are supported by the Swiss and US National Science Foundations and NOAA.
2
Announcements Editorial: U.S. Earth System History Program in Transition A significant portion of paleoclimate science conducted by the United States over the past 14 years has been carried out through proposals to the Earth System History (ESH) Program of the U.S. National Science Foundation (NSF). This cross-disciplinary program has been jointly supported under the Directorate for Geosciences with contributions from its divisions, including Earth Sciences, Ocean Sciences and Atmospheric Sciences. Initially developed under the U.S. Global Change Research Program involving a number of federal agencies, NSF acutely acknowledged the need for a program to promote pioneering research on the temporal and spatial scales of natural climate variability, climate proxies, and modeling in order to better understand the forcing mechanisms, systemic sensitivities, and feedbacks responsible for past climate change on regional and global scales. Partnerships for shared support of selected proposals were also fostered in the earlier years with the NSF Office of Polar Programs and the National Oceanic and Atmospheric Administration’s (NOAA) former Paleoclimate element in the Office of Global programs (now known as the Climate Change Data and Detection element in the Climate Program Office). Since its inception, the ESH program has been guided by an adhoc advisory group composed of scientists on rotation from a range of disciplines who periodically sought community input to guide program managers in developing targeted areas of emphasis for annual solicitations as the science evolved. The program has supported a vast range of projects world-wide, primarily but not exclusively, aimed at high-resolution climate records using a variety of sedimentary, geochemical, and biogeochemical paleo-proxies from diverse environments to develop both qualitative and quantitative estimates of past change. The program has particularly encouraged over time the integration of empirical and observational data with a variety of model simulations of regional and global climate change. Recent initiatives of emphasis within the ESH program have focused on topics including Holocene change, abrupt change on a variety of timescales, and regional vs. global scale change. Because the solicitation for the ESH program expires September 30, 2006, NSF and the science community are now poised to determine how this successful program might evolve in the coming years to address ongoing and future scientific needs (see www.nsf.gov/pubs/2006/nsf06029/nsf06029.jsp). Plans are now being formulated for an official review, during which time the Directorate for Geosciences will continue to seek community input during the decision making process. An initial workshop held in November 2005 focused on a few relevant cross-cutting science questions and the workshop recommendations are available at www. mesh.usc.edu/workshop.htm for community comment. The short articles presented in this issue were volunteered at large from ESH-funded researchers and represent only a small cross-section of the range of science address by the ESH initiative. To learn more about past ESH initiatives, go to the ESH website at www.nsf.gov/funding/pgm_summ.jsp?pims_id=5750&org=ATM. JULIE BRIGHAM-GRETTE
PAGES SSC Chair juliebg@geo.umass.edu
Tales from the field Do you have an interesting and humorous story from your paleoenvironmental fieldwork? Send us your tale (max. 500 words) so that we can publish it in PAGES News!
��������������������������������������������������� ������������������ ������ ����� ��� ����� ���������� ���������������� ��� ���� ���������� ��� ���� �������� ������������ ��� ����� ����� ���� ��� ������ ����� ����� �� ���� ������ ��� ����������� ����� ���� ����� ��� ���� �������� ������ ���� ���� ��������� �� ����� ��� ������ ����������� �������� ����� ��� ���� ������ ����� ��� ����� ��� ���� ���� �������� ��������� ����������������������������������������������������������������
PAGES NEWS, VOL.14, N°2, AUGUST 2006
Announcements Inside PAGES This spring, the PAGES office was busy keeping different PAGES projects on track: Several guest scientists spent a few days to a few weeks at the PAGES office. Bert Rein compiled an extensive National PAGES Germany website and Sri Yudawati Cahyarini set up the Indonesian PAGES (page 5, this issue). All 18 of the currently available national PAGES websites are online at: www.pages-igbp.org/ about/national/. A few more National PAGES are in the pipeline and will be ready in autumn this year. In May, the IPO, with the help of Isabelle Larocque, organized the second Databoard meeting, at the PAGES office in Bern. This project, which aims to develop a better data network in the near future, will be of special benefit to the paleocommunity. Further information is available at www.pages-igbp.org/ services/data/.
In early June, the PAGES-CLIVAR workshop on Past Millennia Variability, organized by the PAGES office, was held in Wengen, Switzerland. This very successful event will also have some follow-up activities. Read more in the workshop report on page 38. Finally, the PAGES office has been engaged in organizing several upcoming fall activities. The IGBPSCOR Fast Track Initiative on Ocean Acidification will hold its first workshop at the end of September in the USA (http://igbp-scor.pages.unibe. ch/firstworkshop.html). Regional Variability workshops will be held for the Mediterranean area, together with the MEDCLIVAR program, in Spain in November, and for South America, alongside the annual PAGES SSC meeting, in Argentina in October. Information is available on our calendar webpage (www. pages-igbp.org/calendar/).
SSC nominations
3 tions will close 15 September 2006. We particularly encourage nominations of paleoscientists from eastern Asia, and from Russia and former Soviet Union countries, since these geographic regions will be underrepresented when current members leave at the end of this year. For details, please go to: www.pages-igbp. org/people/sscleaders/nominations. html.
Next issue of PAGES News: The next issue of the PAGES newsletter will be published in December. It will contain an open section on general paleoscience themes and a special section on radiocarbon chronometry. Please send your contributions of science highlights, program news, workshop reports and humorous tales from the field to Christoph Kull (kull@pages.unibe.ch) by 31 October 2006. Guidelines can be found at www.pages-igbp.org/products/ newsletters/instructions.html.
At the upcoming SSC meeting, two new SSC members will be elected. The related Open Call for Nomina-
Regional Climate Variations in South America over the late Holocene October 4-7, 2006; Malargüe, Mendoza, Argentina
The aim of this meeting is to deepen the academic interactions among paleoclimatologists of South America, without neglecting the presence of notable investigators from outside the region. During the four day meeting, the conference will be organized around 8 thematic sessions related to climatic, high-resolution paleoclimatic and numerical modeling studies in South America. The preliminary sessions are related to: - Documentary data and early instrumental data - Tree rings - Lake and marine sediments - Ice cores - Glaciers - Pollen and vegetation records - Multi-proxy reconstruction methods - Climate and modeling
Abstract Deadline: 8 September, 2006 Further Infromation: www.pages-igbp.org/science/initiatives/lotred-sa Claudia Bottero, IANIGLA – CRICYT, Mendoza, Argentina, cbottero@lab.cricyt.edu.ar
PAGES NEWS, VOL.14, N°2, AUGUST 2006
Program News
4
DAYACLIM: A northern Sahara desert climate change project BELHADJ HAMDI-AÏSSA1,2 AND NACER MESSEN2 Dép. Sci. Agronomiques, Laboratoire de Biogéochimie des Milieux Désertiques and ECO-SYS, Université de Ouargla, Algeria; hamdi_30@yahoo.fr 2 Centre de Recherche Scientifique et Technique sur les Région Arides, Biskra, Algeria; n_messen@hotmail.com 1
In order to address the consequences of global change in the Northern Sahara Desert (NSD) region, an initiative for collaborative research on global change in this region, the DAYACLIM project (N°17/03/01/02/ MN), was officially launched in February 2003. This initiative formulates and coordinates an integrated multidisciplinary approach to observing, reconstructing, and modeling global change phenomena and processes in the NSD region.
Objectives The DAYACLIM objectives are: - Understanding past climate changes and variability to improve the prediction of future global environments - Contributing to the understanding of the origin and causes of climate changes and variability, and collecting archived information useful for paleoclimatic reconstruction of the NSD region - Understanding the interaction between groundwater and hydrological changes. - Establishing a database for paleoenvironmental data from the NSD region - Providing a coordinated contribution of Algerian research to multidisciplinary international projects, and exploring the possibilities of future paleoenvironmental research.
Strategy DAYACLIM paleoclimatologists have two major concerns: (i) to select sites for investigation with high-resolution signals of climate changes and variability; (ii) to make sure that these investigated sites offer continuous signals of past climate oscillations. Flooded base-level plains and endorheic (closed) depressions where water is periodically stored at the surface could function as paleoclimate geo-archives of hydrological changes during interglacial phases in the NSD region (Rognon, 1980; Messen
Figure 1: Pedo-sediment layers in the investigated area.
et al., 2004). Sediments in depressions fall dry temporarily during arid phases and get covered with a sand layer and eolian sand deposits (Fig. 1). Thereafter, the fluvial and detritic sediments transported by water during pluvial phases are interstratified with sandy accumulations. Our approach relies on the theory of biorhexistasy, which describes a complex succession of sedimentation/pedological phases alternating with erosional episodes, both being controlled by climate forcing (Fedoroff and Courty, 1999). The concept of hierarchy of soil attributes (i.e. paleosol) in terms of a chronology of events and their paleoclimatic significance (Fedoroff and Courty, 1999, Hamdi-Aïssa, 2002) is adopted in the DAYACLIM project. For dating the pedo-sediment layers, we will have recourse to absolute and relative dating. According to the time interval and the nature of the selected material, useful chronostratigraphic methods are limited to: 1. Uranium series absolute dating 2. Electronic Spin Resonance (RSE) or Electronic Paramagnetic Resonance (RPE)
PAGES NEWS, VOL.14, N°2, AUGUST 2006
3. Optically Stimulated Luminescence induced by laser (OSL) A particular stratigraphic challenge for dating is to quantify hiatuses, i.e. to evaluate the duration corresponding to the absence of deposits, which usually occur at the transitions from arid to humid periods and inversely. The 1st interdisciplinary DAYACLIM Workshop “Dating of climate oscillations, hydrologic and thermic events in North Africa”, was sponsored by the EUR-OPA Risques-Majeurs and organized by CRSTRA and Ouargla University, Algeria, from 3-4 March 2004, followed by a fieldtrip to the DAYACLIM investigation field site. The DAYACLIM research group welcomes international scientific or financial collaboration. NOTES DAYACLIM is named for “Dayas” (Daïas), a North African and Middle Eastern word meaning desert non-saline endorheic depressions on limestone areas.
ACKNOWLEDGEMENTS DAYACLIM is formally endorsed by the Arid Regions Research Centre (CRSTRA) (Prof. A. Gaouar, N. Ferhat), Ouargla University (Prof. B. Hamdi-Aïssa, M. Hacini, B. Djili, F. Youcef), Tebessa University (Prof. A. Djerrab), USTHB University (Prof. F. YoucefEttoum, S. Benzinah) and Algerian Nuclear Research Centre (CNRB-CNRA) (Prof. N. Messen, D. Imatoukéne), INA Alger (H. Aouam).
REFERENCES
Fedoroff, N. and Courty, M.A., 1999: Soil and soil forming processes under increasing aridity. In: Singhvi, A.K., and Derbyshire, E. (Eds). Paleoenvironmental reconstruction in arid lands. Oxford & IBH, New Delhi, 73-108. Hamdi-Aïssa, B. 2002: Paleogeochemical interpretation of some gypsic microfabrics in hyper-desert soils. In: ISSS ed, 17th World Congress of Soil Science, Bangkok, (CD-Rom publication), paper n° 1861:1-9. Messen, N., Gaouar, A., Hamdi-Aïssa, B., Hacini, M. and Youcef-Ettoumi, F., 2004: Etude du climat paléolithique dans un bassin sédimentaire du sud algérien: sélection du site. Journal Algerien pour les Zones Arides, 3: 38-44. Rognon, P., 1980: Pluvial and arid phases in the Sahara: the role of non climatic factors. In: Sarnthein, M., Seibold, E. and Rognon, P., (Eds.), “Sahara and Surrounding Seas”, Palaeoecology of Africa, 12: 45-61.
National
5
Indonesia NATIONAL CONTACT: Dr. Wahyoe Soepri Hantoro Indonesian Institute of Sciences Bandung, 40135 hantoro@geotek.lipi.go.id
Welcome
Indonesia consists of a cluster of about 18,000 islands near the equator, located between the Pacific and Indian Oceans to the east and west, and the Asian and Australian land masses to the north and south. Accordingly, Indonesia’s seasonal climate is controlled by the migrating Intertropical Convergence Zone (ITCZ) and the interaction of the tropical Indopacific with the large land masses in both hemispheres, that is by the Asian and Australian Monsoons. On interannual timescales, Indonesia’s climate and environment is affected by large scale ocean-atmosphere processes in the adjacent tropical seas, namely the El Niño Southern Oscillation (ENSO) and the Indian Ocean Dipole (IOD). With roughly three quarters of Indonesia’s area being ocean, studying the interplay between components in the climate-environment system, such as land ocean linkages, Pacific-Indian Ocean exchange, ENSO-IOD coupling, is a major target. It is not surprising that two oceanic features are the main targets of international research. These features are the Western Pacific Warm Pool (WPWP) and the Indonesian Throughflow (ITF), both being key to the distribution of heat and salt/freshwater on a regional and global scale and hence of crucial importance for the global climate system.
National Science Highlight: Coral Proxy Records - The Indian Ocean Dipole Event Abram et al., 2003
Geochemical records from living and fossil corals from off western Sumatra document repeated events of anomalously strong upwelling in the eastern Indian Ocean during the last two centuries and the mid-Holocene. The upwelling events and resulting cooler surface waters were associated with the Indian Ocean Dipole (IOD) oscillation. During the last of these IOD anomalies in 1997, coral reefs in the area died, whereas they survived all the earlier anomalies recorded. Detailed analysis reveals that iron fertilization by wildfires in Indonesia in 1997 produced an unusual red tide that led to the death of the corals. While wildfires in Indonesia can result from drought in response to IOD (and ENSO) oscillations, they seem to become more severe with ongoing land-use changes, posing an increasing threat also to coastal ecosystems. Figure 1: Coral Sr/Ca (red), δ18O (blue) records, and grid sea surface temperature anomaly (black) from Mentawai, western Sumatra shows cooling during IOD events (figure modified from Abram et al., 2003). Reference: Abram, N.J., M.K. Gagan, M.T. McCulloch, J. Chappell and W.S. Hantoro (2003), Coral reef death during the 1997 Indian Ocean Dipole linked to Indonesian wildfires, Science, 301, 952-955.
Research Institutions: - Earth Dynamics and Geological Disasters Group, Research Center for Geotechnology, Indonesian Institute of Sciences (LIPI), Bandung www.geotek.lipi.go.id/
Funding Agencies: - State Ministry of Research and Technology www.ristek.go.id/english/incentive.html - Indonesian Institute of Sciences (LIPI) www.lipi.go.id/ - Directorate General of Higher Education www.dikti.org
- Marine Geological Institute, Bandung www.mgi.esdm.go.id/ - Geology and Paleontology Group, Department of Geology, Institute of Technology, Bandung www.fiktm.itb.ac.id/%7eweb-baru/ - Earth Physics Group, Department of Physics, Institute of Technology, Bandung www.fi.itb.ac.id/?p=rearth
Number of Indonesian subscribers in the PAGES database (www.pages-igbp.org/people/) on July 12th: 16 Background photo: Sri Yudawaiti Cahyarini
PAGES NEWS, VOL.14, N°2, AUGUST 2006
Science Highlights: U.S. ESH Program
6
Climate-related changes in export production off the Pacific coast of Mexico during the last deglaciation ROBERT F. ANDERSON1, MARTIN Q. FLEISHER1 AND PETER W. KUBIK2 Lamont-Doherty Earth Observatory, Columbia University, Palisades, USA; boba@ldeo.columbia.edu Paul Scherrer Institute, c/o Institute of Particle Physics, ETH Hönggerberg, Zurich, Switzerland
1
����
��������������
���
������� ����� �������
���
���
���� ���� ����
��������
���
���� ���� ���� ���� ����
����
����������
����
���������
���� ���
�����
���
����
���
���
���
���
��
���������
���� ����
���
���
���
��
Climate-related changes in the ocean’s oxygen minimum zones A striking feature of abrupt climate change during the last glacial period is the correlation between temperature proxy records from Greenland ice cores and the intensity of the oxygen minimum zone (OMZ) in the eastern North Pacific Ocean (Ortiz et al., 2004) and the Arabian Sea (Altabet et al., 2002). Oxygen concentrations decreased during warm interstadial periods, much like conditions today, whereas oxygen concentrations were much greater during cold stadials and the Last Glacial Maximum. Intensification of the OMZ is manifested in several proxies, including concentrations in sediments of organic carbon and of redox-sensitive trace elements, as well as in nitrogen isotope indicators of denitrification. Various investigators have attributed these features to either 1) changes in the supply of oxygen associated with the ventilation of intermediate water mass, or 2) local changes in productivity, as a result of ocean-atmosphere reorganizations, such as is seen during El Niño events today in the eastern North Pacific. Whereas evidence for changes in the intensity of the OMZ is unequivocal, most sedimentary proxies cannot discriminate between the two proposed causes because the impact of low bottomwater oxygen concentrations on the composition of marine sediments (e.g., carbon concentration; trace metal enrichment) is generally in-
� � � �� �� �� ����
� ���
Naturally occurring radionuclides such as 230 Th, 231 Pa and 10 Be are removed from the ocean by scavenging onto particles. Due to their differing sensitivities to particle composition and particle flux, 231Pa/ 230 Th and 10Be/230Th ratios measured in marine sediments can be used to trace past changes in biological productivity of the ocean.
������������
2
���
������������ Figure 1: Records from piston core MV99-PC08 (23.5°N, 110.6°W, 700 m) covering the period from ~6 to ~16 ka BP. (A) Diffuse spectral reflectance (DSR) factor 3, which is representative of the organic carbon content of the sediments (from Ortiz et al., 2004). (B&C) Preserved fluxes (g cm-2 kyr- -1) of opal and organic carbon evaluated using the 230Th normalization method (Francois et al., 2004). (D) Decay-corrected unsupported 231Pa / 230Th (activity ratio; diamonds) and 10 Be / 230Th (109 atoms/dpm, divided by 2 to put them on the same scale as Pa/Th; circles).
distinguishable from that of high biological productivity and associated organic rain rates.
New geochemical proxies link OMZ changes to biological productivity Natural radionuclides can help resolve this. Due to the differential solubilities of the radionuclides, 231 Pa/230Th and 10Be/230Th ratios increase with increasing particle flux (Kumar et al., 1995), which, in turn, is regulated by biological productivity. These ratios have the advantage that they are insensitive to the concentration of dissolved oxygen. However, they are sensitive to changes in particle composition (e.g., the ratio of clay to biogenic PAGES NEWS, VOL.14, N°2, AUGUST 2006
particles or the ratio of carbonate to opal (Chase et al., 2002)) as well as to changes in particle flux (productivity). Therefore, although these ratios do not provide a unique and unambiguous paleoproductivity tracer, they are a valuable component of a multiproxy study because their sensitivities to changing environmental parameters are orthogonal to the sensitivities of other paleoproductivity proxies. Concentrations of 231Pa, 230Th, 10 Be and biogenic constituents were measured in sediments from a piston core recovered from within the OMZ off the southern tip of Baja California (Mexico). Across the last deglaciation, we find that 230 Thnormalized fluxes (Francois et al.,
Science Highlights: U.S. ESH Program 2004) of opal and of organic carbon were positively correlated with the high organic carbon content of sediments deposited during warm periods (Bølling and Holocene; Fig. 1). We find elevated 231Pa/230Th and 10 Be/230Th ratios during warm periods as well (Fig. 1), indicating that increased productivity must have contributed to the higher preserved fluxes of opal and carbon at those times.
logical productivity and the export flux of biogenic particles. Enhanced productivity during warm events reflects a shoaling of the nutricline, an increase in upwelling-favorable winds, or some combination thereof.
Conclusions
Altabet, M.A., Higginson, M.J., and Murray, D.W., 2002: The effect of millennial-scale changes in Arabian Sea denitrification on atmospheric CO2. Nature, 415(6868): 159-162. Chase, Z., Anderson, R.F., Fleisher, M.Q., and Kubik, P., 2002: The influence of particle composition on
While these results do not rule out changes in the ventilation of intermediate waters, they do provide clear evidence for changes in bio-
7
scavenging of Th, Pa and Be in the ocean. Earth and Planetary Science Letters, 204: 215-229. Francois, R., Frank, M., Rutgers Van Der Loeff, M.M., and Bacon, M.P., 2004: Th-230 normalization: An essential tool for interpreting sedimentary fluxes during the late Quaternary. Paleoceanography, 19(1): PA1018, doi:10.1029/2003PA000939. Kumar, N., Anderson, R.F., Mortlock, R.A., Froelich, P.N., Kubik, P., Dittrich-Hannen, B., and Suter, M., 1995: Increased biological productivity and export production in the glacial Southern Ocean. Nature, 378(6558): 675-680. Ortiz, J.D., O’Connell, S.B., Delviscio, J., Dean, W., Carriquiry, J.D., Marchitto, T., Zheng Y., and Van Geen, A., 2004: Enhanced marine productivity off western North America during warm climate intervals of the past 52 ky. Geology, 32(6): 521-524.
NOTE Data used in this study will be available in the NOAA Paleoclimatology data base at: www.ncdc.noaa.gov/paleo/paleo.html
REFERENCES
Is there a pervasive Holocene ice-rafted debris (IRD) signal in the northern North Atlantic? The answer appears to be either no, or it depends on the proxy! JOHN T. ANDREWS1, ANNE E. JENNINGS1, MATTHIAS MOROS2, CLAUDE HILLAIRE-MARCEL3 AND DENNIS EBERL4 Institute of Arctic and Alpine Research and Department of Geological Sciences, University of Colorado, Boulder, USA; andrewsj@colorado.edu Baltic Sea Research Institute Warnemünde, Rostock, Germany and Bjerknes Centre for Climate Research, Bergen, Norway 3 GEOTOP, Université du Québec à Montréal and McGill University, Canada 4 Dennis D. Eberl, U.S. Geological Survey, Boulder, USA 1 2
Introduction One of the most cited papers (271 citations by June 2006) on Holocene climate change is the 2001 paper by Bond and colleagues (2001), which argued for a pervasive ~1500 yr signal in the delivery of hematitestained quartz (HSQ) sands to sites at or beyond the historic limits of observed drift ice (Fig. 1) (we use the term “drift ice” to denote any mixture of glacier icebergs or various forms of sea ice). To critically examine the hypotheses set forth in Bond et al. (2001), we selected a series of cores for analysis of ice-rafted debris (IRD). These cores were collected from sites that are much more within the historically known limits of drift ice (Fig. 1), hence lie to the north of the sites examined for HSQ. Two of the cores are exceptionally well dated (Moros et al., 2006) and the other two have sufficient age control to examine the Holocene trends in IRD.
Methods There is no single working definition of IRD (Andrews, 2000); the
���
��� ������ ���
���������
��� ���������
��� ���
������
���� ���
�
�������� ���
���������
���������
�
�������
�
���
������� ���������
��� ���
������
��� ����
����
����
����������������������� ������������
�
��������� ��������
���
�� �
���
��������������������� Figure 1: Location of cores used in this study (red circles) and cores reported by Bond et al. (2001). Historic maximum limits of drift ice are shown based on data from the International Ice Patrol (www.uscg.mil/LANTAREA/IIP/home.html) and the Norsk Polar Institute (acsys. npolar.no/ahica/quicklooks/looks.htm). Arrow labels: EGC = East Greenland Current; B/LC = Baffinland and Labrador Current; EIC = East Iceland Current.
variations in sediment carried by drift ice are often defined on the basis of grain-size or on some aspects PAGES NEWS, VOL.14, N°2, AUGUST 2006
of provenance (i.e. mineralogy) (Ruddiman, 1977; Andrews et al., 1989; Andrews et al., 1997; Bischof,
8
Science Highlights: U.S. ESH Program 2000). Icebergs and sea ice carry sediments that vary in size from pebbles to fine clay and the largest contribution by weight is generally in the silt fraction. We use quantitative X-ray diffraction identification on the <2000 µm size fraction (Eberl, 2004; Moros et al., 2006), i.e. the sand plus silt plus clay, to identify minerals that are exotic to particular sites, and which can be associated with the transport and delivery of sediments in drift ice (Moros et al., 2006). Between 1-3 g of sediment is milled and spiked with a known weight of corundum or zincite. X-ray scanning is conducted between 5 and 65° two-theta (Eberl, 2004) and the weight% of non-clay and clay minerals is carried out automatically on the digital output files. Results are reported as weight% of the non-clay and clay minerals. Replication experiments indicate that standard errors on the major minerals of interest are of the order of ± 0.5 weight%. We typically identify 15-18 non-clay and 7 clay minerals. The total volume of icebergs calved into Baffin Bay is of the order of 200 km3/yr. Some 40,000 icebergs a year are estimated to calve into Baffin Bay from the large outlet glaciers of W/NW Greenland and the Canadian High Arctic; these icebergs are carried southward in the Baffinland and Labrador currents. The primary sediment signature for glacial erosion and transport in icebergs from NW Greenland is dolomite (Marlowe, 1966). We hypothesize that the major agent of transport in the western North Atlantic, including Baffin Bay and the Labrador Sea, is in icebergs, as the only major source for sediment loading of sea ice is the western area of Hudson Bay. The bedrock geology of Iceland and the East Greenland area in the vicinity of JM96-1205 is composed of Cenozoic flood basalts—hence there is virtually no normative quartz in the bedrock. However, on East Greenland, the basalts lie on Precambrian granites and gneisses, and large outlet glaciers extend seaward along several fjords. Early Tertiary and older sedimentary rocks
Figure 2: Data from northern North Atlantic cores (Fig. 1) compared with hematite-stained quartz data from V28-14 (Bond et al., 2001). Data in plots A-D are based on weight% of minerals in the <2000 µm size fraction. A) MD99-2237—Orphan Knoll; B) JM96-1205—Grivel Basin; C) MD99-2269 and B997-327—North Iceland; D) MD95-2011—Vorring Plateau; E) V28-14—South Denmark Strait.
lie to the north of Kangerlussuaq Fjord and Scorsby Sund, respectively (Jennings et al., 2002). The PAGES NEWS, VOL.14, N°2, AUGUST 2006
sediment transport by drift ice in the eastern North Atlantic (through Fram Strait) is dominated by fine-
Science Highlights: U.S. ESH Program grained silt and clay incorporated into the sea ice on the extensive shelves fronting the Arctic Ocean (Hebbeln, 2000).
Results We discuss the cores along a west to east transect (Fig. 1 & 2A-D) and compare these results with the HSQ data from V28-14 just south of the Denmark Strait. (Bond et al., 2001) (Fig. 2E). MD99-2237 (Fig. 1) was sampled at ~100 yr intervals. On the East Greenland shelf we use the results from JM96-1205, which we also sampled at 100 yr/ sample intervals. MD99-2269 from the North Iceland shelf is from an area where drift ice from the East Iceland Current frequently traverses the site. The core was sampled at ~30 yr/sample and covers the last 12 cal ka BP (Moros et al., 2006). The easternmost core is MD95-2011, located on the Vorring Plateau, and has an average sampling interval of 20 yrs/sample. The Orphan Knoll data (Fig. 2A) presently covers the last 10 cal ka BP. Quartz and dolomite track each other over this interval. Both minerals show a progressive decrease in their weight% toward the present. There are no large-scale changes in either species and, surprisingly, there is no clear indication of an increase in delivery associated with the neoglacial readvance of the Greenland Ice Sheet. The quartz weight% data from the East Greenland margin, south of Scorsby Sund, (Figs. 1 & 2B) shows a very slight trend to increase over the last 4 cal ka BP but the average input of quartz has remained relatively constant over the last 10 cal ka BP. The counts of clasts >2 mm on X-radiographs shows variable IRD inputs between 10 and 8 cal ka BP followed by a period with virtually no IRD and then a marked increase in IRD ca. 4 cal ka BP, consistent with previous data from the East Greenland shelf (Jennings et al., 2002). Drift ice entrained in the East Iceland Current historically impacts the North Iceland shelf where MD99-2269 was retrieved (Moros et al., 2006). The quartz weight% data
shows a decrease from high values in the early Holocene to the mid Holocene, and then a sharp and pronounced increase in quartz over the last 5-6 cal ka BP. Quartz data from core B997-327PC, which was taken within a few 100 m of MD99-2269, are nearly identical. The most easterly core, MD992011, was taken from the Vorring Plateau (Fig. 1). Here, the Quartz/ Plagioclase (Q/P) ratio is used as a measure of ice rafting. The longterm trend in these data (Fig. 2E) is for the Q/P ratio to decrease toward the present. Hence, it does not show the late Holocene increase in IRD proxies that characterize the sites on either side of the Denmark Strait (Figs. 2B & C).
Discussion and conclusions Our four records (Fig. 2A-D) bear little resemblance to the %HSQ from south of Denmark Strait or from the other sites (Fig. 1 & Fig. 2E), although our data are from sites where the deposition of ice-rafted sediments should be much more obvious because of their more iceproximal locations. Our data do not posses the amplitude of variation noted in the HSQ data (although this is partly a function of the plotting scale and whether the data are detrended or not) and they do not show a clear ~1.5 ka periodicity. Indeed, the sites differ significantly in their long-term trends (compare Figs. 2A & 2C). In each area, we have results from other cores (e.g. Fig. 2C) that we are using to develop robust regional IRD signals. Of special interest on the Labrador and East Greenland margins is whether or not there is a coupling between the IRD proxies associated with grain-size and mineralogy (e.g. Fig. 2B). This begs the question as to whether we can construct a proxy for Holocene IRD that incorporates all the necessary elements of both grain-size and provenance. Given that the bulk of glacial and sea ice transported sediments is much finer than 63 µm, then the XRD method offers significant advantages, especially if we can distinguish mixtures of minerals that define source areas (Darby, 2003). PAGES NEWS, VOL.14, N°2, AUGUST 2006
Our results should make researchers question the underlying forcing behind the HSQ data (Fig. 2E). The cycles in this and the other records may be linked to solar forcing but the specific link to ice rafting appears ambiguous. The varying trends in our data suggest we need to consider the Holocene oceanographic/climate evolution of each region individually (de Vernal and Hillaire-Marcel, in press). ACKNOWLEDGEMENTS Andrews, Jennings and Eberl acknowledge the assistance of the NAS-ESH program in funding their research on the Holocene ice rafting records.
NOTE Data used in this study will be available in the NOAA Paleoclimatology data base at: www.ncdc.noaa.gov/paleo/paleo.html For detailed information, contact the authors.
REFERENCES
Andrews, J. T., 2000: Icebergs and Iceberg Rafted Detritus (IRD) in the North Atlantic: Facts and Assumptions. Oceanography, 13: 100-108. Bond, G., Kromer, B., Beer, J., Muscheler, R., Evans, M.N., Showers, W., Hoffman, S., Lotti-Bond, R., Hajdas, I., and Bonani, G., 2001: Persistent solar influence on North Atlantic climate during the Holocene. Science, 294: 2130-2136. Darby, D. A., 2003: Sources of sediment found in the sea ice from the western Arctic Ocean, new insights into processes of entrainment and drift patterns. Journal of Geophysical Research, 108: 13-11 to 13-10. doi: 10, 1111029/1112002JC1001 350, 1112003. De Vernal, A., and Hillaire-Marcel, C., in press: Provincialism in trends and high frequency changes in the northwest North Atlantic during the Holocene: Global Planetary Change. Eberl, D. D., 2004: Quantitative mineralogy of the Yukon River system: Variations with reach and season, and sediment source unmixing. American Mineralogist, 89: 1784-1794. Jennings, A. E., Knudsen, K. L., Hald, M., Hansen, C. V., and Andrews, J. T., 2002: A mid-Holocene shift in Arctic sea ice variability on the East Greenland shelf. The Holocene, 12: 49-58. Moros, M., Andrews, J. T., Eberl, D. D., and Jansen, E., 2006: Holocene history of drift ice in the northern North Atlantic: Evidence for different spatial and temporal modes, Paleoceanography, 21, PA2017, doi:10.1029/2005PA001214. For full references please consult: www.pages-igbp.org/products/newsletters/ref2006_2.html
9
10
Science Highlights: U.S. ESH Program Progress in the study of Asian Monsoon climate dynamics using dendrochronology BRENDAN M. BUCKLEY*, ROSANNE D. D’ARRIGO, EDWARD R. COOK, GORDON C. JACOBY, WILLIAM E. WRIGHT Tree Ring Laboratory, Lamont-Doherty Earth Observatory, Columbia University, Palisades, USA; *bmb@ldeo.columbia.edu
Introduction Scientists at the Tree-Ring Laboratory of the Lamont-Doherty Earth Observatory of Columbia University in New York are entering the third year of a five-year project on Tree-Ring Reconstructions of Asian Monsoon Climate Dynamics (see www.ldeo. columbia.edu/res/fac/trl/). The scope of the project spans the entire Asian region linked to or affected by the monsoon, from Siberia, Mongolia and North Asia, to Australasia and Oceania, mainland Southeast Asia and the Indian subcontinent in the south. The first two years have heavily emphasized the building of tree-ring data networks for reconstructing features of Asian monsoon climate and the factors influencing its variability (e.g., Indo-Pacific sea surface temperature (SST) fields), in part for the purpose of driving General Circulation Model (GCM) estimates of monsoon climate variability with paleoclimate data spanning the past several centuries. A dearth of tree-ring data from the tropical regions prompted our commitment to obtaining such data from the Asian tropics first; hence our initial focus on field investigations in tropical Asia.
Figure 1: Map showing the Asian monsoon region that is the project focus. Red dots: tree-ring data locations that were available at the start. Yellow dots: data that have been contributed from various sources. Light blue dots: new data and chronologies that have been developed over the past ca. two years of field work in monsoon Asia.
Renewable Natural Resources Research Center in Jakar, Bhutan, are all fully functional. New programs are being developed at the University of Los Baños in the Philippines, and at the University of Peradeniya in Kandy, Sri Lanka. We have also developed close ties to regional
tree-ring scientists from Lanzhou University in China, the Birbal Sahni Institute of Palaeobotany in Lucknow, India, and the Indian Institute of Tropical Meteorology in Pune. In all of these locations, we have defined our top priorities as true collaboration, education, capacity building and technology transfer, in order to insure that our research will have a lasting impact in Asia. In turn, our Asian collaborators have had much to teach us about the climate and environment of their respective regions, and have been instrumental in facilitating our ability to collect treering samples. This project has also benefited from contributors to the NOAA Paleoclimatology Data Bank (www.ncdc.noaa.gov/paleo/paleo. html) and from many individuals who have contributed data directly to our project.
Developing a climate story Our efforts have already begun to yield results, as we have substantially increased our tree-ring data
Regional collaboration A project of this magnitude requires a strong commitment from regional collaborators, and the list of foreign participants that are integral to this project is far too exhaustive to present here. Importantly, we have helped to develop tree-ring laboratories at several institutions in Asia, and we have consistently worked to supply formal training in dendrochronological techniques. For example, the Laboratory of Tropical Dendrochronology at Kasetsart University in Bangkok, the Tree Ring Laboratory at Mongolian National University in Ulan Baatar, a facility at the Institut Teknologi Bandung in Java, Indonesia, and another at the
Figure 2: Indonesian warm pool SST reconstruction (D’Arrigo et al., in press). A shows actual (black) and reconstructed (red) September-November Indonesian warm pool SSTs. Several volcanic episodes during the 19th century are indicated with arrows. B shows running 31-year correlation plots between reconstruction and instrumental data. Correlations are calculated for both unfiltered data (green) and 1st differenced transforms (blue) (Fig. by Robert J. Wilson).
PAGES NEWS, VOL.14, N°2, AUGUST 2006
Science Highlights: U.S. ESH Program 2.00 1.50 Indices
network for the Asian monsoon region, particularly in the Asian tropics (see Fig. 1). It is critically important to the goals of our project that we define the role of the tropics in driving or modulating notable climate changes over the past 500 to 1000 years. We framed our project around analyzing three primary features of climate variability that were identified by Meehl and Arblaster (2002) as having links to variability in the strength of the monsoon; Indian Ocean SSTs, tropical Pacific SSTs, and land temperatures over the Tibetan Plateau and northern Eurasia. We are sampling tree-ring sites that are influenced by one or more of these monsoon-related features. For example, Buckley et al. (2005) demonstrated links between pine sites from Bhutan, India and Thailand, and all three of the abovementioned features, while D’Arrigo et al. (2005) modeled relationships between the North Pacific Index and the tropics, and D’Arrigo et al. (in press) developed a tree-ring and coral-based reconstruction of Indonesian warm pool SSTs (Fig. 2a). Many old teak logs buried in alluvial sediments may also yield extensions of our existing Indonesian chronologies by several centuries. Other efforts are resulting in new climate-sensitive records from sites across our study region, in places as diverse as Mongolia, the Philippines, and Laos. Our studies are beginning to clarify periods of reduced monsoon strength that appear to be linked to SST variability in the eastern tropical Pacific. For example, a 450-year moisture-sensitive teak chronology that we have developed from northwestern Thailand (Fig. 3) shows marked reductions in inferred monsoon strength in the early to middle 1700s. This finding is consistent with Dunbar et al. (1994), who showed persistent warm SST anomalies in the eastern tropical Pacific during this time, based on coral records from the Galapagos Islands. It is also consistent with the expected effects of persistent El Niño conditions on rainfall in this area of Thailand, and agrees with a speleothem record from central India (Kevin
11
1.00 0.50 0.00
1600
1700
1800 Year
1900
2000
Figure 3: Plot of the MHS teak chronology from northwestern Thailand, developed from living trees and 57 stumps that remain from logging at the beginning of the 20th century. We made individual tree chronologies using 4-7 radii from each tree. The growth reductions in the early and mid-1700s mark periods of reduced monsoon strength that are likely related to warm SST anomalies in the eastern tropical Pacific, consistent with evidence from Dunbar et al (1994).
Cannariatto and Lowell Stott, pers. comm.) that indicates an unusually weak monsoon in central India at this time. The speleothem record also suggests enhanced monsoon activity throughout much of the Medieval Climate Anomaly (MCA) period that would be consistent with persistent La Niña-like cold SST anomalies in the eastern tropical Pacific. We have yet to build continuous tropical tree-ring chronologies that extend back far enough to analyze the MCA, although we have collected sub-fossil teak river logs and log coffin wood that date back to this period. We are collaborating with Drs. Cannariatto and Stott to compare isotopic records of these teak samples with their speleothem results, and see this as an important new avenue of research.
Summary These and other recent studies demonstrate our ability to model past climate in the Asian monsoon region, and highlight the important role of tropical forcing on global climate. Combined with our very long tree-ring records from extratropical Asia, we anticipate millennial-length coverage at several key locations across the range of our developing Asian network. This research is ongoing but gives us hope for some very exciting results in the near future. Over the remaining three years of this grant, we anticipate that our efforts will result in an increased understanding of the mechanisms behind the Asian PAGES NEWS, VOL.14, N°2, AUGUST 2006
monsoon through regional reconstructions and modeling. ACKNOWLEDGEMENTS This five-year project is supported by the National Science Foundation’s Paleoclimate Program (Grant OCE 04-02474), and runs until the end of July 2009.
REFERENCES
Buckley, B.M., Cook, B.I., Bhattacharyya, A., Dukpa, D., and Chaudhary, V., 2005: Global surface temperature signals in pine ring width chronologies from southern monsoon Asia. Geophysical Research Letters, 32: L20704, doi:10.1029/ 2005GL023745, 2005. D’Arrigo, R., Wilson, R., Deser, C., Wiles, G., Cook, E., Villalba, R., Tudhope, A., Cole, J., and Linsley, B., 2005: Tropical-North Pacific climate linkages over the past four centuries. Journal of Climate, 18: 5253-5265. D’Arrigo, R., Wilson, R., Palmer, J., Krusic, P., Curtis, A., Sakulich, J., Bijaksana, S., Zulaikah, S., Ngkoimani, O., and Tudhope, S. in press: Reconstructed Indonesian warm pool SSTs from tree rings and corals: linkages with ENSO and the Asian monsoon. Paleoceanography, 21:, doi:10.1029/ 2005PA001256, 2006. Dunbar, R.B., G.M. Wellington, M.W. Colgan and Glynn, P.W., 1994: Eastern Pacific sea surface temperature since 1600 A.D.: The δ18O record of climate variability in Galapagos corals. Paleoceanography 9(2): 291-315. Meehl, G. and Arblaster, J., 2002: The tropospheric biennial oscillation and Asian-Australian monsoon rainfall. J. Climate, 15: 722-744.
Science Highlights: U.S. ESH Program
12
Solar forcing of the tropical Pacific climate and impacts over North America for the last millennium AMY C. CLEMENT1, JULIEN EMILE-GEAY2, RICHARD SEAGER2, MARK CANE2 AND MICHAEL N. EVANS3 Rosenstiel School of Marine and Atmospheric Sciences, University of Miami, USA; aclement@rsmas.miami.edu Lamont-Doherty Earth Observatory, Columbia University, Palisades, USA; julieneg@ldeo.columbia.edu, rich@ldeo.columbia.edu, mcane@ldeo.columbia.edu 3 Laboratory of Tree-Ring Research, University of Arizona, Tucson, USA; mevans@ltrr.arizona.edu 1 2
Introduction
Modeling results In this paper, we present results from several recent studies, many of which have been supported under the National Science Foundation’s Earth System History program, in order to illustrate how the tropical Pacific climate has responded to solar forcing over the last 1000 years. Figure 1a shows
���
���
�
����
����
����
����
����
����
����
����
����
����
����
����
���� �
�����
����������������������������������������������� ������������������������������������
�
�
�
�
�
�
�
�
��
��
��
� ����
�������� �
�������������������� �
���
��
����
����
����
����
����
����
����
����
���� �
� �
����
It is now well known that the state of the tropical Pacific climate has a large influence on the global climate, as evidenced by the interannual variations associated with the El Niño/Southern Oscillation (ENSO) and its global teleconnections. If the mean state of the tropical Pacific were to undergo shifts on longer timescales, it is likely that such changes would also have global impacts. This possibility has prompted debate about whether the tropical Pacific has undergone changes over the 20th century that are akin to the warm phase (El Niño) or cold phase (La Niña) of ENSO, and also whether such shifts will be part of the climate response to increased greenhouse gases (GHGs) in the future. At present, state-ofthe-art coupled ocean-atmosphere general circulation models (GCMs) simulate different responses in the tropical Pacific climate to increased GHGs, with some models predicting a decreased east/west sea surface temperature (SST) gradient (akin to El Niño), others predicting an increased gradient (akin to La Niña), and still others predicting no change (Collins et al., 2005). Given this uncertainty, it is reasonable to turn to the past to learn about how the tropical Pacific responded to climate forcing, and whether the influence of the tropical Pacific can be seen in past regional climate proxies around the globe.
������������������������������������������
� �� �� �� � ����
����������������������������������
����
����
����
����
����
����
����
����
����
������������
Figure 1: Top Panel: Solar forcing over the last millennium, from Crowley (2000). Units are Wm-2. Middle Panel: NINO3 SST index simulated by the ZC model in response to the solar forcing shown in the top panel (blue curve). The green curve shows the NINO3 value reconstructed using the methodology of Evans et al. (2002) applied to a network of 65 corals (reported by Evans et al., 2001). Both curves are normalized and smoothed with a 40-year low-pass filter. Bottom panel: Palmer Drought Severity index for the western U.S. as reconstructed from the Cook et al. (2004) gridded data. Negative values indicate drought conditions and positive values wet conditions. The data are normalized and smoothed with a 40-year low-pass filter.
the solar forcing as reconstructed by Crowley (2000). This forcing is imposed on the Zebiak-Cane (ZC) coupled ocean-atmosphere model, which simulates anomalies about the current climate in the tropical Pacific. Results from a 100-member ensemble (in which the forcing is identical but initial conditions are varied slightly from member to PAGES NEWS, VOL.14, N°2, AUGUST 2006
member) are shown in Figure 1b (blue line). There is a clear anti-correlation between the solar forcing and the value of NINO3 (average SST anomaly over the region 5°S5°N and 150-90°W) such that when the solar irradiance is higher, the mean NINO3 value is negative (akin to a La Niña with an increased eastwest gradient), and when irradiance
Science Highlights: U.S. ESH Program
Figure 2: Schematic representation of the ‘thermostat’ mechanism (see text) proposed by Clement et al. (2006). Figure courtesy of Lowell Stott.
is lower, NINO3 is higher (akin to an El Niño with a decreased gradient). It should be noted that there is currently considerable debate as to the magnitude of the centennial timescale variations in the solar irradiance, so these results should be interpreted only qualitatively. The model results can be explained by a mechanism that has been dubbed the ocean dynamical thermostat (Clement et al., 1996), in which a heating of the tropical Pacific ocean leads to a cooling of the NINO3 region (illustrated schematically in Fig. 2). This result arises from the different surface temperature response in the eastern and western Pacific: In the west, where the thermocline is deep, the response to surface heating is largely thermodynamic and the mixed layer adjusts with an increased temperature. In the east where the thermocline is shallow, cooling by vertical advection offsets the surface heating, producing a smaller temperature response. The increased zonal sea surface temperature (SST) gradient accelerates the trade winds, which leads to further thermocline shoaling and cooling by vertical advection in the east, further accelerating the winds. This ‘climatological’ Bjerknes feedback, akin to that which operates on interannual timescales, leads to a cooling of the eastern equatorial Pacific in response to a heating of
the Basin. Is there any evidence of such behavior in the paleoclimate record?
Paleoclimate observations An extremely important archive of past behavior of ENSO and the mean state of the tropical Pacific comes from both living and fossil corals. Evans et al. (2002) have used a network of coral records to reconstruct SST from the tropical Pacific over the last several centuries. The reduced space objective analysis methodology of Evans et al. (2002) was applied to a larger number of coral records (Evans et al., 2001), and the resulting NINO3 reconstruction is plotted in Figure 1b (green line). Agreement between independently-reconstructed NINO3 and model-simulated NINO3 is encouraging; both lines of evidence suggest a maximum value in the mid- to late-17th century, coinciding with the Maunder Minimum, and a shift towards lower values of NINO3 from that time until through the 20th century. There are, however, notable differences between the model and data on multi-decadal timescales which may be due to deficiencies in both products. We must assume that the interpretation of coral-reconstructed SST has fidelity on timescales longer than are available for statistical calibration. The model simulates a trend of decreasing NINO3 over PAGES NEWS, VOL.14, N°2, AUGUST 2006
the 20th century, while the data do not show such a trend, perhaps because changes in greenhouse gas concentrations are not modeled. There are other coral records that support the picture of a warm eastern equatorial Pacific (or reduced east-west gradient) in the mid-17th to mid-18th century. Cobb et al. (2003) found relatively light values for δ18O (warm, fresh conditions) in corals from Palmyra Island during the 17th century. They also found relatively heavy values (cold, salty) during the 12th to 13th centuries, a time when the solar forcing was high. If the modern behavior of δ18O on interannual timescales is extended to the past, this would indicate a reduced east-west gradient for the 17th to 18th centuries, and an increased gradient for the earlier medieval period, consistent with the model results. Damassa et al. (2006) also showed that coral records from the western Indian ocean indicate that SSTs were warmer during the mid-17th to mid-18th century. Again, if the modern ENSO analogy is extended to the past, this would imply a reduced east-west gradient at that time, also consistent with the model results. This collection of model results and coral data from the tropical Pacific appears to suggest that solar forcing has an influence on the tropical Pacific climate in a manner consistent with the ocean dynamical thermostat. The implications of this may extend beyond the Pacific Basin. Seager et al. (2005) and Herweijer et al. (2006a) have used observations and model simulations to argue that decadal timescale La Niña-like SST changes were responsible for the six severe multi-year North American droughts since the mid-19th century. Herweijer et al. (submitted) used a gridded drought reconstruction based on tree-ring data from Cook et al. (2004) to show the existence of ‘mega-droughts’ during the medieval period that had a spatial pattern very similar to modern droughts. They argued that the temporal drought variability was similar to that of the 20th century but that it occurred around a drier mean state, such that peri-
13
Science Highlights: U.S. ESH Program
14
ods of, for example, Dust Bowl level aridity, lasted for 20-40 years. Graham et al. (submitted) have used proxies to estimate medieval SSTs and demonstrated that when they are used to force an atmospheric GCM, drought results over North America. The altered mean state of the medieval period, not only in North America but also in other ENSO sensitive regions (e.g., East Africa, northern South America, South Africa, the Sahel and the Indian ocean; Herweijer et al., submitted), is consistent with a solar-induced La Niña-like state in the tropical Pacific. The tree ring data also show that the Little Ice Age was a relatively wet period in the central U.S. compared with the earlier medieval period (Fig. 1c), consistent with a shift towards a reduced east-west gradient, as shown in Figure 1b.
Final points Of course, a number of caveats apply here. First, model studies have shown that Atlantic SSTs exert an influence on central U.S.
precipitation (Schubert et al., 2004; Seager et al., submitted; Sutton and Hodson, 2005), so there is no reason to believe that conditions in the tropical Pacific are a perfect predictor of central U.S. rainfall. It should also be noted that the observations of tropical Pacific SSTs are quite sparse prior to the 20th century, and coral data for the last 1000 years are critical to filling in these gaps. Finally, there is the issue of the magnitude of solar irradiance changes. While the ZC model is fairly sensitive to even small solar forcing (Emile-Geay et al., accepted), if the mid-range value of 0.5 Wm-2 is accepted, the model response is quite small (~0.15°C). Thus, while the linkages explored here might have qualitative support from models and paleoclimate observations, it is difficult to argue for such large quantitative changes in the climate system from solar forcing alone. Thus remains the centuries-old problem of why the climate response to solar forcing appears to
be so large. Perhaps the tropical Pacific is part of the answer but it may not be the whole story. NOTE Data used in the study can be found in the ‘data’ section of the authors research page at http://www.ldeo.columbia.edu/~julieneg/ research.html.
REFERENCES
Clement, A.C., Seager, R., Cane, M.A., and Zebiak, S.E., 1996: An ocean dynamical thermostat. J. Climate, 9: 2190-2196. Emile-Geay, J., Cane, M., Seager, R., Kaplan, A., and Almasi, P., accepted: ENSO as a mediator of the solar influence on climate, Paleoceanography. Evans, M.N., Kaplan, A. and Cane, M.A., 2002: Pacific sea surface temperature field reconstruction from coral delta O-18 data using reduced space objective analysis. Paleoceanography, 17, Art. No. 1007. Herweijer, C., Seager, R. and Cook, E.R., 2006a: North American droughts of the mid to late nineteenth century: a history, simulation and implication for Mediaeval drought, The Holocene, 16(2): 159-171. Seager, R., submitted: The turn of the century drought across North America: Dynamics, global context and prior analogs. J. Climate. For full references please consult: www.pages-igbp.org/products/newsletters/ref2006_2.html
The mystery interval 17.5 to 14.5 kyrs ago GEORGE H. DENTON1, WALLACE S. BROECKER2 AND RICHARD B. ALLEY3 Department of Earth Sciences and Climate Change Institute, University of Maine, Orono, USA; gdenton@maine.edu Lamont-Doherty Earth Observatory, Columbia University, Palisades, USA 3 Pennsylvania State University, University Park, USA 1 2
The time period between the beginning of Heinrich event #1 (H-1) and the onset of the Bølling/Allerød rivals the Younger Dryas in importance to our understanding of how the planet responds to abrupt mode switches. This interval also constitutes the onset of the most recent termination, arguably the most fundamental climate shift of the last 100-kyr glacial cycle. As some of the responses during this time appear to be mutually contradictory, we term it the “Mystery Interval”.
Key observations Notable events during the 3000year-long Mystery Interval are as follows (Fig. 1). • The H-1 iceberg armada was discharged into the North Atlantic
Ocean (Bond et al., 1992; Hemming, 2004). • Export of 231Pa from the Atlantic to the Southern Ocean appears to have come to a halt, signaling a shutdown of North Atlantic meridional overturning circulation (McManus et al., 2004). • The northern Atlantic Ocean and the Mediterranean Sea became unusually cold (Bard et al., 2000; Cacho et al., 2001). • Conditions in Greenland were heavily weighted toward hypercold winters (stadial GS-2a; Denton et al., 2005). • Northwestern Europe was similarly dominated by hypercold winters (Late-Pleniglacial; Renssen and Isarin, 2001).
PAGES NEWS, VOL.14, N°2, AUGUST 2006
• The Asian monsoons were notably weakened (Wang et al., 2001). • The Atlantic Intertropical Convergence Zone (ITCZ) was locked into a southerly position (Peterson et al., 2000; Lea et al., 2003). • Temperate mountain glaciers in both hemispheres underwent major recession that began about 17.5 kyr (Denton et al., 1999; Schaefer et al., 2006). By 14.5 kyr at the end of the Mystery Interval, Swiss mountain glaciers had withdrawn to the inner Alps (Schlüchter, 1988). • Closed-basin lakes in North America’s Great Basin reached their greatest size (Benson, 1993; Garcia and Stokes, 2000).
Science Highlights: U.S. ESH Program • The African rift valley suffered maximum aridity (Johnson et al., 1996). • The 14C to C ratio in the atmosphere dropped by 190 per mil (Broecker and Barker, in press). • Deglacial warming of Antarctica and the rise of atmospheric CO2 content became pronounced (Monnin et al., 2001).
Possible explanation
Figure 1: The Mystery Interval is marked by yellow background. A shows deuterium and CO2 records from the EPICA Dome C ice core on the East Antarctic plateau (Monnin et al., 2001). Chronology is based on Schwander et al. (2001). B gives the GISP2 isotope record (Stuiver and Grootes, 2000). C illustrates ice-rafted grains and magnetic susceptibility in core SU-8118 off Portugal (Bard et al., 2000). IRD is expressed as the number of grains per gram for the size fraction greater than 150 µm. The H-1a IRD peak features quartz and feldspars, with minor hematite-coated grains, glauconite, and volcanic shards. The H-1b IRD peak is largely detrital carbonate, with minor amounts of quartz and feldspar (Bard et al., 2000). D is SST from two calibrations for alkenone unsaturation ratios from core SU-8118 (Bard et al., 2000). E is a 231Pa/230Th profile from core GGC5 from the Bermuda Rise (McManus et al., 2004). YD: Younger Dryas, B/A: Bølling/Allerød, MI: Mystery Interval, LGM: Last Glacial Maximum. Figure adapted in part from McManus et al. (2004).
PAGES NEWS, VOL.14, N°2, AUGUST 2006
How these events fit together is a major puzzle. One seeming contradiction may afford an important clue; namely, extensive deglaciation of the European Alps occurred during a time of maximum cold in the adjacent Atlantic Ocean and Mediterranean Sea, along with some indications of continued cold conditions, at least during winter, on the continent itself. This conclusion comes from oxygen-isotope curves of carbonate from lakes and mires that allow European climate oscillations to be tied directly to the Greenland template (e.g., von Grafenstein et al., 1999). Such records from the Swiss Alps show that extensive glacier recession had already occurred prior to the distinctive earliest Bølling isotope switch, which was accompanied by a “juniper jump” in pollen profiles (Eicher and Siegenthaler, 1976). It is important to note from isotope chronologies that both Andean and New Zealand mountain glaciers abandoned their innermost Last Glacial Maximum (LGM) positions and also suffered extensive retreat during the Mystery Interval (Denton et al., 1999; Strelin and Denton, 2005; Schaefer et al., 2006). Assuming that our read of the evidence is correct, we can think of only one explanation for this contradiction; namely, that the cold oceanic and terrestrial conditions reflect extensive winter seaice cover in the northern Atlantic and that the retreat of temperate mountain glaciers reflects warming summer conditions brought on by rising atmospheric CO2. If this is indeed the explanation, then we suggest the following scenario: The Mystery Interval was initiated
15
16
Science Highlights: U.S. ESH Program by the melting of the H-1 iceberg armada. This melting reduced the salinity of the northern Atlantic to the point where deep water could no longer form. The resulting shutdown of meridional overturning circulation was so severe that the export of 231Pa from the North Atlantic was reduced by an even larger extent during the Mystery Interval than during either the LGM or the Younger Dryas (McManus et al., 2004). As a consequence of this shutdown, the northern North Atlantic cooled, allowing the spread of winter sea ice. Such expansion of sea ice, perhaps as far south as 48°N, is required for the severe winter cooling that produced widespread periglacial features in northwestern Europe (Renssen and Isarin, 2001). In addition, winter sea ice is almost certainly the primary cause of depressed mean annual temperatures in Greenland, which are highly skewed toward winter (Denton et al., 2005). As shown by Chiang and Bitz (2005), widespread winter sea ice in the northern Atlantic not only cools the northern high-latitude region, but pushes southward the Atlantic sector of the ITCZ. Furthermore, according to Barnett et al. (1988), the consequent increase in the duration of Asian snow cover lessens the effectiveness of the summer warm season in heating the continent, hence weakening summer monsoons. It thus appears likely that severe winter conditions in the northern latitudes during the Mystery Interval, originating from the shutdown of North Atlantic overturning and spread of winter sea ice, afforded the physical linkage between millennial-scale Greenland, European, and North Atlantic temperature fluctuations; the ITCZ; and Asian monsoons (Denton et al., 2005). The relative timing of northern and southern events shown in Figure 1 suggests that the shutdown of meridional overturning in the North Atlantic during the Mystery Interval may have been the major factor in driving the last termination, which in panel A of Figure 1 is marked by the rise of Antarctic tem-
perature and of atmospheric CO2. A consequence of this shutdown of northern overturning appears to have been an overall reorganization of ocean circulation, probably through the operation of a bipolar thermohaline seesaw (Broecker, 1988), that led to shrinkage of the sea-ice fringe around Antarctica. As a result, Antarctica warmed while atmospheric CO2 slowly increased, perhaps due to more efficient degassing from the Southern Ocean (Stephens and Keeling, 2000). These events were curtailed when northern overturning resumed during the Bølling/Allerød. They were then renewed during the Younger Dryas, which in many ways was a shorter repetition of the Mystery Interval. It is far from clear why the shutdown from the H-1 iceberg armada could have had a greater impact than those associated with the five earlier Heinrich armadas. A possible clue is that terminations begin at what would intuitively seem to be unlikely times; namely, just as ice sheets achieve maximum volumes at the culmination of the long buildup leg of an asymmetric 100-kyr cycle. In fact, Raymo (1997) suggested from marine benthic oxygen-isotope records that the prerequisite for a sharp and complete termination was “excess” ice stored in northern ice sheets. Once excess ice volume is achieved, major deglaciation awaits only the next rise of northern summer insolation. Does this suggest that the collapse of such excess ice into the North Atlantic is what caused the H-1 ice armada to be so effective in triggering the last termination? Princeton GFDL’s Isaac Held (2006) makes the case that the warmer climate to be generated by the ongoing buildup of greenhouse gases will lead to even wetter conditions in the tropics and even drier conditions in the deserts of the extra tropics. The converse of this is that in the colder glacial world, the opposite should have been true. If so, then the cold ocean conditions and the enhanced sea ice cover of the Mystery Interval might account for the unusually large exPAGES NEWS, VOL.14, N°2, AUGUST 2006
tent of the closed-basin lakes in the Great Basin and the dessication of equatorial Africa’s Lake Victoria. Hostetler et al. (1999) found such a signature for modeled waterbalance anomalies in response to specified changes in North Atlantic sea-surface temperatures at the time of Heinrich event #2 (H-2). One last occurrence merits mention. As shown by Adkins and Schrag (2003), during peak glacial time, an abyssal ocean reservoir with one gram per liter higher salt content than the rest of the deep ocean appears to have existed. Their idea is that the reservoir owed its existence to the input of dollops of brine released from Antarctica’s greatly expanded glacial sea-ice apron. If, as the result of its isolation from the rest of the ocean, this reservoir were greatly depleted in radiocarbon, it could help to explain why the 14C to C ratio of the glacial atmosphere was so much higher than that for the late Holocene. Even more importantly, the demise of this reservoir caused by the reduction in brine supply related to the retreat of the ice margin could explain the large drop in the atmosphere’s 14C to C ratio during the course of the Mystery Interval (Broecker and Barker, in press). REFERENCES
Bard, E., Rostek, F., Turon, J.-L., and Gendreau, S., 2000: Hydrological impact of Heinrich events in the northeast Atlantic. Science, 289: 1321-1323. Denton, G.H., Alley, R.B., Comer, G.C., and Broecker, W.S., 2005: The role of seasonality in abrupt climate change. Quaternary Science Reviews, 24: 1159-1182. McManus, J.F., Franciois, R., Gherardi, J.-M., Keigwin, L.D., and Brown-Ledger, S., 2004: Collapse and rapid resumption of Atlantic meridional circulation linked to deglacial climate change. Nature, 428: 834-837. Monnin, E., Indermühle, A., Dällenbach, A., Flückiger, J., Stauffer, B., Stocker, T.F., Raynaud, D., and Barnola, J.-M., 2001: Atmospheric CO2 concentrations over the last glacial termination. Science, 297: 112-114. Stuiver, M., and Grootes, P., 2000: GISP2 oxygen-isotope ratios. Quaternary Research, 53: 277-284. For full references please consult: www.pages-igbp.org/products/newsletters/ref2006_2.html
Science Highlights: U.S. ESH Program Delayed onset of the South American Summer Monsoon during the Last Glacial Maximum KERRY H. COOK AND ED K. VIZY Department of Earth and Atmospheric Sciences, Cornell University, Ithaca, USA; khc6@cornell.edu
Introduction Climate conditions in the Amazon basin during the last glacial maximum (LGM, about 21,000 years ago) are actively discussed in the literature. Faunal evidence, noble gas analyses, lake status reconstructions, pollen counts, atmospheric dust, and charcoal records have all been interpreted to provide information about LGM surface moisture and temperature. Much of the evidence suggests that large-scale climate conditions were drier and cooler in the Amazon basin but there is great uncertainty and little quantitative guidance. Proxy data from the high Andes and the Nordeste region of Brazil, e.g., indicate that some regions may have been wetter during the LGM. Differences in Amazon climate during the LGM are of great interest in the light of current pressing climate change issues. Fundamental questions remain about the stability of tropical climate, and the influence of climate and deforestation on the diversity of tropical vegetation.
drier during LGM
wetter during LGM
Methodology There are two ways of learning about past climates, namely, inference based on physical evidence, and computer simulation. Each method has its own strengths and weaknesses. Physical evidence is undeniably real but there may be uncertainties associated with interpretation and dating. Climate modeling provides complete information about the climate state but there are always concerns about accuracy. Both approaches to studying paleoclimate are needed and the most powerful way of reconstructing past climate is to use the two methods in a complementary way, so that they test, challenge and correct each other. The most effective way of doing this is to use a regional climate model (RCM), which is capable of finer resolution than a global model, to bring the paleoclimate simulation closer to the spatial scales of the geological
Figure 1: Model domain and total annual precipitation difference between the present day and the LGM simulations. Shading interval is 1 mm day -1, and the 0 line is contoured. Marks denote LGM precipitation differences from present day interpreted from various proxy reconstruction sites
evidence for a more direct comparison. Here we use an RCM with 60 km horizontal resolution and 24 vertical levels, coupled with a potential vegetation model (PVM; Oyama and Nobre, 2004). The model domain, which is unusually large, is shown in Figure 1. A realization of the present day annual climatology was produced by initializing with the observed climatology for 00Z 15 October and running through 382 days, with a 1-minute time step and vegetation types held fixed at today’s values. A second year was run to verify that the climatology is stable. The regional model replicates the observed climate of South America PAGES NEWS, VOL.14, N°2, AUGUST 2006
well, providing a definite improvement over global model simulations, which typically have 200 km resolution and difficulties resolving the steep Andean topography (Vizy and Cook, 2005). Paleoclimate application of regional models is complicated by the need to specify lateral boundary conditions for wind velocity, temperature and moisture throughout the depth of the troposphere; such conditions are not available from the geological record. Here, present day lateral boundary conditions based on modern observations are used for both the present day and LGM simulations. This is justified by extensive testing of the sensitivity of
17
Science Highlights: U.S. ESH Program
18
the simulation to the lateral boundary conditions (Vizy and Cook, 2005), and is likely successful because of the large domain and the tropical location. But remote influences on climate, e.g., in association with the North American ice sheets or sea ice in the North Atlantic, are not included. Such influences can be represented by imposing lateral boundary conditions from global model simulations but we find that our present day simulation is seriously degraded by this lateral boundary forcing, since an accurate simulation of this region’s climate is a particular challenge for the lower-resolution global models. In any case, remote forcing may be somewhat influential and warrant future consideration but it is not a primary determinant of South American climate (Lenters and Cook, 1995). The LGM climate is simulated by making minor changes in the Earth’s orbital parameters, reducing the atmospheric CO2 concentration from 330 to 200 ppmv, and by specifying LGM sea surface temperatures following Paul and Schäfer-Neth (2003). Use of the PVM provides independence from having to specify LGM vegetation from geological reconstruction. The output of the coupled RCM/PVM integration consists of a mutually-adjusted solution for both the LGM climate and the LGM vegetation.
Results Figure 1 shows simulated differences in annual precipitation for the “LGM” minus “present day” simulations. In most parts of the Amazon basin, total annual rainfall in the LGM simulation is 25-35% lower than in the present-day simulation, but there are some regions with precipitation increases. A delayed onset of the South American monsoon by 2-3 months is primarily responsible for the simulated LGM aridity (Cook and Vizy, 2006). The annual mean surface temperature over subtropical South America is only slightly cooler than in the present day simulation. The land surface is 1-2 K cooler for most of the year but warms significantly during the spring, since the delay in the mon-
rainfall rates are similar to those of the present-day climate. Figures 2a and b show the vegetation distributions from the present-day and LGM simulations. The good agreement between the modeled and observed vegetation (Fig. 2a) is a powerful validation of the RCM’s ability to capture the present-day climate accurately. In the LGM simulation (Fig. 2b), rainforest vegetation in the central and western Amazon is maintained despite the shorter rainy season and longer dry season. Rainforest in the eastern Amazon, however, cannot be maintained under LGM conditions, and the overall extent of the rainforest is smaller than in the present day.
Conclusions
Figure 2: Potential vegetation model vegetation distributions from (A) present day and (B) LGM simulations.
soon onset dries the surface and decreases evaporation. The monsoon onset delay is primarily associated with cool conditions in the tropical Atlantic Ocean. Springtime inflow from the tropical Atlantic into the Amazon basin is much drier in the LGM simulation because of reduced evaporation from the cooler surface waters, so the latent heat content and, therefore, the moist static energy of the low-level air, is lower than in the present day in August, September, and October. In addition, moist static energy levels during the winter months of the LGM are lower than in the present day because land surface temperatures are colder. The result is a delay in the build-up of the low-level moist static energy in the spring, keeping the vertical column stable and inhibiting convection. When the monsoon finally begins in the LGM simulation, PAGES NEWS, VOL.14, N°2, AUGUST 2006
Simulations of South America during the LGM with a regional climate model coupled with a potential vegetation model produce a quantitative picture of LGM climate and vegetation distributions that is consistent with the geological proxy data. The model results associate drier conditions in LGM South America with a 2-3 month delay in the onset of the monsoon. Such a shorter, but equally intense, South American monsoon maintains a smaller Amazon rainforest through the glacial period, perhaps with modified species populations. At the same time, this scenario is consistent with evidence of higher charcoal amounts (i.e., increased fires) and atmospheric dust loading due to an extended dry season. REFERENCES
Cook, K. H., and Vizy E.K., 2006: South American climate during the Last Glacial Maximum: Delayed onset of the South American monsoon, J. Geophys. Res., 111: D02110, doi:10.1029/ 2005JD005980. Lenters, J. D., and Cook, K.H., 1995: Simulation and diagnosis of the regional South American precipitation climatology, J. Climate, 8: 2988-3005. Oyama, M. D., and Nobre, C.A., 2004: A simple potential vegetation model for coupling with the simple biosphere model (SiB). Revista Brasileira de Meteorologia, 19: 203-216. Paul, A. and Schäfer-Neth, C., 2003: Modeling the water masses of the Atlantic Ocean at the Last Glacial Maximum, Paleoceanography, 18(3), 1058 doi: 10.1029/2002PA000783. Vizy, E.K., and Cook, K.H., 2005: Evaluation of LGM SST reconstructions through their influence on South American climate. J. Geophys. Res., 110: D11105, doi:10.1029/2004JD005415.
Science Highlights: U.S. ESH Program Large lake drilling projects supported by U.S. National Science Foundation Earth Systems History Program SHERI FRITZ1, THOMAS JOHNSON2, PAUL BAKER3, STEVE COLMAN2, WALTER DEAN4 AND JOHN PECK5 University of Nebraska, Lincoln, USA; sfritz@unl.edu University of Minnesota, Duluth, USA; tcj@d.umn.edu; scolman@d.umn.edu 3 Duke University, Durham, USA; pbaker@duke.edu 4 U.S. Geological Survey, Denver, USA; dean@usgs.gov 5 University of Akron, USA; jpeck@uakron.edu 1 2
The U.S. National Science Foundation’s Earth Systems History (ESH) Program, in cooperation with the International Continental Drilling Program (ICDP) and the national science foundations of international collaborators, has funded the drilling of several lacustrine basins that contain key continental archives of climate and tectonic history, including Great Salt Lake and Bear Lake (USA 2000), Lake Titicaca (Bolivia/ Peru 2001), Hvitarvatn/Hestvatn/ Huakadalsvaten (Iceland 2003), Lake Bosumtwi (Ghana 2004), Lake Malawi (Malawi 2005), Qinghai (China 2005), and Lake Péten Itzá (Guatemala 2006). These lake drilling projects mark the onset of what could become a systematic acquisition of continuous high-resolution records of continental climate change extending through multiple glacialinterglacial cycles. The projects are generating multi-proxy records of past temperature and hydrological change that can be placed in the context of the rich climatic history derived from the highly successful ocean and ice drilling programs. The ultimate goal of the lake drilling programs is not to confirm the influence of large-scale boundary conditions on global climate, but rather to begin to delineate spatial and temporal deviations from the global mean on the continents where we live, providing important paleoclimate time series to test and improve our models and understanding of global climate dynamics. Below, we highlight science objectives and results to date from a few of these projects, many of which are still in the early stages of analysis.
Lake Titicaca drilling project
Paul Baker (Duke University, USA), Sheri Fritz (University of Nebraska, USA), Geoff Seltzer (Syracuse University, USA), Mark Bush (Florida Institute of Technology, USA).
Lake Titicaca (17°S, 69°W) is a high-
Figure 1: The GLAD800 raft on Lake Titicaca, Bolivia/Peru
elevation (3812 m) lake in the tropical Andes of Bolivia and Peru, and was drilled in April/May 2001 using the GLAD 800 drilling platform and coring system (Fig. 1). This site is critical for reconstructing both the timing of regional glaciations and the history of the South American summer monsoon system, and for evaluating how long-term variation in glaciation and effective moisture in the tropical Andes is affected by global-scale glacial boundary conditions, orbitally produced changes in seasonal insolation, and changes in tropical Pacific and/or Atlantic seasurface temperature. The longest recovered sequence spans 136 m and consists of alternations between two primary lithologic units, indicative of four major regional stages of glacial advance and retreat. Generally, the intervals of increased glaciation were periods when LakeTiticaca was deep and fresh (based on calcium carbonate concentrations, diatom stratigraphy, and δ13C isotopic measurements on bulk organic carbon), thus, regional glacial periods were times of high effective moisture and likely high precipitation. A chronology based on radiocarbon, U-series ages on aragonite laminae, and tuning to the Vostok CO2 record suggests that the drilled sequence extends over approx. the last 370,000 years. The most recent period of ice expansion in the cordillera surrounding the lake began approx. 60 14C ka BP following a major dry interval.The penultimate low stand of LakeTiticaca, rather than PAGES NEWS, VOL.14, N°2, AUGUST 2006
dating to the last summer solar minimum (~32 ka BP), is coincident with MIS5e, the penultimate interglacial stage (~125 ka BP).This suggests that the water balance of the lake is as strongly influenced by global-scale (and tropical) temperature changes and boundary conditions as by precession forcing of the South American summer monsoon.
Lake Bosumtwi drilling project
John Peck (University of Akron, USA), Christian Koeberl (University of Vienna, Austria), John King (University of Rhode Island, USA), Bernd Milkereit (University of Toronto, Canada), Jonathan Overpeck (University of Arizona, USA), Christopher Scholz (Syracuse University, USA).
Lake Bosumtwi (6°N, 1°W) occupies a 1.07 Ma impact crater located in Ghana, West Africa. Bosumtwi is one of only four craters with tektites and contains a thick (300 m) post-impact lacustrine sediment sequence. This hydrologically closed lake is located beneath the path of the seasonal migration of the ITCZ and is ideally situated to provide a long record of North African monsoon variability. In addition, the anoxic bottom water allows for the preservation of finely laminated sediments and the potential for high-resolution (annual) paleoclimate reconstruction. A combined sediment and rock-drilling program was undertaken in summer 2004. Using the GLAD800 lake drilling system, five sites were drilled along a water-depth transect, yielding a total sediment recovery of 1833 m. Drilling in the crater’s annular moat recovered 291 m of sediment. The lowermost lacustrine sediment overlying impact breccia and lapilli is a bioturbated carbonate mud with gastropod shells, indicating that a shallow-water oxic lake was established in the crater. Much of the overlying 291 m of mud is laminated. Initial study has identified two contrasting lithologies that delineate glacial/ interglacial variability and are read-
19
20
Science Highlights: U.S. ESH Program ily correlated to marine sedimentary records. Increased boreal summer insolation and the resulting intensified summer monsoon produce a positive moisture balance. Organicrich sediment with a low-coercivity magnetic mineralogy accumulated during these wet intervals. At times of decreased summer insolation and the accompanying weaker summer monsoon, lake levels fell and a mineral-rich sediment with lower organic content accumulated. During these dry periods, aerosol dust export from the Sahel increased greatly and contributed to a high-coercivity magnetic mineral assemblage. Ongoing sedimentary studies continue to address paleoclimatic questions regarding variability in the North African monsoon and teleconnections between high and low latitudes.
Bear Lake, Utah and Idaho
Darrell Kaufman (Northern Arizona University, USA), Walter Dean (U.S. Geological Survey, USA), Jordon Bright (Northern Arizona University, USA), and Joseph Rosenbaum (U.S. Geological Survey, USA).
A continuous 120-m-long core collected from Bear Lake, Utah and Idaho (41°N 111°W) in September 2000 contains evidence of hydrological and environmental change over the last two glacial-interglacial cycles (ca. 250,000 years). Chronological control is provided by 14C dates, paleomagnetic excursion, Useries age, and correlation of carbonate abundance and mineralogy with δ18O in Devils Hole calcite. Analyses completed at multi-centennial scale include rock-magnetic properties, O and C isotopes on bulk-sediment carbonate and ostracodes, organic- and inorganic-C contents, mineralogy (XRD), Sr isotopes on bulk carbonate, and pollen and diatom assemblages. Most of the core comprises massive to banded silty clay and marl, with variable carbonate content and Oisotopic values. The abundance of siliciclastic sediment indicates that Bear River was usually connected to Bear Lake. Calcite is the dominant carbonate mineral but three aragonitic marl intervals were deposited during the Holocene and the previous two interglacial intervals, equivalent to oxygen isotope stages (OIS) 5e and 7e. These intervals have high
tions with oxygenated bottom waters that apparently existed for extended times in the past. One of the surprising results to date was to find that much drier conditions existed prior to 75,000 years ago than during the Last Glacial Maximum.
Lake Qinghai drilling project Figure 2: The drilling barge Viphya on Lake Malawi
δ18O values (average = -5.8‰), indicative of strongly evaporitic conditions when the lake disconnected from the river and retracted into a topographically closed basin. The changing paleoenvironments inferred from these observations are generally consistent with other records of glacial-interglacial fluctuations in the western U.S., with an overprint of catchment-scale processes.
Lake Malawi drilling project
Christopher Scholz (Syracuse University, USA), Thomas Johnson (University of Minnesota Duluth, USA), Andrew Cohen (University of Arizona, USA), John King (University of Rhode Island, USA), Michael Talbot (University of Bergen, Norway).
Lake Malawi (10-14°S, 35°E), at the southern end of the East African Rift Valley, provides perhaps the best record of Southern Hemisphere tropical climate dynamics available in Africa.The lake is 580 km long, 35 km wide and 700 m deep, with wind and sea conditions that required a more substantial drilling platform than the GLAD 800, as well as dynamic positioning capability (Fig. 2). Two sites were drilled in February and March 2005: Site 1 in the central basin (water depth = 592 m) recovered sediment to 385 m below lake floor (blf), spanning the past 1.5 million years (preliminary chronology based on dated magnetic reversals and excursions supplemented with radiocarbon, OSL and Be-10 dates), and; Site 2 (361 m) in the northern basin of the lake was triple cored to a major unconformity at 38 m blf, recovering a record spanning the past 75,000 years. Two major sediment lithologies dominate the sequences: diatomaceous varved silty mud similar to what is accumulating in anoxic deep basins of the lake today, and bioturbated, ostracode-diatom calcareous silty clay, reflecting more arid condi-
PAGES NEWS, VOL.14, N°2, AUGUST 2006
Zhisheng An (Chinese Academy of Sciences, China), Steve Colman (University of Minnesota Duluth, USA), Gerald Haug (GeoForschungsZentrum Potsdam, Germany), Peter Molnar (University of Colorado, USA), and Takayoshi Kawai (Nagoya University, Japan).
Lake Qinghai (36°N, 10 0°E), in the People’s Republic of China is extremely sensitive to changes in climate because it lies in a critical transitional zone between the humid climate region to the southeast and the dry inland region of the Tibetan Plateau. Three major atmospheric circulation systems affect its climate: (i) the winter monsoon, induced by Siberian high pressure, (ii) tropical moisture from low latitudes, carried by the Asian summer monsoon, and (iii) the westerlies, with their teleconnection to the North Atlantic region. The lake basin occupies a closed tectonic depression, or piggy-back basin, on the upper plate of a major, active thrust fault. Seismic-reflection data show that the lake sediments are tectonically deformed in some parts of the basin and largely undeformed in other parts, where they are more than 700 m thick. Drilling operations in 2005 were conducted with the GLAD800 coring system, including its enlarged barge. In total, 324 core runs for 548 m of drilling acquired 323 m of core at an average recovery rate of 59%. The upper few tens of meters of sediment were mainly gray clay and silty clay, in which core recovery was excellent. The sediments below the clay-rich upper section were mainly fine-grained sand, in which penetration and recovery were poor. The principal investigators thus decided to postpone the planned 700-m drilling for a future campaign and to focus on obtaining high-quality, overlapping cores of the upper 30–50 m of relatively fine-grained sediment at several sites, in order to obtain a high-resolution record of most of the last glacial cycle.
Science Highlights: U.S. ESH Program Oak growth in Midwestern North America linked with post glacial climate epochs in the North Atlantic RICHARD P. GUYETTE1, MICHAEL C. STAMBAUGH1, ANTHONY LUPO1, ROSE-MARIE MUZIKA1 AND DANIEL C. DEY2 School of Natural Resources, University of Missouri, Columbia, USA; guyetter@missouri.edu North Central Research Station, U.S. Forest Service, Columbia, USA; ddey@fs.fed.us
1 2
Early Holocene tree-ring climate proxy development from sub-fossil oak wood (buried wood not mineralized) has been limited to Europe. Sub-fossil oak that has been collected from the rivers of Missouri and Iowa is abundant, well preserved, and has been determined to be at least 13.82 cal ka BP in age. This ancient oak wood represents riparian forest trees (Quercus bicolor Mich. and Quercus macrocarpa Mich.) that have been recruited into sediments by flooding and the erosion of stream banks. Large and heavy oak trees become buried rapidly by stream sediments and are then stored in the broad floodplains of these low-gradient streams for thousands of years. Although recruitment, reburial, excavation, and movement of wood is common, the relatively short length of these streams ensures that sampled oak is rarely, if ever, more than 50 km from where it originally grew, thus, spatially defining the climate region of origin. About 7 ancient oak trees (>500 yrs BP) are found per km of stream reach that have a sufficient number of rings (90 to over 280) for use in the construction of tree-ring chronologies. The 14C and tree-ring dating of the 230 oak trees collected to date indicate that the average tree grew about 2000 years ago. One of several ongoing projects utilizing ancient oak wood is the documentation of growth and climate during the last post glacial climate epoch, in what is now part of the mid-continental North American agricultural region. One of our goals is to link well-documented climate change in maritime environments with the continental climate of what are now important agricultural regions. For example, the Younger Dryas event has been documented in the North Atlantic and Europe as a period of time marked by abrupt climate change and cooling (Alley, 2000). Here, we provide tree-ring
Figure 1: Oak growth (BAI - basal area increment) in mid-continental North America (93°20’ W, 40°10’ N) during the glacial-Holocene transition. Mean annual BAI of individual oak trees shows significantly (probability p < 0.01) reduced growth and variance during the Younger Dryas (blue band). Dashed line: mean BAI before, during and after the Younger Dryas. Red arrows: hypothesized range in growth between tree populations limited by endogenous factors (competition) and exogenous factors (climate).
and isotopic evidence that growth and climate change were synchronous between the North Atlantic and mid-continental North American sites that lie 12,000 km to the southwest. Oaks that were dated between 9.5 and 14 cal ka BP using 14C and density dating (Guyette and Stambaugh, 2003) showed decreased growth (Fig. 1) and depleted δ13C (Fig. 2) coincident with North Atlantic climate proxies. The mean annual basal area increment (BAI; an area-based metric of tree stems) of oak trees was significantly (p <0.01) less (6.5 cm2/yr) during the Younger Dryas (Fig. 1) compared to growth during the rest of the post glacial climate period (11.2 cm2/yr). Mean maximum annual BAI (17.0 cm2/yr) was reduced by 54% during the Younger Dryas. Between-tree growth variance in BAI was about 75% less during the Younger Dryas than during the whole post glacial period (9.5-11.5 and 13-14 cal ka BP). A decrease in the variance of growth rates within a tree population would be expected if limits on growth switched from highly variPAGES NEWS, VOL.14, N°2, AUGUST 2006
able endogenous factors (forest competition) to regional exogenous factors (climate). Five-point moving averages of the mean ring width of the oak trees and temporally paired δ18O values (Fig. 2) from Greenland ice (GISP2) were correlated (r = 0.57) during the post glacial climate period. Whole tree mean ring width was significantly (p <0.01) reduced during the Younger Dryas compared to adjacent post glacial climates. In addition to growth evidence, the low abundance of oaks in the early part of the Younger Dryas suggests a climate that was limiting to oak reproduction. The longest temporal gap between sample dates in the 14,000-year-record occurs during the first part of the Younger Dryas ca. 12.48 to 12.99 cal ka BP, and coincides with gaps in the European record (Friedrich et al., 2004). This suggests unfavorable conditions may have existed for regeneration and growth of trees across both continents during the first half of the Younger Dryas. Values of δ 13 C (Fig. 2) in oak wood are found to be positively and significantly correlated (r = 0.74)
21
Science Highlights: U.S. ESH Program
22
in the North Atlantic (~4,500 km northeast of the study site). In addition, serial correlation among tree growth and isotope chronologies suggests that post glacial climate variations had marked effects on the growth rates of trees. The construction of tree-ring chronologies for the Younger Dryas will eventually provide an annual-resolution climate proxy for an under-represented continental region. NOTE Radiocarbon dates are on file at commercial laboratories (Beta Analytic Inc. Miami, FL) as well as the Missouri Tree Ring Laboratory (http://www.missouri.edu/~guyetter/) where the growth data is also stored. Future 14C dated ‘floating’ ring-width chronologies will be posted at International Tree-Ring Data Bank (http://www.ncdc.noaa.gov/paleo/treering.html). Figure 2: Stable isotope data for oak (δ13C) in mid-continental North America (93°20’ W, 40°10’ N) paired with δ18O from Greenland ice (GRIP and GISP2 data, Grootes et al., 1993). Paired values of δ13C and δ18O infer a climate link during the post glacial-Holocene transition between maritime climate of the North Atlantic and continental climate of Midwestern North America.
with temporally paired δ18O values (GRIP, GISP2) during the post glacial period. This association occurs despite the complexities of possible 13 C signals in tree rings (Loader et al., 2003). The termination of the Younger Dryas (about 11.5 cal ka BP) in mid-continental North America oak is marked by an expected and abrupt enrichment in the climatesensitive stable isotope δ13C. This abrupt termination is synchronous with dates of Younger Dryas termination based on pollen, ice core and tree-ring studies from marine and maritime regions of the North
Atlantic. Additionally, an increase in oak δ13C ca. 12.0 cal ka BP is coincident with intra Younger Dryas variability, as documented by δ18O from Greenland ice cores (Grootes et al., 1993). Increasing δ13C in oak during the post Younger Dryas transition to the Holocene is found to be consistent (r = 0.64) with changes in Greenland δ18O (GISP2). Our preliminary results indicate that despite the low resolution of our data, climate change during the glacial-Holocene transition in midcontinental North America was approximately synchronous with that
REFERENCES
Alley, R.B., 2000: The Younger Dryas cold interval as viewed from central Greenland. Quaternary Science Reviews, 19: 213-226. Guyette, R.P., and Stambaugh, M.C., 2003: The age and density of ancient and modern oak wood in streams and sediments. IAWA, 24: 345-353. Loader, N.J., Roberston, I., and McCarroll, D., 2003: Comparison of stable carbon isotope ratios in the whole wood, cellulose, and lignin of oak tree-rings. Palaeogeography, Palaeoclimatology, Palaeoecology, 196: 395-407. Grootes, P.M., Stuiver, M., White, J.W.C., Johnsen, S., and Jouzel, J., 1993: Comparison of oxygen isotope records from the GISP2 and GRIP Greenland ice cores. Nature, 366: 552-554. Friedrich, M., Lucke, A., Schwalb, A., and Hansich, S., 2004: Late glacial environmental and climatic changes from synchronized terrestrial archives of Central Europe: The Network PROSIMUL. PAGES News, 12(2): 27-29.
Consolidating high- and low-resolution information from different sources into a Northern Hemisphere climate reconstruction SHAOPENG HUANG Department of Geological Sciences, University of Michigan, Ann Arbor, USA; shaopeng@umich.edu
Our understanding of climate history in the pre-industrial era relies principally on climate proxies, each of which has strengths and limitations in representing past climate variability. A paleoclimate reconstruction from borehole temperature data has its foundation in the theory of thermal diffusion and, as such, is characterized by a progressive inability to resolve climatic excur-
sions in the more remote past. But the compensation for the loss of resolution is a better determination of the mean surface temperature in the interval of time for which the details cannot be resolved. Conversely, reconstructions from many traditional proxy approaches offer higher temporal resolution of relative changes but with greater uncertainties in the long-term trends.
PAGES NEWS, VOL.14, N°2, AUGUST 2006
It would be desirable to develop a technique to integrate complementary high- and low-resolution climate information preserved in different data sources for a more complete picture of the past climate change. Huang (2004) attempted such an integrated reconstruction of the Northern Hemisphere surface temperature history over the past five centuries through an integrated analysis of the global da-
Science Highlights: U.S. ESH Program
Figure 1: A) Extended surface temperature history combining the 1900-1980 surface air temperature (SAT) record (blue) and the 5°×5° area weighted average of the borehole-based reconstruction over the 16th-19th century period (red). The SAT trend and the boreholebased estimate of the 20th century trend are used for extension (dashed lines). B) Subsurface temperature anomaly corresponding to the extended surface temperature history.
tabase of borehole temperatures, the annually resolved multi-proxy reconstruction of Mann et al. (1999), and the 20th century meteorological record.
Methods and data The integrated reconstruction involves several steps: reconstructing century-long trends from hundreds of borehole temperature profiles, extending the surface air temperature (SAT) record with the boreholebased reconstruction, determining a subsurface temperature anomaly with the extended temperature record, and inverting the subsurface anomaly with the Mann et al. (1999) reconstruction as the a priori model. With support from the international heat-flow community, a global database of borehole temperature logs has been constructed as an archive of geothermal signals of climate change. At the time of this study, the database contained 862 borehole temperature profiles,
of which 697 were located in the Northern Hemisphere. A standardized borehole data inversion technique independent of any other proxy or meteorological records is employed for the reconstruction of century-long trends (Huang et al., 2000) from each of the 697 Northern Hemisphere borehole data sets. The individual borehole-based reconstructions are then aggregated for a hemispheric representation. From a Northern Hemisphere perspective, the 697 boreholes suggest a cumulative change of about 1°C over the past five centuries, with an accelerated warming trend towards the present day (Fig. 1a). With approx. 50% more data, this new borehole-based reconstruction is consistent with that derived earlier from a smaller data set of 453 boreholes employed by Huang et al. (2000). The independent boreholebased estimate of 20th century warming is remarkably consistent with the meteorological record (Jones et al., 1999). Given that the 20th century meteorological record is the most reliable climate record, Huang (2004) extends the SAT record with the 5°×5° area weighted 16th-19th century-long trends derived from the 697 boreholes. This borehole-extended five-century surface temperature history is then
used to calculate a representative Northern Hemisphere subsurface signal (Fig. 1b), with the temperature at year 1500 taken as the initial steady state. The last step of the integrated analysis is to bring into a coherent reconstruction process the subsurface temperature signal and the annually resolved multi-proxy model of Mann et al. (1999). Such an integrated reconstruction is accomplished through a functional space Bayesian inversion, which allows for explicit incorporation of an a priori model, i.e., a hypothesis of the climate history under examination. For the integrated reconstruction of Northern Hemisphere surface temperature history over the past five centuries, the temporal domain is parameterized at an annual interval to enable the incorporation of the Mann et al. (1999) reconstruction as the a priori model.
Results The integrated reconstruction (Fig. 2b) shows that the late 16th century to the early 17th century was the coldest, and the 20th century the warmest, over the past five centuries. Despite some fluctuations at annual to decadal scales, the general trend over the past five centuries is a progressive warming. The integrated reconstruction suggests that the 20th century warming is a
Figure 2: Comparison of the reconstructed surface temperature anomaly (red) versus radiative forcing (blue) before (A) and after (B) the integrated reconstruction (Huang, 2004). The radiative forcing series shown by the thin curve comprises the effects of solar irradiance, anthropogenic aerosols, greenhouse gases, and volcanism; the thick curve shows volcanism excluded. Both radiative forcing series are based on Crowley (2000). Surface temperature anomaly is shown with reference to the 1961-1980 mean. Radiative forcing is relative to the 1961-1980 mean of the forcing series with volcanism excluded.
PAGES NEWS, VOL.14, N°2, AUGUST 2006
23
Science Highlights: U.S. ESH Program
24
continuation of a long-term warming. However, the warming appears to have been accelerated towards the present day. Integration of the complementary information greatly improves the comparability of the reconstructed temperatures and the Crowley (2000) radiative forcing history (Fig. 2). Analysis of the reconstructed temperature and radiative forcing series offers an independent estimate of the transient climate-forcing response rate of 0.4 - 0.7 K per Wm-2 and predicts a temperature increase of 1.0-1.7 K in 50 years (Huang, 2004).
Discussion It is worth pointing out that the integrated reconstruction is not a simple superposition of the high frequencies of the multi-proxy reconstruction on the lower frequencies of the borehole reconstruction. The integrated reconstruction consolidates information given in the subsurface temperature data and in
the a priori model. For the 20th century, where the a priori multi-proxy model is well trained by the meteorological record, little alternation is made through the inversion. At very long periods, the subsurface temperature data provide information that is weak or absent in the multi-proxy reconstruction. At intermediate periods both the a priori model and subsurface data provide important constraints. The improvement in the comparability between climate reconstruction and the radiative forcing series is a validation of the climate information integration strategy. The good agreement between the integrated reconstruction and the forcing model confirms that there are both natural and anthropogenic factors influencing the recent warming. ACKNOWLEDGEMENTS Support for this study comes from NSF Grant ATM-0317572. The author thanks Henry Pollack and Po-Yu Shen for stimulating discussions. The global database of
borehole temperatures is hosted by the University of Michigan (www.geo.lsa. umich.edu/climate) and accessible at World Data Center-A for Paleoclimatology Data (www.ncdc.noaa.gov/paleo/borehole).
NOTE The time series of this integrated reconstruction can be downloaded from www. ncdc.noaa.gov/paleo/pubs/huang2004.
REFERENCES
Crowley T.J., 2000: Causes of climate change over the past 1000 years. Science, 289: 270-277. Huang, S., Pollack, H. N., and Shen, P.Y., 2000: Temperature trends over the past five centuries reconstructed from borehole temperatures. Nature, 403: 756-758. Huang, S., 2004: Merging Information from Different Resources for New Insights into Climate Change in the Past and Future. Geophys. Res, Lett., 31: L13205, doi:10.1029/2004GL019781. Jones, P.D., New, M., Parker, D.E., Martin, S., Rigor, I.G., 1999: Surface air temperature and its changes over the past 150 years. Rev. Geophys., 37:173199. Mann, M.E., Bradley, R.S., Hughes, M.K., 1999: Northern hemisphere temperatures during the past millennium: inferences, uncertainties, and limitations. Geophys. Res. Lett., 26:759-762. For full references please consult: www.pages-igbp.org/products/newsletters/ref2006_2.html
Can models of abrupt climate change be tested from sea level reconstructions? CHARLES JACKSON1, YURUN LIU2 AND OLIVIER MARCHAL3 Institute for Geophysics, University of Texas at Austin, USA; charles@ig.utexas.edu Department of Physics, University of Texas at Austin, USA 3 Woods Hole Oceanographic Institution, USA 1 2
Introduction As hypotheses concerning the origin of abrupt climate change accumulate, there is an increasing need to synthesize data and to develop methods that may help assess their strengths and inconsistencies. Understanding the mechanisms of abrupt climate change is particularly challenging because of the uncertainties in paleoclimate observations and in our knowledge of the physics of the climate system. Among the techniques that can be used to piece together the common elements of noisy observations given knowledge of a system’s physics are so-called “inverse methods”. In particular, stochastic inverse modeling provides a way to navigate the uncertainties in data and models, and deal with the possibility of multiple solutions
(inferences). Most notably, it can re-express the problem of abrupt climate change in terms of its implications for what we should see in observations if models provide adequate representation of the processes that exist in nature. Here, we demonstrate the potential of this approach (i) by estimating the changes in global sea level implied by the combination of a Greenland ice core paleotemperature record during the last glacial period, with a highly simplified model of the buoyancy-driven ocean circulation, and (ii) by comparing these changes to reconstructions of global sea level during this period. The comparison provides a test of the consistency between the various datasets and a test of the hypothesis of a freshwater forcing of abrupt climate change. PAGES NEWS, VOL.14, N°2, AUGUST 2006
Freshwater forcing hypothesis The freshwater forcing hypothesis to explain abrupt climate change involves changes in the freshwater supply to the North Atlantic Ocean through instabilities of the large continental ice sheets that covered the high northern latitudes during the last glacial period. A key part of this hypothesis is the capability of the ocean meridional circulation and of the attendant poleward heat flux to suddenly switch state and hold the climate system in a new state for hundreds to thousands of years. This possibility is suggested by a hierarchy of ocean models that exhibit multiple equilibria of the meridional circulation and that demonstrate the potential of surface freshwater forcing to initiate transitions between the equilibria. Thus, a hysteresis exists within
Science Highlights: U.S. ESH Program
20
15
10 5
0 −5
−10 −15
(c)
-0.4
-0.2
0
0.2
0.4
0.6
0.8
1
1.2
Fresh water forcing to North Atlantic [10 6 m3 sec-1 ]
Fresh Water Forcing Times Series
0.2
0
−0.4 0 1000 (~39000 ka)
2000
3000
4000
5000
6000
Time [years]
7000
8000 9000 (~30000 ka)
(d)
4
10
Greenland Temperature Anomaly
3
1
0
−1
−2
−3
2000
3000
0
−5
−10
−15
−20
−25 coral data (Thompson and Goldstein, in press) deep sea oxygen isotopes (Waelbroeck et al., 2002)
−30
Observations
−5 0 1000 (~39000 ka)
Relative Sea Level Anomaly
5
2
−4
0.4
−0.2
Constant mixing energy Stability dependent diffusivity Constant mixing diffusivity
−20 −25
Temperature Anomaly [degrees]
(b) Northern Box Sinking Strength vs Northern Fresh Water Forcing
Fresh Water Forcing [ 10 6 m3 s−1]
25
Sea level anomaly [meters]
Circulation Strength [10 6 m3 s-1]
(a)
4000
5000
6000
Time [years]
7000
8000
9000
(~30000 ka)
−35
0
1000 2000 3000 4000 5000 6000 7000 8000 9000
(~39000 ka)
Time [years]
(~30000 ka)
Figure 1: Inverse modeling of abrupt climate change: A) equilibrium sensitivity of three models to freshwater forcing of the North Atlantic, B) freshwater forcing history required to match Greenland data, C) model reconstructions of Greenland data, and D) effect of freshwater forcing on sea level as compared to observations with estimates of uncertainty.
these models, such that multiple circulation strengths occur for the same rate of freshwater supply to the high latitudes. The freshwater hypothesis is apparently supported by the observation of ice rafted debris in North Atlantic sediments during the cold phases of abrupt climate change. Records of global sea level, which provide an integrated measure of the freshwater forcing history, would provide another test for this hypothesis.
Uncertain physics Among the major uncertainties in numerical models of the ocean circulation is the representation of sub-grid scale phenomena. The most common assumption is that the transport of properties such as momentum, heat, and salt at small scales acts as a diffusion of these variables at large scales that is effectively resolved by the models. Most notably, the issue of the representation of small-scale vertical mixing is gaining a lot of attention,
following a claim that this mixing may actually force the meridional circulation and its attendant heat flux (Munk and Wunsch, 1998). According to a scaling theory of the oceanic thermocline based on various approximations in the equations of motion, different assumptions about vertical mixing leads to a qualitatively different response of the meridional circulation to the surface freshwater forcing (Fig. 1a). The assumptions considered are representative of the range of what is physically justifiable, including mixing represented with constant vertical diffusivity, stability-dependent diffusivity, and fixed mixing energy. The solutions are generated from a 4-box model of the global meridional circulation, thereby extending the single-hemisphere model study of Nilsson and Walin (2001).
Bayesian stochastic inversion For each of the three mixing representations, we use a method of PAGES NEWS, VOL.14, N°2, AUGUST 2006
“Bayesian Stochastic Inversion” (Jackson et al., 2004) to estimate the time evolution of freshwater forcing (Fig. 1b) that permits each model to reproduce the Greenland ice core record between 39-30 ka BP (Fig. 1c). The method works by randomly guessing the freshwater forcing for 81 evenly spaced points along the 9 kyr interval and using information about the effects of this guess on model-data mismatch to guide subsequent forcing histories. This process is repeated multiple times and the statistics of the results are collected. Thus, solutions may be represented by a multi-dimensional probability distribution indicating the relative likelihood, the uncertainties, and the dependencies of the different quantities that are inferred from the original data. Illustrated in Figure 1b-c are the optimal (most likely) solutions that provide the minimum mismatch between the data and the model.
25
Science Highlights: U.S. ESH Program
26
Inversion results and implications The global sea level variations implied by the freshwater forcing histories for the three different mixing formulations are nearly identical; each showing a drop of ~15 m during the prolonged ~3 kyr warm phase starting around 38 ka BP or model year 1000. The subsequent sequence of warm-cold phases (between 35-30 ka BP) is associated with ~5 m variations in sea level. The timing and amplitude of these sea level variations are not inconsistent with two independent reconstructions, given their uncertainties (Thompson and Goldstein, in press; Waelbroeck et al., 2002). Although the relatively large uncertainties preclude a solid conclusion, the comparison illustrates the level of accuracy that is necessary for a more stringent test of the freshwater hypothesis from the sea level record. Furthermore, these results highlight the potential importance of ice sheet growth in maintaining a negative high latitude freshwater balance for the phases of sustained warmth, with the length of the warm
phases being directly related to the amplitude of the sea level fall. The striking similarities among the three mixing formulations may be surprising considering the very different steady state response of each model to freshwater forcing (Fig. 1a). We find that the processes governing the model’s transient response to freshwater forcing to be initially very similar and only begin to diverge after a few hundred years. In all cases, the imposition of a high latitude freshening reduces meridional density gradients and, hence, the strength of the meridional circulation with changes in vertical mixing lagging. A more thorough examination of the causes of this similarity is being investigated.
Conclusion This stochastic inverse model exercise suggests that the freshwater forcing hypothesis of abrupt climate change is consistent with the most direct estimates of past sea level, assuming that (i) our interpretation of the Greenland record in terms
of temperature changes in the high northern latitudes is correct, and (ii) the highly simplified model we have used captures the relevant physics. This consistency does not depend on the formulation of vertical mixing in the model. Whether more complete models are sensitive to the formulation of vertical mixing in their transient response to high latitude freshening warrants further investigation. REFERENCES
Jackson, C., M. Sen, and Stoffa, P., 2004: An Efficient Stochastic Bayesian Approach to Optimal Parameter and Uncertainty Estimation for Climate Model Predictions, Journal of Climate, 17(14), 2828-2841. Munk, W., and Wunsch, C., 1998: Abyssal recipes II: Energetics of tidal and wind mixing, Deep Sea Research Part I: Oceanographic Research Papers, 45(12), 1977-2010. Nilsson, J., and Walin, G., 2001: Freshwater forcing as a booster of thermohaline circulation. Tellus, 53A, 629-641. Thompson, W. G. and Goldstein, S.L., in press: A radiometric calibration of the SPECMAP timescale, Quaternary Science Reviews. Waelbroeck, C., Labeyrie, L., Michel, E., Duplessy, J.C., McManus, J.F., Lambeck, K., Balbon, E., and Labracherie M., 2002: Sea-level and deep water temperature changes derived from benthic foraminifera isotopic records, Quaternary Science Reviews, 21(1-3), 295-305.
Late Holocene hydrological variability in ombrotrophic peatlands of eastern North America STEPHEN T. JACKSON1, ROBERT K. BOOTH2, YONGSONG HUANG3, ELISE G. PENDALL1, JONATHAN E. NICHOLS3, THOMAS A. MINCKLEY1 AND MEGHAN TAYLOR1 Department of Botany, University of Wyoming, Laramie, USA; jackson@uwyo.edu Department of Earth and Environmental Sciences, Lehigh University, Bethlehem, USA 3 Department of Geological Sciences, Brown University, Providence, USA 1 2
Introduction Ombrotrophic peatlands, particularly “raised bogs”, comprise a rich but underutilized source of Holocene paleoenvironmental records for North America. These peatlands, which are scattered from the Atlantic to the Pacific coasts at latitudes between 42° and 65°N, are dominated by Sphagnum moss and a few vascular plants, have elevated surfaces, and receive all surface moisture directly from the atmosphere. Water tables of these bogs are perched above the groundwater table, and most water loss is through evapotranspiration. Accordingly, ombrotrophic bogs are hydrologically sensitive to precipi-
tation and temperature variations across a range of temporal scales, from seasonal to millennial. Sedimentary records from ombrotrophic peats can span 1000-10,000 years, with temporal resolution ranging from sub-centennial to sub-decadal depending on accumulation rates. A variety of paleoenvironmental proxies, including testate-amoebae, peat humification, pollen, plant macrofossils, charcoal, stable isotopes (H, C, O), and biomolecular markers, are preserved in these peats. We are conducting a study of all of these proxies in late Holocene peats from raised bogs along a transect spanning the Great Lakes/ PAGES NEWS, VOL.14, N°2, AUGUST 2006
St. Lawrence corridor, from Minnesota to Maine. We are coupling these paleoclimate reconstructions with extensive modern calibration studies and investigations of historical climate variability. These studies are leading to detailed multivariate climatic reconstructions and development and testing of hypotheses regarding the underlying climate dynamics.
Peatland records of drought synchrony in the Central United States Peat records from sites 1000 km apart in north-central Minnesota (Hole Bog) and southeastern Michigan (Minden Bog) span the past
Science Highlights: U.S. ESH Program �� �����
Figure 1. Paleohydrological records from ombrotrophic peatlands 1000 km apart in southeastern Michigan and north-central Minnesota show spatial coherence over the past 2000 years. Highfrequency patterns between 600-1000 years ago show good correspondence with tree-ring records from the Great Plains and Rocky Mountains to the West. The blue trace represents the Minnesota record and the red trace the Michigan record, both expressed in terms of depth to water table based on multivariate analysis of testate-amoeba assemblages (see Booth & Jackson, 2003 for details). Modified from Booth et al. (2006).
several thousand years (Fig. 1). Water-table depths inferred from testate-amoeba assemblages reveal substantial hydrological variability at decadal to sub-millennial scales, with much of this variability coherent between the two sites. Coherent fluctuations are particularly evident during time periods of high-magnitude moisture fluctuations, suggesting that large moisture fluctuations are often widespread—an observation consistent with documented patterns of widespread drought during the past century (McCabe et al., 2004; Booth et al., 2006). The western Great Lakes region is susceptible to multi-year droughts centered in the Great Plains (e.g., the 1930s droughts penetrated eastward into the region). The high-frequency paleohydrological patterns in our bog records indicate that prehistoric multi-year to multi-decadal droughts of the Great Plains were felt at least as far east as Michigan. The Michigan and Minnesota peatlands both record severe, multidecadal droughts centered on 700, 800, and 1000 yr BP (Fig. 1), corresponding to Medieval Warm
Period droughts recorded in treering chronologies from the western United States (Cook et al., 2004). The occurrence of these drought events as far east as eastern Michigan suggests that North Atlantic sea-surface temperatures played a major role in modulating effects of SST variability in the tropical Pacific (e.g., McCabe et al., 2004). The Minnesota and Michigan bog records also show synchronous drought events at 1850, 1800, and 1650 yr BP, during a low-frequency transition from dry to wet conditions. Few other high-resolution records (e.g., tree-rings) are available to corroborate these findings but the synchroneity across 1000 km suggests these were regional-scale events. Hydrological variability was dampened during the wet period between 1600-1100 yr BP, and spatial coherence diminished (Fig. 1). In fact, the sites become modestly antiphased at the height of the wet period. Similar antiphasing occured between these regions during times of low variability in the last century’s instrumental record (Booth et al., 2006).
PAGES NEWS, VOL.14, N°2, AUGUST 2006
Emerging proxies: Molecular biomarkers and compoundspecific stable isotopes We are currently developing and applying other proxies from ombrotrophic peatlands of mid-continental and eastern North America. One new approach is the use of molecular biomarkers. For example, Sphagnum differs from vascular plants and terrestrial mosses in the frequency distribution of n-alkane chain-lengths (Nichols et al., in press); because water retention is less critical for Sphagnum, cuticle waxes tend to be constructed of shorter (and presumably more economical) alkane chains. Ecological and paleoecological studies (based on plant macrofossils) indicate that Sphagnum moss tends to be especially productive during extended wet periods, while droughts favor expansion of ericads, sedges, and other vascular plants. Stratigraphic records of n-alkane distributions from Minden Bog generally correspond to patterns inferred from testate amoebae and humification (Fig. 2). However, humification and n-alkane spectra show an apparent dry anomaly ca. 1300 yr BP that is unrecorded by the testate amoebae. This underscores the need for multiple proxies that record different kinds of hydrological responses to different aspects of climate variation. Another promising avenue is the identification and extraction of organic compounds specific to Sphagnum. Preliminary results indicate that 2-heptacosanone can be extracted from at least seven different species of Sphagnum but not from any vascular plants or other mosses found in peatlands. Such Sphagnum-specific biomarkers can be used not only as an index for quantifying Sphagnum productivity but also for compound-specific analysis of δD and δ13C, which can provide further information on moisture balance and temperature. Sphagnum macrofossils are well preserved in all but the most humified peats. Analysis of compound-specific and taxon-specific δ18O (from cellulose in Sphagnum)
27
Science Highlights: U.S. ESH Program
28
can provide information on moisture balance. δ18O from modern Sphagnum plants is correlated with that of bog waters and with water-table depth. Ongoing analyses of δ18O from Sphagnum macrofossils will provide an additional proxy. Downcore analyses of compound-specific and taxon-specific δD, δ18O, and δ13C should allow us to tease apart moisture-balance, temperature, and humidity signals in the bog records (e.g., Pendall et al., 2001).
Pollen liberation: Assessing vegetational responses to climate change Pollen assemblages have traditionally been the primary paleoclimatological tool for continental regions at timespans longer than the past few centuries. Development of independent paleoclimate records from testate amoebae, stable isotopes, and biomarkers preserved in peatlands and other archives now allows us to use pollen data to assess vegetational responses to climate change and variability. The Minden record, for instance, demonstrates that a regional shift from beech to white pine dominance 800-1000 years ago, and an accompanying increase in fire incidence was driven by the onset of drier conditions (Booth and Jackson, 2003). This vegetational transition had been controversial, ascribed variously to decreasing temperatures or activities of indigenous peoples. We are currently developing high-resolution pollen records for selected time intervals to assess regional vegetational responses to transient climate events, and to gauge the limits of pollen sensitivity to climate change.
Outlook Our ultimate goal is to develop a multiproxy, synoptic-scale network of paleohydrological and paleoecological records from ombrotrophic peatlands. Eventually, this network could stretch from coast to coast, and from ca. 45°-60°N in North America. With such a network, Holocene climate variability can
Figure 2. Different proxies from the Minden Bog (MI) record show general correspondence, with some potentially revealing contrasts. Water-table depth inferred from testate-amoeba assemblages and peat humification measured colorimetrically represent two conventional approaches to peatland sediments (see Booth and Jackson, 2003). Different expressions of n-alkane ratios from the sediments represent indices of relative biomass of Sphagnum and other plants. In all five panels, moisture increases along the y-axis. Negative exponential smoothing has been applied to each record to emphasize broad scale correlation. Modified from Nichols, et al. (in press).
be assessed at timescales ranging from multi-decadal to millennial. Spatiotemporal patterns of variability within the network, and between bog records and other archives (tree-ring, lake-level, aeolian, glacial) should provide a basis for assessing mechanisms governing climate change and variability. Bog-based records of climate change can also be utilized to identify climate drivers of forest and fire dynamics, inferred from pollen, macrofossil and charcoal data. European scientists are currently developing a network of bog records across Eurasia. Thus, the potential exists for a circumboreal paleoclimate network for the entire Northern Hemisphere, based on multiple proxies from peatland archives. Such a network could generate significant advances in understanding the patterns and mechanisms of Holocene climate evolution. NOTE Data used in this study will be available in the NOAA Paleoclimatology data base at: www.ncdc.noaa.gov/paleo/paleo.html For detailled information, contact the authors.
PAGES NEWS, VOL.14, N°2, AUGUST 2006
REFERENCES
Booth, R.K., and Jackson, S.T., 2003: A high-resolution record of Late Holocene moisture variability from a Michigan raised bog. The Holocene, 13:865-878. Booth, R.K., Notaro, M., Jackson, S.T., and Kutzbach, J.E., 2006: Widespread drought episodes in the western Great Lakes region during the past 2000 years: geographic extent and potential mechanisms. Earth and Planetary Science Letters, 242:415-427. Cook, E.R., Woodhouse, C., Meko, D.M., and Stahle, D.W., 2004: Long-term aridity changes in the western United States. Science, 306:1015-1018. McCabe, G.J., Palecki, M., and Betancourt, J.L., 2004: Pacific and Atlantic Ocean influences on multidecadal drought frequency in the United States. Proceedings of the National Academy of Sciences, 101:4136-4141. Nichols, J.E., Booth, R.K., Jackson, S.T., Pendall, E.G., and Huang, Y., in press: Paleohydrologic reconstruction based on n-alkane distributions in ombrotrophic peat. Organic Geochemistry. Pendall, E., Markgraf, V., White, J.W.C., Dreier, M., and Kenny, R., 2001: Multiproxy record of late Pleistocene-Holocene climate and vegetation changes from a peat bog in Patagonia. Quaternary Research, 55: 168-178.
Science Highlights: Open Section San Valentin glacier ice core (Chilean Patagonia) – Filling the gap between Central Andes and Antarctica PATRICK GINOT1, FRANÇOISE VIMEUX2, MARTINE DE ANGELIS1 AND OLIVIER MAGAND1 Laboratoire de Glaciologie et Géophysique de l’Environnement, St Martin d’Hères, France; ginot@lgge.obs.ujf-grenoble.fr IRD Great Ice, Laboratoire des Sciences du Climat et de l’Environnement, Gif-sur-Yvette, France: vimeux@lsce.saclay.cea.fr
1 2
Introduction For the last 30 years, ice core investigations along the Andes have been mainly focused in the Central Andes, between the equator and 30°S. Major paleoclimate reconstructions covering the last 25,000 years were obtained from Quelccaya, Huascaran, Sajama (Thompson, et al., 1998), Illimani (Ramirez, et al., 2003) and Cerro Tapado (Ginot, et al., 2006). South of 60°S, from the Antarctic Peninsula to the South Pole, the international ice core community is investigating numerous and widespread paleoclimate records, providing longer timescales. In order to understand the connection between tropical areas and high latitudes, we have set up a new ice core deep drilling program in the Chilean/Argentinean Patagonia, at 47°S, on San Valentin and San Lorenzo summit glaciers (see project description).
San Valentin ice core drilling project A first 16-m-long shallow ice core was extracted in March 2005 from San Valentin glacier (Fig. 1) where radar sounding indicates a glacier thickness of about 170 m (G. Casassa, pers. com.). The firn temperature measured at 16 m depth is -12°C, confirming the excellent paleoclimate signal preservation at this high altitude site. The ice core stratigraphy reveals no surface melting/refreezing ice layer. No ash or dust layer has been observed. The ice has been analyzed for ionic contents, water stable isotopes (δD and δ18O) and some radio-nuclides. 210 Pb decay and 137Cs peaks indicate a time range of about 1965 to 2005, which corresponds to a mean annual accumulation rate of about 33 cm of snow per year (180 mm water equivalent). The chemical concentrations measured along the profile are extremely low, comparable to polar levels (Fig. 2). Their main
Figure 1: Top: South American map showing the location of San Valentin and San Lorenzo. Bottom: San Valentin summit glacier (photo taken from plane) showing the location of the March 2005 shallow ice core drilling site.
feature illustrates that the chemical profile is well preserved from water percolation alteration. The seasonal variations of some chemical concentrations (e.g. nss-Ca2+) allow annual layer counting, in agreement with the radio-nuclide dating. Some specific events are recorded: (i) Oceanic aerosol deposition, marked by sea salt peaks associated with biogenic sulfate and MSA (Methanesulfonate), were found at several depth levels (e.g. surface, 3.8 m, 7.6 m); the Cl-/Na+ ratio profile, generally close to the oceanic sea salt ratio, indicates rapid aerosol transport; (ii) Biomass burning events characterized by high nitrate concentrations associated with nssSulfate and/or nss-chloride increase were observed. The strongest event is located at 11.1 m. These two different types of events may be related to the two main atmospheric circulation regimes: westerlies (oceanic input) or atmospheric transport from Argentinean Patagonia (fire PAGES NEWS, VOL.14, N°2, AUGUST 2006
plumes). Further investigations are needed to deconvoluate the sulfur signal, and so, to locate the main volcanic eruptions over this time period (e.g. Cerro Hudson 1991). The water stable isotope content (δD, δ18O) of the ice was measured with a twice-lower sampling resolution, which does not allow us to clearly distinguish the seasonal variations (Fig. 2). However, the dry/wet season alternation, as revealed by the aerosol profiles, matches the narrow peaks in the isotopic profile. Moreover, the isotope profile exhibits an interesting interannual signal that should be further discussed. Deuterium excess has also been calculated (not shown). The δD/δ18O slope is 8.64, confirming that no melting at the surface occurs. Deuterium excess exhibits a large range from about 4 to 18‰, strongly suggesting large fluctuations in airmass origins and trajectories. This is in agreement with what has been inferred from chemical profiles. The promising results from this preliminary study have lead us to plan deeper drilling operations in this area in April/May 2007. An ice
Project facts: The Sanvallor project deals with two deep ice cores at San Valentin glacier (Chile, 3747 m, 46°35’19”S, 73°19’39”W) and San Lorenzo glacier (Chile/Argentina, ~3500 m, ~47°32’S, 72°20’W). It started in 2005, with the preliminary study on the shallow core, and should run until 2009. The preliminary study was funded by IRD-Great Ice, LSCE, LGGE and CECS Valdivia (Centro de Estudios Cientificos). The first deep drilling operations attempt was funded by the Chilean Fondecyt and IRD. A proposal has been submitted to fund the analyses.
29
Science Highlights: Open Section
30
core will be recovered down to the bedrock by IRD Great Ice and its partners on the San Valentin site, and some preliminary investigations performed on the San Lorenzo glacier, about 50 km farther southeast. Ice thickness and estimated accumulation rate on San Valentin allow us to expect paleoclimate reconstructions at high resolution over, at least, the last 2000 years. The deepest part of the ice cores might include the Last Glacial Maximum. Ice will be dispatched to all the participating laboratories. The ice core diameter will permit us to provide enough material to establish all the profiles with the required resolution. REFERENCES
Ginot, P., Kull, Ch., Schotterer, U., Schwikowski, M. and Gäggeler, H.W., 2006: Glacier masse balance reconstruction by sublimation induced enrichment of chemical species on Cerro Tapado (Chilean Andes), Climate of the Past, 2: 21-30. Ramirez, E., Hoffmann, G., Taupin, J.D., Francou, B., Ribstein, P., Caillon, N., Ferron, F.A., Landais, A., Petit, J.R., Pouyaud, B., Schotterer, U., Simões, J.C. and Stievenard, M., 2003: A new Andean deep ice core from Nevado Illimani (6350 m), Bolivia, Earth and Planetary Science Letters, 212: 337-350. Thompson, L. G. Davis, M.E., Mosley-Thompson, E., Sowers, T.A., Henderson, K.A., Zagorodnov, V.S., Lin, P-N, Mikhalenko, V.N., Campen, R.K., Bolzan, J.F., Cole-Dai, J. and Francou, B., 1998: A 25000year tropical climate history from Bolivian ice cores, Science, 282: 1858-1864. Figure 2: Selected chemical concentration (µEq.L-1), ratio and δD (‰ versus SMOW) profiles measured along the San Valentin 16-m-long shallow ice core extracted in March 2005.
Sediment, pollen and isotope evidence for an Early to Mid-Holocene humid period in the desert of Yemen ANNE-MARIE LÉZINE1, CHRISTIAN ROBERT2, JEAN-FRANÇOIS SALIÈGE3 AND JEAN-JACQUES TIERCELIN4 Laboratoire des Sciences du Climat et de l’Environnement, UMR 1572 CNRS-CEA, Gif-sur-Yvette, France; anne-marie.lezine@cea.fr CEREGE, Aix-en-Provence, France; robert@cegere.fr 3 Laboratoire d’Océanographie et du Climat, UMR 7159 CNRS-IRD-UPMC, Paris, France; Jean-Francois.Saliege@lodyc.jussieu.fr 4 IUEM, UMR 6538 CNRS-UBO, Plouzané, France; jjtierc@univ-brest.fr 1 2
Introduction Environmental reconstructions of tropical deserts during the Holocene have mainly focused on Northern Africa. There, numerous lake-level and pollen data have been extensively used for regional reconstruction of past hydrological or vegetation changes, as well as for paleoclimatic models connecting environmental changes with variations in the Earth’s orbit or in-
vestigating atmosphere-vegetation feedback in the climate system. By contrast, very little is known about the environmental and climate history of Arabia, even though recent discoveries of speleothems in Oman (Fleitmann et al., 2003) have yielded high-resolution oxygen isotope records reflecting variations in the Indian monsoon rainfall during the Holocene. However, the northern penetration of the Indian monsoon PAGES NEWS, VOL.14, N°2, AUGUST 2006
inland and its impact on hydrology and vegetation are only poorly understood because of the scarcity of continuous continental sedimentary archives. Here, we present the first continuous record of environment and climate in Southern Arabia, based on sedimentological, mineralogical, pollen and isotope studies of al-Hawa (Yemen) paleolake, which covers the time interval from 12 to 7.5 ka BP.
Science Highlights: Open Section rain falling over the core site. The increase in percentages of fern spores and Typha confirms the humid conditions and points to the extension of reed swamp populations at the lake shore during the same time interval. The uppermost levels of the al-Hawa sequence indicate the return to dry conditions at ca. 7.5 ka BP responsible for the subsequent drying out of the al-Hawa lake.
Regional vegetation
Figure 1: The lacustrine sequence of al-Hawa, Yemen: lithostratigraphy and chronology.
The lacustrine sequence of alHawa The sample site (15°52N, 46°53E, 710 m asl) is a large flat basin located in the inland desert of Yemen, the Ramlat as-Sabatayn, which is the southernmost extension of the Rub al-Khali hyperarid sand sea. The area is surrounded by dunes and fed by wadis, which drain the adjacent Yemen highlands and Hadramawt plateau (Fig. 1). The modern climate is of desert type with annual rainfall of Indian monsoon origin averaging 28 mm, and temperature 27°C at Marib (15°26N, 45°20E). Vegetation is scarce, with trees (Acacia, Commiphora) confined to wadi channels and highland foothills. Herbaceous plants occur on sand, with Cyperus spp., Calligonum spp. and Dipterigyum glaucum mainly growing on stabilized dunes. The sediments were discovered in 1993. Following preliminary studies carried out on selected outcrops (Lézine et al., 1998), a pit was dug in 2000 into the lake bed down to a depth of 7.45 m below the top of the sequence. The al-Hawa lacustrine sequence lies on a wadi-type microconglomerate layer with abundant well-rounded centimetric quartz gravels in a sandy matrix. Such facies confirm that a fluvial system connected wadi al-Jawf and wadi Hadramawt before the al-Hawa depression became endoreic during
the Holocene (Fig. 1). The lacustrine sequence is mainly composed of massive or finely laminated siltstone, silty mudstone and mudstone with abundant biogenic components, such as molluscs, ostracods, sponges and diatoms. It is interrupted by quartz-rich fine sandstone layers, the most important of which, from 1.75 to 0.75 m, being dated from ca. 8 to 7.7 ka BP. Concentrations of both authigenic and biologic (molluscs and ostracods) carbonates suggest phases of major lake development peaking between 11-10.5 ka BP (lacustrine phase 1), 10.1-9.1 ka BP (phase 2), 8.4-8 ka BP (phase 3), and 7.8-7.5 ka BP (phase 4) (Fig. 2). Pollen and isotope data from freshwater shells show that the paleolake of al-Hawa was formed in a very arid environment: high percentages of Amaranthaceae/Chenopodiaceae and high values of δ18O (+4.18‰) indicate saline and highly evaporated conditions. Such high δ18O values are observed today in dry areas of North Africa, at Lake Chad, Lake Abhé or Lake Awassa, while Amaranthaceae-Chenopodiaceae pollen types dominate in salty places in the desert. Conversely, the intermediate levels record negative δ18O values, averaging -4.6‰, close to the characteristically low δ18O of monsoonal rainfall, suggesting that the isotopic composition of precipitation was controlled by the amount of PAGES NEWS, VOL.14, N°2, AUGUST 2006
Up to 91 pollen and fern spore taxa have been recorded in the sediment. They belong to three clearly distinct phytogeographical groupings: Tree taxa are mainly of Somalia-Masai (Acacia, Commiphora, Maerua, Salvadora persica), and Afro-Montane (Olea, Juniperus, Myrica, Podocarpus, Ephedra, Acacia, Dodonaea viscosa, Rhus, Celtis) origin and belong to sclerophilous woodlands and scrubs. All these taxa are found in modern Yemen, except Podocarpus, for which the nearest pollen source is the East African highlands. Herbaceous pollen taxa are of Saharo-Sindian origin, with modern distribution in the deserts of Rub al’Khali and Ramlat as-Sabatayn. Pollen spectra are dominated by herbaceous taxa, mainly Poaceae, Cyperaceae, Cichoriae, Amaranthaceae/Chenopodiaceae, Typha and ferns. Tree pollen grains are scarce, never reaching percentages higher than 13%. This points to the permanency of a semi-arid landscape in the al-Hawa basin during the early to mid-Holocene.
Hydrological changes and rainfall variability The al-Hawa record shows that, during the Holocene, Southern Arabian hydrology was very sensitive to both orbitally induced monsoon variations and other, superimposed, centennial- to millennial-scale variations of the global climate system. It is consistent with the nearby speleothem record from Oman (Fleitmann et al., 2003), which shows that the summer monsoon influence increased significantly after 10.3 ka BP and decreased after 7 ka BP in response to the northsouth movements of the Intertropical Convergence Zone (ITCZ) over the Arabian peninsula. Our data sug-
31
Science Highlights: Open Section
32
Figure 2: The “Arabian Humid Period” from marine and continental archives. Left panel: Globigerina bulloides percentages from ODP site 723 (Gupta et al., 2003) with highest percentages reflecting phases of strong upwelling in the Arabian sea. Numbers refer to Bond events (Bond et al., 1997). Right panel: the lacustrine record of al-Hawa (Yemen) with three “dry” events punctuating the humid period (arrows). Pollen data and the oxygen-isotope record on fresh-water shells shows the dramatic increase in summer monsoon rains from 9000 yrs B.P. onwards. Arid, evaporated, conditions increased toward the end of the “Arabian Humid Period”, and the al-Hawa lake completely dried out at 7500 yrs B.P.
gest that the ITCZ reached the core site (16°N) from 9 ka BP onwards. In addition, the abrupt climate variations recorded from ice and ocean cores during the Holocene (Bond et al., 1997) have also been recorded in Southern Arabia, by a succession of dry phases, between 10.5-10.1, 9.18.4, and 8-7.8 ka BP, thus confirming previous observations on the Indian monsoon system from the adjacent ocean (Gupta et al., 2003).
Conclusion The al-Hawa sedimentary sequence provides an exceptional, and rare, continuous record of environment and climate variations in the Southern Arabian Desert. Paleolake records are surprisingly scarce in this region (Lézine et al., in press). Al-Hawa, as with many of the other freshwater extensions in the Rub al’Khali desert,
benefited from surficial runoff from the adjacent highlands located to the south (the Hadramawt plateaus) and to the west (the Yemen highlands). The flat morphology of its wide basin made it very sensitive to low amplitude variations in rainfall. The presence of the Hadramawt plateaus and the Yemen highlands, which acted as topographical and ecological barriers against the northward penetration of tropical plants (as observed in the Saharan desert at that time), played a determinant role in the vegetation composition, which remained of desert, semi-desert type throughout the Holocene humid period. NOTE The presented data is available in the MEDIAS database at: medias.obs-mip.fr/eclipse
REFERENCES
Bond, G., Showers, W., Cheseby, M., Lotti, R., Almasi, P., deMenocal, P., Priore, P., Cullen, H., Hajdas, I., and Bonani, G., 1997: A Pervasive Millennial-Scale Cycle in North Atlantic Holocene and Glacial Climates. Science, 278: 1257-1266. Fleitman, D., Burns, S.J., Mudelsee, M., Neff, U., Kramers, J., Mangini, A., and Matter, A., 2003: Holocene forcing of the Indian monsoon recorded in a stalagmite from Southern Oman. Science, 300: 1737-1739. Gupta, A.K., Anderson, D.M., and Overpeck, J.T., 2003: Abrupt changes in the Asian Southwest monsoon during the Holocene and their links to the North Atlantic Ocean. Nature, 421: 354-357. Lézine, A.-M., Saliège, J.-F., Robert, C., Werthz, F., and Inizan, M.-L., 1998: Holocene lakes from Ramlat-as Sab’atayn (Yemen) illustrate the impact of monsoon activity in Southern Arabia. Quaternary Research, 50: 290-299. Lézine A.-M., Tiercelin J.-J., Robert C., Saliège J.-F., Cleuziou S., Braemer F., and Inizan M.-L., in press: Centennial to millennial-scale variability of the Indian monsoon during the early Holocene from a sediment, pollen and isotope record from the desert of Yemen. Palaeogeography, Palaeoecology, Palaeoclimatology.
A better climate for human evolution MARTIN H. TRAUTH1, MARK A. MASLIN2, ALAN DEINO3 AND MANFRED R. STRECKER1 Department of Geosciences, University of Potsdam, Germany; trauth@geo.uni-potsdam.de Environmental Change Research Center, University College London, UK 3 Berkeley Geochronology Center, USA 1 2
Investigations of both terrestrial and marine paleoclimate archives have resulted in an ongoing debate concerning global vs. local climate forcing and associated environmental changes in East Africa. A better knowledge of shifts between dry and humid conditions is key to our understanding of processes influencing mammalian and, in
particular, hominin evolution (deMenocal, 1995; Trauth et al., 2003, 2005). Because of the unique tectonic and magmatic evolution of the East African Rift System (EARS) and resulting changes in orography and drainage patterns, terrestrial paleoclimate records from these environments may not always automatically reflect the enPAGES NEWS, VOL.14, N°2, AUGUST 2006
vironmental changes inferred from marine records. For example, the tectonic and magmatic evolution of the EARS has resulted in highly variable sedimentary environments in close proximity to each other, whose depositional record may be fundamentally influenced by local conditions rather than global signals. Thus, it is important to strive
Science Highlights: Open Section for a better understanding of riftrelated processes and indicators of regional climate change, with the aim of characterizing hydrological changes in East Africa and, ultimately, of comparing them to global processes.
Ethiopian Rift ETHIOPIAN RIFT
WESTERN BRANCH OF THE EARS
6
Omo
Turkana
Lake Kivu 30°E
32
MagadiNatron
Olduvai
Baringo-Bogoria TANZANIAN RIFT T
Gicheru Olorgesailie
34
42
����������� ��������������
������������������ �����������
����������������� �����������
���������������
�������
1.66
1.6546 1.71
Deep freshwater lake
2.68
No lake
At ~2.6 Ma Olduvai Technology, Earliest Homo, Oldest "robust" Australopithecines
����� 3.01
A. bahrelghazali
2.66-2.56
Praeanthropus afarensis
2.3
2.51 2.58 2.71
H. rudolfensis
Lava, tuff
��������
Homo habilis
Age data
A. africanus
2.0-2.1
�������
P. aethiopicus
1.87
H. ergaster
1.85 1.88 2.0
1.96
At ~1.8 Ma Earliest Homo erectus, Out of Africa, Acheulean Technology
Australopithecus garhi
������ ������ ������ ����� ��� ���
1.38 1.44
H. erectus
1.749 1.761 1.764 1.798 1.806 1.859 1.865 1.976 2.018 2.029
1.38
H. antecessor
����� �������
At ~1.0 Ma Second major migration of Homo erectus out of Africa, extinction of the genus Paranthropus
Paranthropus. boisei
��������� 0.8-1.0
At 160 to 154 kyr Oldest Members of Homo sapiens
P. robustus
���������� 0.946 0.977 0.987
0.974 0.992
H. heidelbergensis
���������� �������� 0.72
H. neanderthalensis
0.509 0.552 0.545 0.610
0.493 0.601 0.662 0.746 0.780
�����������
������� �������������
Homo sapiens
0.235 0.284
14C extrapolated
14C U/Th
H. floresiensis
14C
14C, U/Th U/Th
Shallow alkaline lake
3.0
Bogoria basins in the north started in the Middle and Upper Miocene, whereas the age of the oldest lacustrine sequences in the central and southern segments of the rift (i.e., Kenya and Tanzania) is Early Pliocene (Tiercelin and Lezzar, 2002). However, if tectonics were the sole control over the appearance and disappearance of lakes, then either a N-S or NW-SE temporal pattern would be expected. In contrast, what is observed is the appearance of large, deep lakes synchronous across a large geographical area at 2.7-2.5 Ma, 1.9-1.7 Ma and 1.1-0.9 Ma (Trauth et al., 2005), suggesting regional climatic control. For the reconstruction of these lakes, we sampled several tens of meters thick lacustrine sequences at meter to half-meter intervals. The diatomite and pyroclastic material-bearing sediments were investigated for sediment characteristics, authigenic minerals, and diatom flora. Where possible, these units were radiometrically dated using anorthoclase and sanidine phenocryst concentrates from several tuff beds and lava flows.
0.06
0.04
0.02
0.00
����������� ��������
������� ����������
2.35
2.5
44
and Southern Kenya Rift between 9 and 6 Ma. These early halfgraben formed during approx. E-W oriented extension and were subsequently faulted antithetically between about 5.5 and 3.7 Ma, which generated a full-graben morphology. Major normal faulting in the Magadi-Natron and Olduvai basins occurred at 1.2 Ma and produced the present-day rift escarpments (Tiercelin and Lezzar, 2002). The southward propagation of extensional processes in the EARS is also reflected in the earliest formation of lake basins in East Africa. The fluvio-lacustrine history of the Afar, Omo-Turkana and Baringo-
�������������
2.0
Indian Ocean
Mt. Kilimanjaro 38 40
����������
1.5
E q u a t o r
Mt. Kenya
Turasha
Figure 1: Map of East Africa showing topography, faults and lake basins.
�������������
1.0
Naivasha
Lake Victoria
EASTERN BRANCH OF THE EARS
KENYA YA RIFT Y
Mt. Elgon
NakuruElmenteita
Lake Edward
The EARS is characterized by a southward propagation of rifting, including the formation of major faults, subsequent densification and tectonic differentiation of extensional basins and coeval magmatic activity. The earliest formation of lake basins in the northern parts of the rift is an integral part of these processes. In the Ethiopian Rift, volcanism started between 45 and 33 Ma, in northern Kenya at around 33 Ma, and continued to about 25 Ma, whereas the magmatic activity of the central and southern segments of the rift in Kenya and Tanzania started between 15 and 8 Ma. Major faulting in Ethiopia between 20 to 14 Ma was followed by the generation of major east-dipping faults in northern Kenya between 12 and 7 Ma, superseded by normal faulting on the western side of the Central
0.5
Normal Fault
Suguta Valley Lake Albert
History of the East African rift lakes
0.0 Ma
Areas > 1000 m above sea level
Lake Turkana
4
2°N
������������
Central Afar
AFAR F FAR BASIN
33
Figure 2: Insolation variation, wet periods in East Africa and human evolution. The compilation of lake records is based on a large volume of literature (Olduvai, Magadi-Natron-Olgesailie, Baringo-Bogoria, Omo-Turkana-Suguta, Ethiopian Rift and Afar), as well as from our own work (Central Kenya Rift) (see Trauth et al. (2005) and references therein for details).
PAGES NEWS, VOL.14, N°2, AUGUST 2006
34
Science Highlights: Open Section Paleoclimatic implications The alternating wet and dry phases during the last 3 Ma correlate with numerous other humidity paleoclimate indicators in East Africa, such as mammal assemblages, fossil forest leaves, wood and pollen, as well as with Mediterranean sapropels and dust. The most fascinating phenomenon in this context is the anti-correlation between the East African lake levels and paleoclimate records from subtropical West and Northeast Africa (deMenocal, 1995). In this context, it has been proposed that eolian dust in ocean sediment cores off western and eastern subtropical Africa record environmental changes in Africa that were also thought to represent drier conditions in regions that we studied. However, records from sediment cores off West Africa and Oman may not automatically reflect the nature of East African climate change, since the source areas of these terrigenous deposits are in the Sahara/Sahel regions off West Africa, Arabian peninsula (more than 80%) and northeast Africa (less than 20%), rather than equatorial East Africa where the hominins evolved. Importantly, the periods of increased humidity, as reconstructed from East African lake levels, correlate both with significant global
climatic changes, as well as periods of maximum eccentricity. The period between 2.7 and 2.5 Ma corresponds to the onset of Northern Hemisphere Glaciation, the period between 1.9 and 1.7 Ma corresponds to a significant shift in the Walker Circulation, and the interval between 1.0 and 0.8 Ma corresponds to the initiation of the Mid-Pleistocene Revolution. The phases of high lakelevels in the Ethiopian and Kenyan rifts also correlate with periods of maximum eccentricity, suggesting that changes in local solar radiation are equally important in the moisture history on longer time scales. Since the main effect of eccentricity is to modulate the amplitude of Earth’s precession cycles, at times of maximum eccentricity, the seasonality in insolation and, hence, the intensity of the rainy seasons in the tropics increases (Clement et al., 2004). The combination of significant global climate changes with maxima in precessional amplitudes may explain why these humid periods recur only after 0.4 Ma, whereas maximum eccentricity and, hence, maximum amplitudes in precession occur at higher periodicities. These periods of extreme climate variability coincide with key periods of speciation and dispersal of mammals and hominins in East Africa and may have been the cat-
alyst for human evolution. In this respect, the close link between lacustrine environments and sites of early hominin occupation is intriguing. Based on these observations, we identify two important issues in mammalian and hominin evolution in East Africa. First, sustained periods of amenable climatic and environmental conditions lasting for protracted periods on the order of 104–105 years, promoting synpatric evolution. Second, lakes may have rapidly appeared and disappeared with precessional cyclicities, producing a rapidly changing mosaic of environments, which ultimately helped promote allopatric evolution. REFERENCES
Clement, A.C., Hall., A. and Broccoli, A.J., 2004: The importance of precessional signals in the tropical climate. Climate Dynamics, 22: 327-341. deMenocal, P., 1995: Plio-Pleistocene African Climate. Science, 270: 53-59. Tiercelin, J.J., and Lezzar, K.E., 2002: A 300 million years history of rift lakes in Central and East Africa: an updated broad review. In: Odada, E.O., Olago, D.O. (Eds.), The East African great lakes: limnology, paleolimnology and biodiversity, Kluwer, Dordrecht, pp. 3-60. Trauth, M.H., Deino, A., Bergner, A.G.N., and Strecker, M.R., 2003: East African climate change and orbital forcing during the last 175 kyr BP. Earth and Planetary Science Letters, 206: 297-313. Trauth, M.H., Maslin, M.A., Deino, A., and Strecker, M.R., 2005: Late Cenozoic Moisture History of East Africa. Science, 309: 2051-2053.
Surface temperature reconstructions for the last 2000 years GERALD R. NORTH1 AND IAN KRAUCUNAS2 on behalf of the Committee on Surface Temperature Reconstructions for the Last 2,000 Years, U.S. National Research Council* 1 Department of Atmospheric Sciences, Texas A&M University, College Station, USA; g-north@tamu.edu 2 Board on Atmospheric Sciences and Climate, National Research Council, Washington, USA; ikraucunas@nas.edu
In response to a request from the U.S. Congress, the U.S. National Research Council (NRC) assembled a committee to describe and assess scientific efforts to reconstruct surface temperature records for the Earth over the last 2000 years. This research, and especially the reconstructions originally published by Mann et al. (1998, 1999) and featured in the Intergovernmental Panel on Climate Change
Third Assessment Report (2001), attracted considerable attention because the authors concluded that the Northern Hemisphere was likely warmer during the late 20th century than at any other time during the past millennium. Controversy arose because many people interpreted this result as definitive evidence of anthropogenic causes of recent climate change, while others criticized the methodolo-
gies and data that were used. The NRC committee’s report (2006) attempts to diffuse this controversy by providing a comprehensive assessment of surface temperature reconstructions for the last 2000 years, as well as the implications of these efforts for our understanding of global climate change.
*Gerald R. North (Chair), Franco Biondi, Peter Bloomfield, John R. Christy, Kurt M. Cuffey, Robert E. Dickinson, Ellen R.M. Druffel, Douglas Nychka, Bette Otto-Bliesner, Neil Roberts, Karl K. Turekian, John M. Wallace, Ian Kraucunas (Study Director)
PAGES NEWS, VOL.14, N°2, AUGUST 2006
Science Highlights: Open Section
Figure 1: Smoothed reconstructions of large-scale (Northern Hemisphere mean or global mean) surface temperature variations from six different research teams, each using its own methodology and selection of proxies, are shown along with the instrumental record of global mean surface temperature. Each curve portrays a somewhat different history of temperature variations, and is subject to a somewhat different set of uncertainties that generally increase going backward in time (as indicated by the gray shading). This set of reconstructions conveys a qualitatively consistent picture of temperature changes over the last 1100 years, and especially the last 400.
Findings After considering all of the available evidence, including the curves shown in Figure 1, the committee reached the following conclusions: (i)The instrumentally measured warming of about 0.6°C during the 20th century is also reflected in borehole temperature measurements, the retreat of glaciers, and other observational evidence, and can be simulated with climate models. (ii)Large-scale surface temperature reconstructions yield a generally consistent picture of temperature trends during the preceding millennium, including relatively warm conditions centered around A.D. 1000 (identified by some as the “Medieval Warm Period”) and a relatively cold period (or “Little Ice Age”) centered around 1700. The existence and extent of a Little Ice Age from roughly 1500 to 1850 is supported by a wide variety of evidence, including ice cores, tree rings, borehole temperatures, glacier length records, and historical documents. Evidence for regional warmth during medieval times can be found in a diverse but more limited set of records,
including ice cores, tree rings, marine sediments, and historical sources from Europe and Asia, but the exact timing and duration of warm periods may have varied from region to region, and the magnitude and geographic extent of the warmth are uncertain. (iii) It can be said with a high level of confidence that global mean surface temperature was higher during the last few decades of the 20th century than during any comparable period during the preceding four centuries. This statement is justified by the consistency of the evidence from a wide variety of geographically diverse proxies. (iv) Less confidence can be placed in large-scale surface temperature reconstructions for the period from A.D. 900 to 1600. Presently available proxy evidence indicates that temperatures at many, but not all, individual locations were higher during the past 25 years than during any period of comparable length since A.D. 900. The uncertainties associated with reconstructing hemispheric mean or global mean temperatures from these PAGES NEWS, VOL.14, N°2, AUGUST 2006
data increase substantially backward in time through this period and are not yet fully quantified. (v) Very little confidence can be assigned to statements concerning the hemispheric mean or global mean surface temperature prior to about A.D. 900 because of sparse data coverage, and because the uncertainties associated with proxy data and the methods used to analyze and combine them are larger than during more recent time periods.
Factors limiting confidence The main reason that our confidence in large-scale surface temperature reconstructions is lower before A.D. 1600, and especially before A.D. 900, is the relative scarcity of precisely dated proxy evidence. Other factors limiting our confidence in surface temperature reconstructions include the relatively short length of the instrumental record (which is used to calibrate and validate the reconstructions); the fact that all proxies are influenced by a variety of climate variables; the possibility that the relationship between proxy data and local surface temperatures may have varied
35
36
Science Highlights: Open Section over time; the lack of agreement as to which methods are most appropriate for calibrating and validating large-scale reconstructions and for selecting the proxy data to include; and the difficulties associated with constructing a global or hemispheric mean temperature estimate using data from a limited number of sites and with varying chronological precision. All of these considerations introduce uncertainties that are difficult to quantify.
Role of reconstructions in climate science Overall, the committee found that efforts to reconstruct temperature histories for broad geographic regions using multiproxy methods were an important contribution to climate research and that these large-scale surface temperature reconstructions contain meaningful climatic signals. The individual proxy series used to create these reconstructions generally exhibit strong correlations with local environmental conditions and, in most cases, there is a physical, chemical, or physiological reason why the proxy reflects local temperature variations. Our confidence in the results of these reconstructions becomes stronger when multiple independent lines of evidence point to the same general result, as in the case of the Little Ice Age cooling and the 20th century warming. Surface temperature reconstructions for periods prior to the industrial era are only one of multiple lines of evidence supporting the conclusion that climatic warming is occurring in response to human activities, and they are not the primary evidence. Surface temperature reconstructions also provide a useful source of information about the variability and sensitivity of the climate system. To within existing uncertainties, climate model simulations show that the estimated temperature variations during the two millennia prior to the Industrial Revolution can be explained plausibly by estimated variations in solar radiation and volcanic activity during the same period.
Analysis of previous conclusions The basic conclusion of Mann et al. (1998, 1999) was that the late 20th century warmth in the Northern Hemisphere was unprecedented during at least the last 1000 years. This conclusion has subsequently been supported by an array of evidence that includes both additional large-scale surface temperature reconstructions and pronounced changes in a variety of local proxy indicators, such as melting on icecaps and the retreat of glaciers around the world, which in many cases appear to be unprecedented during at least the last 2000 years. Not all individual proxy records indicate that the recent warmth is unprecedented, although a larger fraction of geographically diverse sites experienced exceptional warmth during the late 20th century than during any other extended period from A.D. 900 onward. Based on the analyses presented in the original papers by Mann et al. and this newer supporting evidence, the committee finds it plausible that the Northern Hemisphere was warmer during the last few decades of the 20th century than during any comparable period over the preceding millennium. The substantial uncertainties currently present in the quantitative assessment of large-scale surface temperature changes prior to about A.D. 1600 lower our confidence in this conclusion compared to the high level of confidence we place in the Little Ice Age cooling and 20th century warming. Even less confidence can be placed in the original conclusions by Mann et al. (1999) that “the 1990s are likely the warmest decade, and 1998 the warmest year, in at least a millennium” because the uncertainties inherent in temperature reconstructions for individual years and decades are larger than those for longer time periods, and because not all of the available proxies record temperature information on such short timescales.
Next steps Large-scale surface temperature reconstructions have the potential PAGES NEWS, VOL.14, N°2, AUGUST 2006
to further improve our knowledge of temperature variations over the last 2000 years, particularly if additional proxy evidence can be identified and obtained from areas where the coverage is relatively sparse, and for time periods before A.D. 1600 and especially before A.D. 900. Furthermore, it would be helpful to update proxy records that were collected decades ago, in order to develop more reliable calibrations with the instrumental record. Improving access to data used in publications would also increase confidence in the results of large-scale surface temperature reconstructions both inside and outside the scientific community. New analytical methods, or more careful use of existing ones, may also help circumvent some of the existing limitations associated with surface temperature reconstructions based on multiple proxies. Finally, because some of the most important potential consequences of climate change are linked to changes in regional circulation patterns, hurricane activity, and the frequency and intensity of droughts and floods, regional and large-scale reconstructions of changes in other climatic variables, such as precipitation, over the last 2000 years would provide a valuable complement to those made for temperature. REFERENCES
Intergovernmental Panel on Climate Change, 2001: Climate Change 2001: The Scientific Basis. Cambridge University Press, Cambridge, UK. Mann, M.E., Bradley, R.S., and Hughes, M.K., 1998: Global-scale temperature patterns and climate forcing over the past 6 six centuries. Nature, 392:779-787. Mann, M.E., Bradley, R.S., and Hughes, M.K., 1999: Northern Hemisphere Temperatures During the Past Millennium: Inferences, Uncertainties, and Limitations. Geophysical Research Letters, 26(6):759-762. National Research Council, 2006: Surface Temperature Reconstructions for the Last 2,000 Years. National Academies Press, Washington, D.C.
Workshop Reports
37
The HOLIVAR Open Science Meeting LONDON, UK; 12-15 JUNE 2006 After just over five years, six workshops, three summer schools and one conference, the HOLIVAR program came to an end with a final Open Science Meeting (OSM) at University College London from 12-15 June 2006. HOLIVAR was designed to bring climate change scientists together to promote interaction and collaboration between climate modelers and paleoclimatologists. At the OSM, both communities combined to present a state-of-the-art synthesis of Holocene climate variability research via both keynote lectures and poster sessions. In opening the meeting, John Birks (Bergen, Norway and UCL, UK) reviewed the history of Holocene research, tracing its roots back to a competition by the Danish Academy of Sciences in Denmark in the 1830s to explain the occurrence of pine stumps in Danish peat bogs (Figure 1). The prize was won by Japetus Steenstrup (Figure 2) who argued in 1841 that the plant and animal remains preserved in bogs might reflect past changes in moisture and temperature. The second keynote by Paul Valdes (Bristol, UK) reviewed the somewhat shorter history of Holocene climate modeling from COHMAP through to the present day, focusing on PMIP1 and 2 simulations and the continuing evolution towards complete Earth system models—an evolution driven by comparisons between model simulations and the paleorecord. In the third keynote, Frank Oldfield (Liverpool, UK) urged future Earth system research to include the additional complexity introduced by human-climate-environment interactions through time. He pointed to the need for a greater understanding of how human societies in the past were affected by or adapted to climate change. Following these three introductory presentations, the program was organized around four themes:
Figure 1: Fossil pine stumps from the Cooran Lane, Galloway, South-west Scotland (photo courtesy of John and Hilary Birks)
Theme 1—Millennial time scales Eystein Jansen (Bergen, Norway) argued that the Holocene “climate optimum” was a regional phenomenon driven by the northern hemisphere summer insolation maximum and amplified by sea-ice feedback in the polar regions. He also presented evidence that sea surface temperatures were higher in the Medieval Warm Period and lower in the Little Ice Age but that these were out of phase with SSTs in the Caribbean. Michel Crucifix (Hadley Centre, UK) described the use of 2.5D and 3D models, explaining the importance of, but difficulty in implementing, transient simulations in the Holocene. He stressed the need for a hierarchy of different modeling approaches, including modeling paleorecords themselves.
Theme 2—Decadal to centennial time scales Jürg Beer (Zurich, Switzerland) described the forcings that were important on a decadal to centennial time-scale, focusing especially on solar forcing. He argued that there was clear evidence for solar forcing from the Holocene record but great difficulty in quantifying it. Bas van Geel (Amsterdam, the Netherlands) was concerned with the potential drivers of decadal to century scale climate variability. He pointed out that the role of solar forcing was poorly understood but could have caused past changes in moisture balance sufficient to affect human societies. He noted that its role may be underestimated in the present global warming debate.
PAGES NEWS, VOL.14, N°2, AUGUST 2006
Theme 3—Climate variability in the last 2000 years Mike Mann (Pennsylvania, USA) noted that that the basic hockey-stick nature of Northern Hemisphere mean temperature trends for the last 1000 years was supported by many independent proxy- and model-based analyses covering the same period. However, he also emphasized the importance of moving beyond the hockey stick. He explained how the use of data-model comparisons, including natural (especially volcanic) forcing could explain many features of pre-19th century climate variability, including the El Niño-like nature of the Little Ice Age, and the regional pattern of change more generally associated with El Niño and the NAO. Hugues Goosse (Louvain-laNeuve, Belgium) presented model results that showed how temperature differences between regions
Figure 2: Japetus Steenstrup (1813-1897), a pioneer of Holocene research. Steensrup won the Danish Academy of Sciences prize for “solving the problem” of how pine trees once grew on Danish bogs.
Workshop Reports
38 could be due to spatial responses to particular forcings and/or to internal variability. He also argued that data assimilation of paleo-proxy data in models could improve our understanding of past changes.
Theme 4—Rapid hydrological change Dirk Verschuren (Gent, Belgium), using proxy evidence from Europe and Africa, argued that a number of periods of cooler and wetter conditions, inferred from peatland and lake-level changes in Europe, corresponded to periods of reduced solar activity. In Africa, especially in Eastern Equatorial Africa, there was some evidence for a similar inverse relationship between solar activity and moisture. Martin Claussen (Hamburg, Germany) argued that rapid climate change, capable of affecting early civilizations, occurred in North Af-
rica during the Holocene, and that the climate at 5500 BP was especially unstable. He maintained that Earth system models are now capable of simulating rapid swings between arid and wet phases in the past but may not yet be able to predict future rapid transitions reliably. In the final keynote, Ray Bradley (Amherst, USA) presented an array of evidence to demonstrate the relevance of understanding past climate to provide insights for the future. He stressed the importance of understanding the cause and consequences of rapid changes, especially abrupt, unprecedented and persistent climate anomalies (AUPs), for which there were many examples, mainly droughts, in the paleo-record. The meeting was attended by 250 people from 30 countries, including 83 students, 18 of whom received
support. There were 150 posters covering the four themes, and book prizes were awarded to the five best student posters: Rixt de Jong (Lund, Sweden, Jun Inoue (Osaka, Japan), Bettina Stefanini (Dublin, Ireland), Auriel Per�oiu (Romania), and Peter De Geest (Brussels, Belgium). FURTHER INFORMATION The HOLIVAR2006 website (www.holivar2006.org) will remain active for at least 12 months and is being updated with poster pdfs. It will also provide video-streaming of the keynote presentations. The official journal for papers is Climate of the Past, and the conference book (Global warming and natural variability: a Holocene perspective, Eds. Battarbee, R.W. and Binney, H.) will be published by Blackwell in 2007.
RICK BATTARBEE, HEATHER BINNEY AND MIKE HUGHES Environmental Change Research Centre, University College London, UK; r.battarbee@ucl.ac.uk
PAGES/CLIVAR workshop on past millennia climate variability – synthesis and outlook WENGEN, SWITZERLAND; 7-10 JUNE 2006 This workshop followed the spirit of the reorganized PAGES/CLIVAR working group (see PAGES News, 2005/1). It was organized by the PAGES/CLIVAR Intersection Working Group (P. Jones, M. Mann, H. Wanner, K. Briffa) in concert with the PAGES office in Bern. Twenty-four participants (Fig. 1), representing various different climate data and modeling sub-disciplines were invited to discuss the state of the art and future needs in the study of late Holocene climate variability. Two days were devoted to short presentations and extended discussions on hot topics and issues, covering the areas of proxy data, climate reconstructions and paleoclimate modeling. The issue of how to deal with uncertainties in assessing climate variability over the past one-to-two millennia was discussed in detail. Questions posed and addressed included: What do current uncertainty estimates take into account? How relevant are current uncertainties for the general findings regarding past climate variability in the past? The following primary conclusions were reached:
• Late 20th century warming is likely anomalous in the context of the past 1000 years at hemispheric scales. There is evidence for periods of cooling and warming that occur on all timescales and on all spatial scales. For pre-instrumental periods, it is vital to consider both the spatial extent and duration of regional climate anomalies. • Comparisons of model-predicted and reconstructed climate variations over the past several centuries are generally favorable, taking into account the currently available data and their uncertainties. • Natural radiative forcing appears to play an important role on the relevant timescales. Solar forcing may account for variability on decadal through millennial timescales. Individual volcanic eruptions impact climate generally for only a few years but longer-term episodes of closely spaced large eruptions (e.g. as in the early 19th century) can
PAGES NEWS, VOL.14, N°2, AUGUST 2006
lead to multidecadal-scale effects. • Usefully constraining estimates of global climate sensitivity from paleoclimate data will require a better knowledge of past radiative forcing and the amplitude of internal, as well as forced, natural variability. The discussions emphasized the importance of distinguishing past hemispheric or global-scale variability from regional variations. For example, it was shown that the widely used term “Medieval Warm Period” is simply not an appropriate description of Medieval climate in many regions of the world. Coral data from Kim Cobb, for example, suggest instead a “Medieval Cool Period” for the tropical Pacific. Such considerations reinforce the principle that a better regional documentation of past climate is necessary to better understand the past. The group that was assembled took note of the importance of focusing not simply on the often emphasized hemispheric mean temperature variations of past centuries, but also on spatial
Workshop Reports
Figure 1: The group of participants in front of the Wengen mountains.
patterns of surface temperature, atmospheric circulation, precipitation and drought. The group also noted the importance of considering dynamical mechanisms such as the El Niño/Southern Oscillation (ENSO) in interpreting past climate changes. The recent PAGES and CLIVAR initiatives on past regional variability in South America and the Mediterranean region follow this principle (see PAGES News 2005/1, 2005/2 and 2005/3). The group recognized that additional effort is needed in the archiving of paleoclimate data and associated metadata. They also agreed on the
importance of encouraging scientists to provide not just the proxy data and climate reconstructions, but as much information as possible about random and systematic error and uncertainty. The latter information is crucial, for example, in comparisons of paleoclimate evidence with model simulation results. The participants agreed that progress in climate modeling approaches is also crucial to a better understanding of past climate variability, and to the assessment of current and future anthropogenic impacts on climate. To this end, the workshop participants agreed to plan a community-wide “paleoclimate re-
39 construction challenge” in the near future (see Program News, page xx, this issue). This challenge will build on the theme of model intercomparison, using synthetically derived “pseudoproxy” test datasets derived from climate models as a test of methods used in paleoclimate reconstruction, similar in many respects to last year’s “EPICA Challenge” initiative (see e.g. EOS, No. 38, 2005). A second project addressing proxy data uncertainties and data archiving is also being planned. The four-day workshop in the unique setting of the snow-covered Bernese Alps provided a stimulating setting for informal discussions, setting the stage for productive activities in the months and years ahead. A synthesis publication on the state of the art of late Holocene climate variability will be published by the workshop participants. Follow-up activities are currently being planned. ACKNOWLEDGEMENTS The workshop was funded by the Electric Power Research Institute (EPRI), PAGES, Swiss NCCR-Climate and CLIVAR.
CHRISTOPH KULL1, KEITH BRIFFA, PHIL JONES, MICHAEL MANN AND HEINZ WANNER PAGES Office, Bern, Switzerland kull@pages.unibe.ch 1
ICDP workshop PASADO: Deep drilling at Laguna Potrok Aike, a maar lake in southern Argentina RÍO GALLEGOS, ARGENTINA; 15-19 MARCH 2006 Patagonia is subjected to shifts in polar and mid-latitude winds, pressure fields and precipitation regimes, as well as to variations related to El Niño Southern Oscillation (ENSO) and the Antarctic Oscillation (AO). Therefore, environmental and climatic reconstructions have the potential to provide unique records of variations in the hydrological cycle, changes in aeolian dust deposition, and consequences and frequencies of volcanic activities. Since 2001, crater lakes of the Pali Aike Volcanic Field (southernmost Patagonia, Argentina) have been studied in the framework of the interdisciplinary project “South American Lake Sediment Archives and Modelling” (SALSA) funded by
the German Climate Research Program (DEKLIM) and carried out in close cooperation with Argentine scientists (PAGES News 12/2, 9-11). On-site monitoring and multidisciplinary reconstructions based on sediment cores from the maar lake Laguna Potrok Aike have formed the basis for environmental and climatic reconstructions on decadal up to millennial time scales. Located 52°S, the lake received dust and volcanic ash from Patagonia and the Andean volcanic chain, which are distributed not only across South America but also blown over the South Atlantic and onto Antarctica. Thus, isotopic and aerosol tracers could be used to link these different areas, making PAGES NEWS, VOL.14, N°2, AUGUST 2006
not only inter-site but also inter-archive correlations available. Such data will advance hemispheric reconstructions of climate variability and proxy-model comparisons to better understand climate forcing factors. First results are promising but coring ended around 16 cal ka BP, due to technical restrictions of the available coring device. With additional funding from the Priority Programme “ICDP” of the German Research Foundation (DFG), it was possible to carry out deep seismic surveys, which revealed >150 m of lacustrine sediments underlain by >350 m of volcano-clastic deposits. As the maar formation occurred at
Workshop Reports
40 770±220 ka, seismic data suggest that lacustrine deposits may cover up to seven glacial cycles. This calls for a much larger scientific endeavor that can only be accomplished within the framework of the International Continental Scientific Drilling Program (ICDP). Thus, the research initiative “Potrok Aike Maar Lake Sediment Archive Drilling Project” (PASADO) was developed, with the goal to get the GLAD800 coring system to Patagonia. The four-day ICDP PASADO workshop, consisting of 46 talks organized into 10 sessions, was convened in the Conference Hall at the Complejo Cultural Santa Cruz in Río Gallegos, Argentina from 15-19 March 2006, bringing together 52 participants from 11 countries (Fig. 1). The first two sessions introduced participants to the study area. Attendees were impressed with the data presented and felt that Laguna Potrok Aike should be recommended as an appropriate target for future ICDP deep drilling because it is not only a unique site for terrestrial climate reconstruction in the southern hemisphere but also for investigation into the formation of a relatively young mid-Pleistocene phreatomagmatic crater. A fieldtrip during the workshop presented an overview of the lake and the surrounding catchment area from a prominent basalt escarpment, and focused on technical and logistical issues, as well as on volcanic evidence and records of
Figure 1: Participants of the PASADO workshop in Río Gallegos.
environmental change in the field. The day ended with an “asado”, a famous Argentine-style barbeque, on the premises of the INTA field station Potrok Aike. The concluding day was devoted to break-out groups on four major topics related to technical aspects of scientific drilling and on volcanological, inorganic and organic aspects of sediment core analysis. During a final plenary discussion, all the ideas and suggestions were pooled. The ICDP PASADO workshop proved to be very successful, both in terms of scientific collaboration, as well as technical and logistical issues. Participants actively finetuned analytical strategies, focused on improving cooperation and coordination between scientific groups, and developed the timeframe and outline for the full ICDP deep drilling proposal. The science plan that was established already serves as a basis for international cooperation,
and several proposals have been developed and submitted to national funding agencies in support of PASADO. However, although the first milestone has passed, there are still plenty of opportunities to expand the scientific community involved through international collaboration. The scientific program, list of participants, abstracts of presentations and excursion guide were published as Terra Nostra 1/2006. Further information can be obtained from www. salsa.uni-bremen.de. ACKNOWLEDGEMENTS The PASADO workshop was organized by the team of GEOPOLAR (Institute of Geography, University of Bremen) and hosted by the Universidad Nacional de la Patagonia Austral (Río Gallegos). It was supported logistically by the Government of Santa Cruz and the Instituto Nacional de Tecnologia Agropecuaria (INTA), and financially by ICDP.
BERND ZOLITSCHKA1, HUGO CORBELLA, NORA MAIDANA AND CHRISTIAN OHLENDORF University of Bremen, Germany; zoli@uni-bremen.de 1
Climate change: A multi-dimensional challenge LUND, SWEDEN; 26-28 OCTOBER 2005 As part of the British Council’s program International Networking for Young Scientists (INYS) a BritishSwedish-Danish workshop was organized by the Swedish Meteorological and Hydrological Institute, the Geological Survey of Denmark and Greenland, the Climate Research Unit at the University of East Anglia, and the Hadley Centre (part of the Meteorological Office). A principal aim of the workshop, which brought together 19 young scientists, was to promote interaction between people who generate reconstructions of past climates from paleo-data, those who
work with instrumental time series and those who work on climate modeling. Six keynote lectures were given and these included topics such as projections of climate change over the next few decades, the usefulness of global climate models, the added value of regional modeling, and the nature of the geological data that form the basis of a reconstruction of a widespread cooling event at approx. 8200 years ago. A highlight of the workshop was Professor Bert Bolin’s keynote lecture “To use scientific knowledge on climate change in politics.” Bert PAGES NEWS, VOL.14, N°2, AUGUST 2006
was a founding Chair of the Intergovernmental Panel on Climate Change (IPCC) and was instrumental in the initial formulation of the World Climate Research Programme (WCRP). In his 80th year, he captivated a full audience with his personal and often revealing insight into how the scientific community must relay their concerns about climate change to the public and politicians. His message was clear; there is a great deal of knowledge on climate and, notwithstanding the remaining uncertainties (Fig. 1), urgent measures must
Workshop Reports
41 road-rail link to Copenhagen. It was, therefore, appropriate that the workshop ended with a visit to the Niels Bohr Institute to see the ice cores recovered from the Greenland ice sheet. ACKNOWLEDGEMENTS
Figure 1: A) Annual mean temperature change from 1971-2000 to 2081-2090, as averaged over 21 models forced with the SRES A1B emissions scenario. B) Estimated probability that temperature change exceeds zero. The relatively low probability in the northern North Atlantic is a result of models that simulate cooling due to changes in ocean circulation (Räisänen and Ruokolainen, 2006, Tellus A, 58).
be taken to curb human influence on the properties of the atmosphere. A parallel program was also scheduled for approx. 50 high school students. These students were taken to a local peat bog where they were given an introduction to palaeoclimatology, which included the coring
of peat, lake and marine sediments. This fieldtrip was followed by a “climate panel debate”, in which the students were given the opportunity to ask scientists at the GeoBiosphere Science Centre about past, present and future climates. Lund is located only 20 km from the recently opened
The organizers are grateful to the British Council for their financial support and for the efficient management of the workshop by Ki Andersson (Sweden) and Michael SorensenJones (Denmark). We thank the participants and keynote lecturers for an intellectually intense and stimulating few days, and Sune Olander Rasmussen for his guided tour of the Niels Bohr Institute.
IAN SNOWBALL1, SVANTE BJÖRCK, RICHARD BRADSHAW, KEITH BRIFFA, RICHARD JONES AND MARKKU RUMMUKAINEN Lund University, Sweden; ian.snowball@geol.lu.se 1
New trends in Geomorphology – systems-based understanding of long term man-landscape interactions LUCIFS WORKSHOP, MUENZENBERG, GERMANY; 11-14 MAY 2006 LUCIFS is a constitutive part of PAGES Focus 5 “Past Ecosystem Processes and Human-Environment Interactions”. The LUCIFS research explores past to present responses of fluvial systems to climate change and human activities. After 2000, the LUCIFS group organized a second major workshop open to all interested members of the research community. The workshop focused on man-environment interactions, particularly on geomorphological and sedimentological perspectives on mid- to long-term quantitative sediment fluxes. The meeting was convened in Muenzenberg near Frankfurt, Germany from 11-14 May 2006. The LUCIFS leader, Richard Dikau (Univ. Bonn, Germany), and the local organizers, Peter Houben (Univ. Frankfurt, Germany), Lothar Schrott (Univ. Salzburg, Austria) and Jürgen Wunderlich (Univ. Frankfurt, Germany) were very pleased to welcome 41 participants from 5 continents and 14 countries (Fig. 1). The workshop provided a stimulating working atmosphere with high-profile talks. The tight schedule consisted of 19 oral and 11 poster presentations, of
Figure 1: Participants of the LUCIFS 2006 workshop in Muenzenberg, Germany.
which 5 keynote talks considered the state of the art in various fields of man-environment research. All contributions were of outstanding quality and sparked animated discussions. The workshop program was supplemented by a pre-workshop fieldtrip led by Peter Houben. During the fieldtrip, the methodical approach and results of a Holocene sediment budget study for Rockenberg catchment were presented. One of the main messages there was that in this area, the spatial pattern of erosion and redeposition, the routing of sediments and the changes in rates of flux and delivery along the sediment cascade have been chiefly controlled by human actions. PAGES NEWS, VOL.14, N°2, AUGUST 2006
On Saturday afternoon, small working groups elaborated on selected topics of Holocene humanenvironment interactions. The 4 thematic foci were: - Systems-based understanding of earth surface change with respect to Holocene sediment flux. - Evaluating quantitatively human impact on earth surface systems. - Exploring the sedimentary record: cross-cutting approaches to catchment-scale sediment flux. - Coupling changing pressures of anthropogenic and natural drivers with modeling approaches. Structured discussions helped to identify key issues for further re-
Workshop Reports
42 search, which were presented to the whole group of participants in a succeeding plenary session. At least one of the small groups decided to edit a joint review paper based on the topics discussed during that afternoon. Richard Dikau chaired the final plenary discussion on Sunday morning. His introduction dealt with the development of LUCIFS objectives and approaches over the past 6 years and included a critical review of past deficiencies. The discussions
addressed future LUCIFS research strategies against the backdrop of the workshop contributions and current approaches to Earth System Science and will result in a revised LUCIFS research plan. Workshop contributions and results will be published in a special issue of Geomorphology (Elsevier). People interested in LUCIFS activities are invited to visit the PAGES Focus 5 homepage (www. pages-igbp.org/science/research/focus5.html) for further information.
ACKNOWLEDGMENTS The Deutsche Forschungsgemeinschaft (DFG) gave considerable support by covering all workshop costs including staff appropriations for the large number of student helpers. PAGES co-sponsored the workshop by funding the travel costs of a number of participants from Eastern Europe and South America.
PETER HOUBEN
Wolfgang Goethe University, Frankfurt, Germany; houben@em.uni-frankfurt.de
Linkage between marine and terrestrial processes during past rapid climatic changes BARCELONA, SPAIN; 13-15 MARCH 2006 This workshop was organized by a new working group of the INQUA Commission on Coastal and Marine Processes. The group was inspired by our sadly missed colleague, Nick Shackleton, with the aim of analyzing paleoclimatic records from an integrated marine and terrestrial perspective. The objective of the workshop was to identify key scientific questions that could be addressed through future drilling/coring programs. New data sets from various regions (Fig. 1) were reviewed, and stimulated discussions on atmospheric and oceanic processes active in propagating and modulating past rapid climatic variability: Zone 1: Sediment cores from the delta fan systems of the Congo Ogooué, Nyong and Sanaga rivers record changes in river discharge associated with latitudinal migration of the Intertropical Convergence Zone (ITCZ) over Africa during the last deglaciation and Holocene periods. Zone 2: The evolution of the East African ITCZ was discussed on the basis of sediment cores from the Nile delta fan, which records changes in the hydrological regime of the Nile catchment regions. Zone 3: The humidity evolution of North Africa and the interplay between low- and high-latitude processes during rapid climatic changes were discussed by
Figure 1: Map illustrating the regions from which data were presented and discussed during the workshop: (1) F. Marret and S.-Y. Kim; (2) S. Weldeab; (3) L. Dupont and O. Romero; (4) I. Cacho, F. Martinez, F. Lobo, L. M. Fernández-Salas, E. Llave and J. Hernandez-Molina; (5) F. Abrantes, T. Rodrigues, L. Pena, C. Tzedakis and M. F. Sanchez-Goñi; (6) J. Scourse; (7) W. Austin and I. Hall; (8) I. Hall. Map Source: IHO-UNESCO, General Bathymetric Chart of the Oceans, Digital Edition, 2003, www.ngdc.noaa.gov/mgg/gebco (thanks to B. de Mol for data map processing).
means of new high-resolution records from around Cape Blanc and off Morocco. Zone 4: Multi-proxy analyses of Alboran Sea sediments provide records of both marine and terrestrial processes at Dansgaard-Oeschger frequency. Geophysical data from shallow areas in the Gulf of Cadiz and PAGES NEWS, VOL.14, N°2, AUGUST 2006
Alboran Sea were discussed for their potential in obtaining ultra-high resolution records. New data from the Gulf of Cadiz provided the basis for an IODP drilling proposal under evaluation. Zone 5: The Western Iberian Margin is a unique area for marine-terrestrial linkage at centennial-millennial scale. New Holocene records off the Tagus River resolve decadal changes linked to the North Atlantic Oscillation (NAO). Holocene sediments from the Galician Rias record changes in the Meridional Overturning Circulation (MOC). Marine pollen records suggest different timing in the evolution of vegetation and sea level, providing an intriguing insight into the feedback mechanisms during glacial interceptions. Zone 6: Sediments from the southwestern British Margin record the millennial-scale evolution of the British ice sheets (BIS). The role of the British Shelf in emitting or trapping atmospheric CO2 was discussed on the basis of model and proxy data of sea level, tidal dynamics and primary production. Zone 7: The North British Margins provide sequences with extraordinary potential to study BIS sensitivity, and the interplay between surface oceanography and MOC. New records
Workshop Reports from the Scottish Fjords show the potential for monitoring past decadal changes linked to the NAO. Zone 8: The Atlantic-Indian Ocean connection in relation to South African climate was discussed in the context of new sediment records from the Agulhas Current and a submitted IODP drilling proposal. Future group activities will involve new workshops focusing on spe-
cific regions such as the N. African and W. Mediterranean regions and the British Margin, to work on future drilling proposals. We also plan a thematic workshop on the geographical distribution of Heinrich event signatures across the N. Atlantic region by September 2007. An associated workshop on “Fjord Environments: Past, Present and Future” (post Challenger 2006 meeting; www.sams.ac.uk/challenger/)
43 will be held in Oban, UK from 15-16 September 2006. ACKNOWLEDGMENTS This workshop was co-sponsored by INQUA, PAGES, the Spanish Ministry of Education and Science (Grant: CGL200523763-E-CLI) and the Faculty of Geology, University of Barcelona.
ISABEL CACHO
University of Barcelona, Spain; icacho@ub.edu
Monitoring Indonesian throughflow variability: Challenges and perspectives KIEL, GERMANY; 19-22 JULY, 2006 North Pacific Thermocline
Pacific Ocean
South Pacific Thermocline Celebes Sea
tra it
Borneo
8
La
Ma
ka
ssa
rS
Molucco Sea
i es law Su
~a in N
Halmahera
1.5
Banda Sea Java
10
Lom bok
The transport and thermohaline stratification of the Indonesian Throughflow (ITF, Fig. 1) influence the heat and freshwater budgets of both the Pacific and Indian Oceans, and alter patterns of heat and water vapor exchange with the atmosphere on a global scale. The ITF, which is tightly linked to regional climate systems, such as the El Niño Southern Oscillation (ENSO) and the Australasian monsoon, also plays a central role in the global “conveyor” circulation thereby exerting a critical control on Earth’s climate. It is likely that the ITF was substantially modulated by changes in the geometry of the Indonesian pathways due to sea level changes during the Pleistocene and tectonic reorganizations of the archipelago during the Cenozoic. Because of its close link with regional climate systems, it may have also experienced more subtle changes during the Holocene. The processes driving ITF variability and its magnitude are, however, not very well constrained nor is the effect of ITF variability on tropical and extra-tropical climate fully understood. To address these issues a thematic workshop was held from 19-22 July 2006 at the Institute of Geosciences, Kiel University, Germany, attended by 22 scientists from the U.S., Switzerland, France, Germany, China, India, Indonesia, Timor Leste and Australia. The goal of the meeting was to present an
Indian Ocean
ITF
1.7
4.5
or m Ti
4.3
Australia
Figure 1: Main pathways of present-day Indonesian Throughflow at thermocline depth and estimates of total volume transport (in Sverdrups). Modified from Gordon (2005)
overview of the latest research initiatives on oceanography and paleoceanography in the ITF region, and to outline urgent research goals for the next few years. Proxy studies that target the reconstruction of inter-ocean gradients and the transfer of heat, salt and nutrients are crucial. These reconstructions can be accomplished by providing reliable estimates of (1) thermocline structure and temperature in the ITF region, and; (2) ITF circulation changes (intensity, vertical structure of flow and temperature weighted flow). Ultimately, time slice reconstructions should be integrated with modeling studies to evaluate the influence of changing boundary conditions on the ITF (i.e., insolation, volcanic episodes, geometry of passages, sea level), and the linkages between ITF variability and fluctuations in regional and global climate. Time slices of specific interest are: • Last 50 years
PAGES NEWS, VOL.14, N°2, AUGUST 2006
• Little Ice Age (1500-1900) including Tambora eruption (1815) as a marker event • Medieval Warm Period (1000 AD±200) • Early Holocene (9 ka) • Last Glacial Maximum (19-23 ka) • Specific Marine Isotope Stage (MIS) 3 events • MIS 5e (122 ka) • MIS 11 (400 ka) Longer time series will provide insight into (1) the phasing between ITF variations and other factors: warm pool changes, monsoons, atmospheric CO 2 and sea level, and; (2) the ITF response to the “mean state of the tropical Pacific” (“ENSO” thermocline tilt, SST distribution). New IMAGES coring initiatives will focus on regions that still have poor core coverage: Makassar Strait, the southern Celebes Sea, east and west of Halmahera, Molucca Sea, Ninetyeast Ridge and West of Sumatra. Since only a few piston cores in this high accumulation rate region will reach back to MIS 12, the drilling of new IODP Sites in the Timor Sea and Makassar Strait will be crucial for evaluating the impact of tectonic and orbital forcing on regional and global climate. WOLFGANG KUHNT
Christian-Albrechts-Universität, Kiel, Germany; wk@gpi.uni-kiel.de
Last
44
CALENDAR 2006/2007
October 24 - 27, 2006, Birmingham, UK Rapid Climate Change - International Science Conference
November 20 - 23, 2006, Istanbul, Turkey Climate Change and the Middle East - Past, Present, Future
Further Information: www.noc.soton.ac.uk/rapid/rapid2006/
Further Information: www.climatechange_middleeast.itu.edu.tr/
November 9 - 11, 2006, Carmona, Seville, Spain First MedCLIVAR workshop: Reconstruction of past Mediterranean climate
March 25 - 30, 2007, Ventura, USA Gordon Research Conference on Polar Marine Science
Further Information: www.medclivar.eu/
Further Information: www.grc.org/programs/2007/polar.htm
November 9 - 12, 2007, Beijing, China ESSP Open Science Conference - Global Environmental Change: regional Challenges
April 11 - 14, 2007, Nanjing, China 2nd LIMPACS Salinity, Climate Change and Salinisation Workshop
Further Information: www.essp.org/essp/ESSP2006/
Further Information: www.geog.ucl.ac.uk/ecrc/limpacs/events.htm
www.pages-igbp.org/calendar
New on the PAGES bookshelf ������������������������������������ ����������������������� ����������������������������������������� �������������������������� ����������������������������������� ����������������������������������
�������������� �������� ���� ������� ���� ������������ ����������� ���������� ���� ��������� ���� �������� ���� ������� ������������� ��� ����� ���� ������������� ��������������� ���� ����������� ���������� �������� ��� ��������� ���� ����������� ���������������������������������������������������������� ������� ��� ���� ���������� ���� ����������� ���� �������� ��� ���� ����� ������� ���� ��������� ���������� ��� �������� ������������ �� ������ ���� ����������� ������������ ��� ������� �������������� ������� ��������� ��� ��������� ���� ���������� ���� ���� ����������� ��� ��� ������������� ��� ������� ���� ����������� ��� ���� ��������������� ������������ ����������� ���� ������������ ��� ���� ��������������� ���������� �������� ���� ������������� ��� �������� ���� ������������� �������� ��� ���� ����������� ����� ���� ���������������������������������������������������������� ���� ������������� �� ��������� ������������ ��� ���� ������������� ��������� ������ ���� ���� �������������� ��������� �������� ������������� ���� ������������ ���� ��������� �������������� ���� ���������� ���� ������������� ���� ������� ����� ������� ������������� ���� ����������� ���� ����� ��������������������������������������������������������������� ����������������������������������������
PAGES NEWS, VOL.14, N°2, AUGUST 2006 Printed on wood- and chlorine-free paper