8 minute read
The South Pacific and climate change


The South Pacific and climate change doi.org/10.22498/pages.horiz.1.30
SECRETS HIDDEN IN CAVE STORIES
Advertisement
Silvia Frisia, Nicole Pierce and Pauline Treble
The past is the key to the future
peoples of the South pacific tell stories of male rain, Te Ihorangi, and female light mist, Inewhai. They usually alternate with the seasons, but there have been years with only little rain, when crops withered and people starved. And there were years when furious winds, rain, floods, and storm surges brought destruction. Crops rotted, people could not go fishing, and they starved. Today, food is sourced from far away, but tropical cyclones can still hinder cargo boats and planes, leaving pacific islanders without essential goods for months. The South pacific stretches from Australia to South America and includes thousands of island nations spread across a vast region that is highly exposed to natural disasters. Life in this island network is threatened by the changing nature of tropical cyclones as they become stronger with global warming. Just like we forecast daily weather, we need to predict future extreme events, such as tropical cyclones and drought. But our knowledge of climate in the South pacific is limited by a short record of weather data. We can't travel back in time to collect more data, so we look at long archives found in natural materials that give clues about past rainfall and droughts. We study the clues that are held deep underground, inside cave stalagmites.
Figure 1: Location of the Cook islands and what to do when you get there … snorkeling and caving! Figure 2: From living corals to limestone.
The Cook Islands: From coral reefs to stalagmites
We go to the Cook islands (Fig. 1) because there are many caves there carved into ancient coral reefs, which have turned into limestone rock over thousands of years (Fig. 2). Limestone is formed from the mineral calcite,

Figure 3: Dissolution of limestone and sources of chemical components that enter into the cave in the dry and wet seasons, as seen through the layers of stalagmites. The size of the bubbles reflects the proportion of compounds entering the cave in the wet and dry season.
DRY WET
which contains calcium (Ca), carbonate (CO3), and tiny quantities of other components, such as strontium (Sr).

Calcite is slowly dissolved by the rain. Above the cave there are trees and ferns. Their roots breathe and give off carbon dioxide (CO2). This CO2 combines with the rainwater to form carbonic acid (H2O + CO = H2CO32 ), which is more efficient than rainwater alone in dissolving the limestone (Fig. 3). How do caves record changes in rainfall?
rainwater that flows into the cave passes through pores and fractures of the host rock. This water is very concentrated in dissolved chemical components originating from the rock, such as Ca and Sr. When this water enters the cave by dripping from a stalactite, it splashes onto the floor forming a stalagmite. Some of the dissolved CO2 is able to escape into the cave air – a process called degassing – and new calcite crystals are deposited on top of this stalagmite. When climate is dry, these crystals contain Ca and very small amounts of Sr and form a stalagmite layer that has no pores and is translucent (somewhat dark). But when it rains too much and destructive cyclones hit the islands, the rainwater flows much faster into the cave. Organic compounds that are transported from the soil carry with them chemical elements from the soil, such as sulfur (S) and phosphorous (p). These organic compounds, S and p, are not parts of the mineral calcite. imagine building a house and mixing glass spheres and clay bricks. it is impossible: there will be empty spaces between the spheres and the bricks. This is what happens to each stalagmite layer that grows in the wet season. There is a mixture of building blocks (Ca and CO3) and spheres (the organic compounds plus S and p). Thus, the "wet season" layers will have hundreds of tiny pores and because of these pores, they will look milky-white (see Fig. 3 for the whole story).

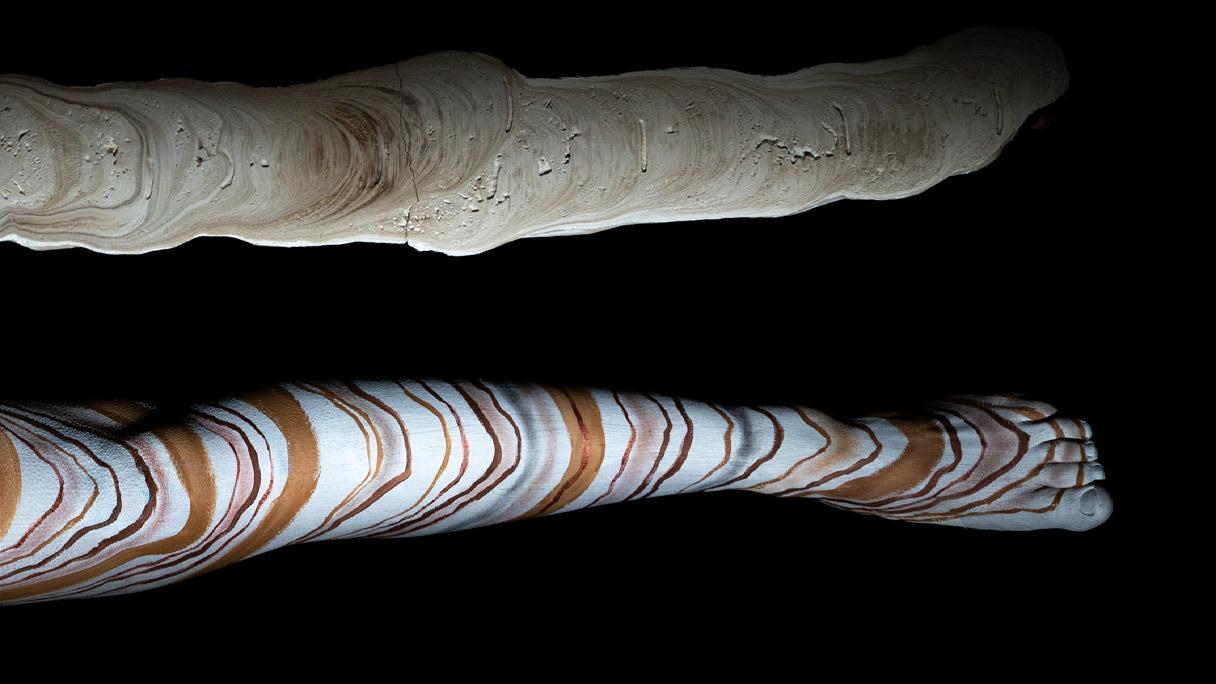
Figure 4: Cross-section of our 3000-year-old stalagmite and chemical maps from the synchrotron for strontium, phosphorous and sulfur. When Sr has high concentration (light blue), p and S have low concentration.
Distance (mm)
Age (thousands of years before present) How do we know when the climate changed?
Layers in the stalagmite start to resemble tree rings, or pages in a history book that you cannot simply read with your eyes. Years that are wet will be recorded by layers of milky-white and porous calcite containing organic compounds, S and p (Fig. 4). Compact layers with Sr mark dry years. Now we have the clues we need to read our book of climate change. Well, not quite yet! We first need to put an age to this record of climate change. To do this, we use radiometric dating. Tiny amounts of the uranium isotope 234U that are trapped inside the stalagmite crystals decay into the thorium isotope 230Th by a precise rate over time. We also count the annual layers between two radiometric ages. Now we have our climate calendar.
How do we gather climate information? in the cave we collect dripping water and measure certain chemicals in the water and the temperature and relative humidity of the cave. This is how we know that when it rains too much, there will be more material from the soil on the top of a stalagmite: p from plants and S that is transported from the sea by storms. in the lab, the stalagmite layers are revealed when we cut the stalagmite open (Fig. 4). There are many techniques that help us find clues about past climate. Many researchers measure the isotopes of the oxygen (O) atom within the calcite. isotopes of an atom have a different number of neutrons in the nucleus. Scientists measure the proportion of the light O isotope, which has 8 neutrons (O16), to the heavy O isotope (O18), which has 10 neutrons. in the South pacific stalagmites, more rain results in more O16 within the calcite and droughts in more O18. But it is difficult to measure O isotopes in the very thin layers of our stalagmites. Thus, we use another method that detects how chemical compounds vary year after year. With a special X-ray machine, known as a synchrotron, we obtain a map of the amount of chemicals picked up from the rock and from the surface for each stalagmite layer, even when this is so thin that one can only see it with a microscope. A synchrotron is many times bigger than your doctor's X-ray machine! it excites Sr, p, and S in the stalagmite, causing the electrons in these atoms to jump from the inner orbit into an outer orbit. Before falling back to the inner orbit, they emit a type of radiation called fluorescence. The synchrotron transforms the fluorescence into a colorful map, revealing "clues" to climate change. We see that there are many milky layers with more p and S (Fig. 4). These record many powerful cyclones. plus, when we see more Sr in several adjacent compact calcite layers, we know this represents long droughts. These droughts influenced the history of the pacific long before we started taking instrumental measurements.
0 ppm 200 ppm
Stalagmites and other stories Looking at the patterns of the layers and their chemical fingerprints, we found that very dry or very wet periods lasted much longer than 10 years, which is a long time when food and other necessities are in short supply. We put precise ages to these wet and dry periods seen on the synchrotron maps, then compared our stalagmite data with information obtained through other methods and by other researchers. For example, we discovered that about 1000 years ago there was a drought that lasted many decades (in yellow on the big computer screen in Fig. 5)! Archaeologists tell us that polynesians built sophisticated canoes and sailed across the pacific Ocean in search of land where they could grow their most nutritious plant: taro. They located this land in the Cook archipelago. The polynesians were fortunate, because after they landed in the Cook islands the long drought ended and it was followed by about 100 years of wet summers about 900 years ago. Our stalagmites tell us that Te Ihorangi rains helped the farmers to provide nutritious food for their children and the entire population (wet period in blue on the big screen). And, in fact, archaeologists discovered that about 900 years ago the polynesian settlers burned the forests on the Cook islands to plant more and more taro. The climate was good for taro crops, so life was also good. Our climate book has more pages than the instrumental record, which helps us to better model what the climate in this region may be like in the future. it also improves our understanding of how humans have coped in the past and might cope in the future with climate change in the pacific. Better climate models and better knowledge about how climate shaped societies and their resilience to climate change will help the pacific nations devise a sustainable future and protect communities, their culture, and their land.
Figure 5: Our scientist uncovering stalagmite secrets. The big screen shows our stalagmite's section, dated 1000 to 900 years ago (or years 1000 and 1100 Common Era), and the interpretation of high and low Sr. The yellow bar marks many dry years and the blue bar many wet years. And coffee is a great help!