11 minute read
Don’t Jump To Assumptions


Bernard Serote (South Africa) and Bheki Nkomo (Kenya), Qnum, discuss how bulk stock surveyor assumptions can be responsible for compounding inventory shrinkage problems.


Bulk stock producers conduct periodic stock surveys, in order to reconcile physical stock balances with the fi nancial records, as a control measure that aims to ensure the accurate reporting of stock. As part of this process, independent stock surveyors are enlisted to evaluate the stock levels and provide fi gures which are then compared to the balance on the fi nancial records. The frequent result is a surveyed level of stock which is less than the one on the fi nancial records. This prompts the fi nancial offi cer to write-off the additional stock reflected on the records. Annually these write-off losses contribute signifi cantly to reducing an entity’s profi tability.
Physical stock survey methods employed to verify stock levels in dry bulk operations range from the archaic dipping and counting methods to the more advanced scanners and drone systems. Over the years, the methods have increased in accuracy in terms of accounting for the volume or number of units present in an operation. The challenge is that these surveys are undertaken periodically, limiting the real-time visibility, and the conversion from the volume or count measurement to a tonnage equivalent results in signifi cant errors due to varying bulk densities of material.
The bulk density factor – which is used to convert to tonnage – varies greatly, depending on how the material is contained and the level of moisture present. This leads to dry bulk plant operations experiencing recurring reconciliation frustrations.


What if the independent survey methods are wrong?
If the independent survey methods are wrong, companies could be unnecessarily incurring write-off losses due to incorrect survey method assumptions.
Qnum Analytics recently assisted a soda ash producer in assessing the scientifi c soundness and assumption validity of the methods being applied by an appointed independent stock surveyor. The surveyor assessment methodology and key fi ndings are highlighted next.
Aim
To determine the material mass of dense soda ash stored in three silos and compare the readings with the independent stock surveyor outputs. The analysis further sought to establish the inherent error margins in the silo dip stock survey method at a 95% confi dence level.
Background theory
The bulk density of dense soda ash used was 1.10 kg/m3 . Volume of the cylinder used is given as v=r×2×h (where r is the radius and h is the height of the cylinder based on the dips).
Experimental method
The apparatus for the experiment consisted of a fi eld tape to measure fi ve dip ports (circles) and four hatches (squares), as depicted in Figure 1.


Procedure
10 independent tape measure throws into each port were conducted and captured per port – 90 independent throws per silo. The height (m) at which the field tape measure hit the material in the silo was captured per throw in the silo port template. ‘Independent throw’ means the tape measure was thrown and pulled out consecutively to ensure zero correlation between the throws. This process was repeated for all three silos.
Results
The results for the experiment were as follows: Mass for Silo 1: 3411.11 ±152.4 (t). Mass for Silo 2: 7688.58 ±129.77 (t). Mass for Silo 3: 1518.67 ±308.83 (t).
As a result, from this experiment it can be concluded at a 95% level of certainty that the mass of the dense soda ash in Silo 1 was 3411.11 t, Silo 2 was 7688.58 t, and Silo 3 was 1518.67 t. A results comparison between the statistical sampling method’s results and the surveyors’ results can be found in Table 1.
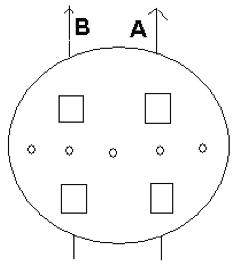
Figure 1. Cross section of the silo ports.
Table 1. Stock survey method comparison results
Surveyor Qnum experiment Variance 3436 t 3411.11 t 24.89 t 7631 t 7688.58 t 57.58 t 1251 t 1518.67 t 267.67 t
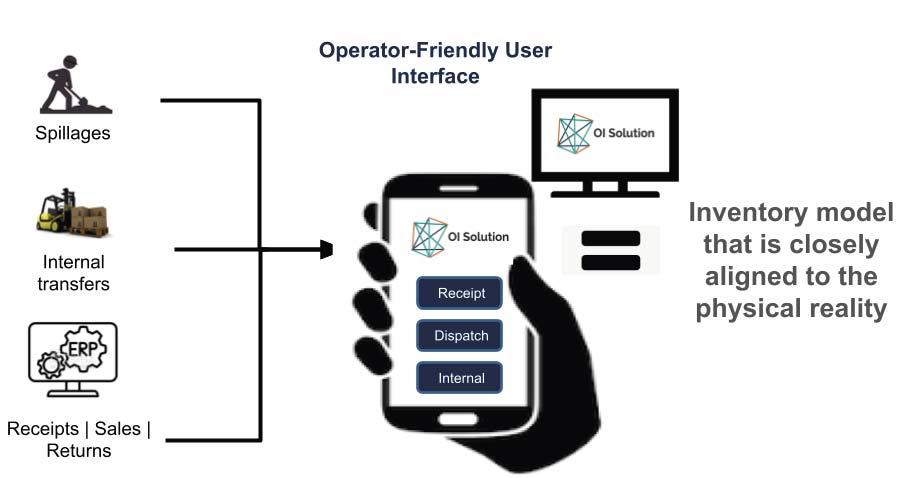
Figure 2. OI Solution flow.
Findings
The surveyor made mathematically incorrect extrapolations in an attempt to predict/guess the material by the side of the silos. The extrapolations added two data points per silo. The surveyor subtracted 0.2 m on the hatch dips in an attempt to match the hatch height to the dip ports. The extrapolated values by the surveyor were never reported in previous silo level reports, which prevented a timely detection of the issue. Silo 3 has a higher variance and error margin because the silo was almost empty and the design of the silo affects consistency.
Impact
Due to the fact the readings conducted by the auditor per silo were 11 instead of nine, the data manipulation skewed the mean mass of the material in the silo more to one side and elevated variance. This data manipulation raised questions regarding data integrity and reporting.
Highlights
Despite the surveyor’s data manipulation, it was established that the readings still fell within the 95% confidence interval. This further illustrated that the dipping method has an inherent margin of error which businesses must be aware of and proactively address, or find alternative measurement methods. The surveyor agreed to stop making the extrapolations that were costing the business heavily. The business had historically written-off up to 1500 t worth of stock in a single quarter due to this type of data manipulation by the stock surveyor who had been conducting the surveys for 12 years.
Through the use of its OI Solution, Qnum Analytics can assist dry bulk producers to proactively manage these types of issues that elevate inventory shrinkage losses.
Transforming the management of bulk inventory
The dry bulk industry has traditionally been hesitant in adopting advances in technology and the traditional practices have at times exposed signifi cant fi nancial losses over the years. In recent times, however, corporations have started embarking on large scale operational transformations which have introduced some complexities, making it diffi cult to accurately match stock on the floor with fi nancial records. Key concerns that emerge include: How accurately does the stock survey method account for the stock on the floor? What is the impact of stock survey technology that is incorrectly calibrated? Does the stock survey method get the same reading whether stock is wet or dry?
Can the client verify the readings produced by the stock survey technology? With surveys that are performed periodically, how can an accurate real-time stock level reading be obtained?
The team at Qnum Analytics has been working to create an innovative way of achieving continuous reconciliation by tracking stock balances at a transaction level. The unique method ensures that the control environment aligns with all audit protocols and ensures real-time visibility, which empowers stock planning for improved customer service and operational effi ciency.
Qnum Analytics is a cross-functional team of data scientists and industrial engineers that are committed to bringing control and simplicity to the management of bulk stock.
The company was incorporated on 22 February 2018, while its founders had been working on the product since April 2016, with the aim of bringing about a fundamental breakthrough in the manner in which stock is managed in the manufacturing and distribution sectors.
The team identifi ed an opportunity to develop a solution that would bridge the integration gap between fi nancial records and the stock measurement techniques by tracking stock transactions in terms of mass and the audit equivalents. That was the pivot to becoming a data-science powered SaaS provider, providing major cost savings for bulk stock producers.
Validation of business value in a dry bulk chemical distribution plant
The case study was conducted on the largest distributor of natural sodium products in Southern Africa with a 65% market share. Their distribution capacity for soda ash is in excess of 320 000 tpy.
The soda ash producer was incurring millions of dollars’ worth of inexplicable losses due to inventory write-offs quarterly, despite signifi cant investments in supply chain inventory management systems.
In response to the COVID-19 pandemic, the soda ash producer sought to explore opportunities to stop the bleeding and drive the sustainability of the business. Stock management practices had historically been a point of contention at the end of every quarter as inventory write-off losses were incurred when the independent physical stock surveys were conducted. The soda ash producer had invested signifi cant time and resources in attempts to resolve the stock challenges. These efforts included investments in various scanner survey systems from different providers, however these only yielded yet more frustration with the delivery of inconsistent physical stock measurements or the periodical malfunctioning of the devices.
Approach
In a further attempt to rectify the situation, the soda ash producer enlisted the assistance of Qnum Analytics, the providers of a smart inventory reconciliation software (OI

Dry Bulk Magazine Online


The home for the latest dry bulk industry news, analysis, comment and events
Solution) to assist in isolating the root cause of variances and provide the means to control write-off losses moving forward.
The approach that was devised was a two-month trial (1 August - 30 September 2020) of the OI Solution, in order to unpack the source of discrepancies. At the end of the quarter, the OI Solution and the current inventory accounting systems – enterprise resource planning (ERP) and adjusted movement schedule – were then compared to the independent stock surveyor results to get a comparative analysis of the ease of reconciliation and magnitude of discrepancies reported.
Key findings
The trial run was conducted and the following stock challenges were identifi ed as the root causes of the stock reconciliation frustrations: An inability to track internal material movements in ERP created a blind spot in terms of the audit trail. Stock measurement assumptions applied by the independent surveyor exposed the producer to the risk of undervaluation of stock because the ERP system did not carry a bag count balance that could be compared consistently with the stock count, in order to avoid conversion errors (bag to tonnage). Limited reconciliation of discrepancies between invoice weight and actual weight stock receipts at the distribution plant resulted in an inflated stock value on the financial records. Limited reconciliation between dispatched weight and client received weight (invoice value) resulted in a higher stock value on the financial records which was misaligned to the actual values. Internal material handling mechanisms (conveyors, mobile conveyors, hoppers, silos, etc.) produce a significant amount of spillage which may not have been accurately accounted for on the financial records and overlooked by the independent survey.
Compared to the adjusted movement schedule and ERP software, the OI Solution saved the soda ash producer ±85% in unnecessary stock write-off losses. The OI Solution produced a smaller variance comparatively and this is primarily due to its capacity to isolate the causes of variance. The OI Solution allows for the collection of data at its source, in order to promote enhanced visibility and control.
Conclusion
Inventory accounting problems arise when physical stock differs from that which is stated in ERP systems. The system then gets the sharp end of the sword in the blame game for such discrepancies, when it is usually human error that has caused the problem. Every transaction that occurs regarding material movements must be recorded in the system to keep it accurate. Someone should be responsible for each activity within the system to ensure its reliability and accuracy. In the case study outlined in this article, that someone was Qnum’s OI Solution.
ADVERTISER’S INDEX
OBC Bedeschi S.p.A
15 BEUMER Group
25 Becker Marine Systems
51 Bosch Rexroth
35 DCL
IBC, 22, 55 Dry Bulk
13 Energy Global
40, 41 Great Lakes St. Lawrence Seaway
02 Jotun A/S
35 Kumera Corporation 09 Liebherr-MCCtec Rostock GmbH
31 Martin Engineering
21 MRS Greifer GmbH
IFC NEUERO
47 NORD DRIVESYSTEMS
36 Primasonics
OFC, 29 SCHADE Lagertechnik GmbH
05 Telestack
07 Vortex Valves

