10 minute read
The perfect blend?

Michael Kasch, ILF Consulting Engineers, Germany, explores an example study demonstrating the impact of hydrogen blending on the transport capacity of natural gas pipelines.

ipelines can be optimally designed for transport of pure hydrogen. Existing pipelines can be redesigned and modified to meet the requirements for transporting pure hydrogen. If the available quantities of hydrogen do not match the dimensions of existing long-distance pipelines or backbones of distribution networks for simply replacing natural gas by hydrogen, the alternative option is blending hydrogen into the gas stream. This article outlines results and conclusions of numerical investigations on the transport capacity of high-pressure gas pipelines if hydrogen blends up to 30 mol% are conveyed. The following example pipeline (Figure 1) was used to cover typical and partly challenging conditions


like offshore sections and substantial alterations of elevation.
Fluid flow through pipelines is determined by the three conservation laws for ‘mass’, ‘momentum’ and ‘energy’. Combined with equations describing the physical properties of the fluid, these conservation laws form a set of equations to be solved simultaneously for the calculation of pressure, temperature and flow profiles along pipelines. The additionally required fluid properties are ‘density’, i.e. a thermodynamic equation of state (EOS), ‘specific heat capacity’ (cp), and ‘viscosity’. All three of these parameters are functions of pressure and temperature (for given gas composition) showing significant real-gas behaviour at pressures and temperatures usually required for efficient transportation of natural gas through pipelines. Furthermore, the characteristics of the conduit (pipe, coatings) and its ambient (e.g. soil, water currents, air) as well as the elevation profile have substantial impact on the thermohydraulic state of gas flow through pipelines. The fictive example pipeline profile depicted in Figure 1 is a 200 km pipeline of 0.9 m external diameter, 20 mm wall thickness and with internal (epoxy) and external (HDPE) coatings yielding an effective radial heat transition coefficient of 3.9 W/K m2 everywhere, i.e. no specific parameters for varying hydrological and geological conditions onshore and offshore considered here. It is only the ground temperature that varies from section to section in this example (see Figure 3). For all numerical calculations of this example the boundary conditions were given by an inlet pressure of 100 bar(g), inlet temperature of 40˚C (313.16 K) and an outlet pressure of 50 bar(g) at pipeline end. The intention of this paper is to investigate transport capacity losses under heavy load conditions on a highpressure gas pipeline carrying hydrogen blends. For the 200 km pipeline the selected pressure differential of 100 bar(g) down to 50 bar(g) represents challenging boundary conditions. Transport capacity is here defined as the maximum norm volume flow rate that occurs for given inlet and outlet pressure and given inlet temperature. An alternative definition for capacity losses would be the norm volume flow rate multiplied by the (net or gross) calorific value of the gas mixture. Norm conditions were chosen as atmospheric pressure and 0˚C (273.16 K). All thermodynamic parameters were taken from ‘Physical Properties of Natural Gases, N. V. Nederlands Gasunie, Groningen (1988)’. This includes a real-gas equation of state after Benedict, Webb and Rubin, as well as real-gas specific

Figure 1. Pipeline elevation profile.
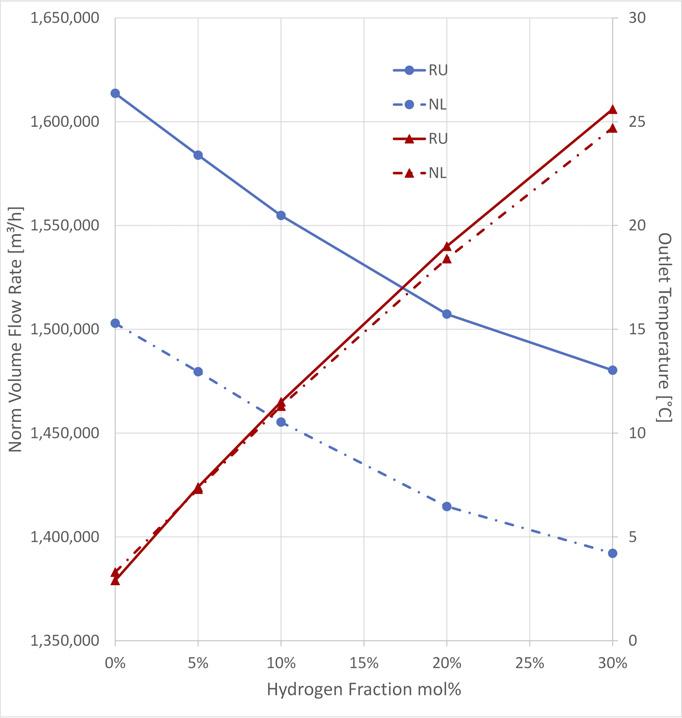
Figure 2. Transport capacity loss with increasing hydrogen fraction.


Figure 3. Temperature profiles (pure nat. gas vs. blend of 30 mol% with/without cooling).
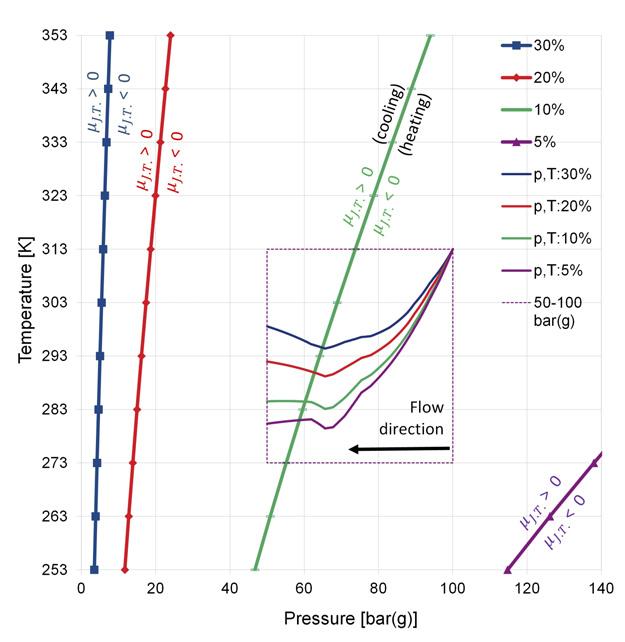
Figure 4. Joule-Thomson inversion curves relative to the p-T operating regime. heat capacity and viscosity for natural gas mixtures. Flow-induced friction was calculated after Colebrook and White with a roughness of 6µm. More details of the numerical model or a more sophisticated equation of state are not important for this article, as the intention is to demonstrate principle aspects of the limiting factors on pipeline transport capacity for hydrogen blends with natural gas.

Findings and conclusions Two natural gas types were investigated to demonstrate the impact of gas composition on the transport capacity: typical Russian natural gas (RU), rich of methane, and typical Groningen (NL) natural gas with weigh less methane due to approximately 14 mol% of nitrogen. The blue curves in Figure 2 show the capacity gap between RU and NL natural gas for the given boundary conditions. The capacity gap between RU and NL natural gas turns out to be 7% for pure natural gas to 6% at 30 mol% hydrogen fraction. The capacity loss caused by hydrogen blending of 30 mol% was found to be approximately 8% for both gas types.
The reduction of transport capacity with increasing hydrogen fraction is on the one hand a direct consequence of the generally reduced density of hydrogen blends relative to pure natural gas. But this is emphasised by the fact that the temperature along the entire flow path remains higher with hydrogen blends than for pure natural gas, which leads to even lower density. Figure 3 shows the temperature profiles of the example pipeline (Figure 1) for pure RU natural gas (blue curve) in comparison with a blend of 30 mol% (red curve). Increasing outlet temperatures with successively growing hydrogen fraction are illustrated in Figure 2.
Just to get an idea of what this means in terms of energy transport; in this example the loss of transport capacity with 30 mol% of hydrogen relative to pure RU natural gas turns out to be 133 380 Nm3/h (or 383.2 t/h) which corresponds to a reduction of delivered calorific energy of 4.826 GWh/h (4.208 GWh/h net), obviously worth being regained.
A combination of the energy and the momentum equation yields the basis for calculating the temperature profile of a pipeline. Mainly three effects determine the gas temperature profile along the pipeline: the general tendency of the gas temperature equilibrating with the ambient due to radial heat exchange; frictional heat production; and the Joule-Thomson effect. For ordinary natural gas under usual pipeline operating conditions
the Joule-Thomson factor is positive. Thus, the gas stream is being cooled while the gas is flowing towards lower pressure. However, with increasing hydrogen fraction the Joule-Thomson factor of the blend is changing sign, thus heating up the gas stream in flow direction (cf. Figure 4). All three effects are superposed. Depending on the conditions the long-distance equilibrium temperature can therefore be distinctly above or below the ambient temperature. Figure 3 shows two such cases. The long-distance temperature of pure natural gas is distinctly below, whilst the temperature of the 30 mol% hydrogen blend is everywhere above the ambient temperature.
One option to improve the transport capacity for hydrogen blends would be increasing the density of the gas stream by cooling. Considering two intermediate coolers, one at 110 km, the second one further down at 160 km, and applying the rule of thumb that the electrical power to feed the cooler can be estimated at 1% of the thermal power that has to be extracted from the gas stream, they would need approximately 100 kW and 60 kW of electrical power for cooling down to 5˚C. Not to forget the cooler at the inlet (km 0) which would require an additional 180 kW of electrical power to cool the inlet gas stream down to 15˚C instead of 40˚C. Of course, all cooling temperature values in this example may not be achievable under all regional and seasonal ambient conditions. In total the example values used here would result in 0.34 MW of electrical cooling power.
Compared to the uncooled case of the 30 mol% blend we would regain transport capacity of 5765 Nm3/h or 46.4 MW net calorific power (50.8 MW gross). Thus, even electrical cooling would pay off, at least from the OPEX point of view.
The Joule-Thomson factor itself is pressure and temperature dependent. The curves with markers in Figure 4 are the Joule-Thomson inversion curves, i.e. those tuples ‘p,T’ where the Joule-Thomson factor is zero: µJ.T. = 0. Left of each inversion curve we find normal Joule-Thomson behaviour of decreasing temperature with decreasing pressure (µJ.T. > 0), i.e. cooling the gas stream in flow direction. Right of each inversion curve is the region where the Joule-Thomson factor is negative (µJ.T. < 0) which causes raising temperature with decreasing pressure, i.e. heating up the gas stream in flow direction.
The magenta dotted frame shows the operating envelope (of this example) with respect to pressure and temperature along the pipeline. The curves inside this frame are temperature profiles, not plotted as usual against distance but against the pressure values along the pipeline, starting at 100 bar(g) down to 50 bar(g), from the right to the left. The curves with equal colour belong together. The blue (30 mol% H2) and the red (20 mol% H2) p,T-curves are entirely located right of the blue and the red Joule-Thomson inversion curves. This means that the Joule-Thomson factor is negative (µJ.T. < 0) along the entire flow path. Thus, the temperature tends to be high. The green (10 mol%) p,T-curve intersects with the green inversion curve. Only that portion of the green p,T-curve left of the green inversion curve experiences the ‘usual’ Joule-Thomson behaviour. Obviously, the temperature is not further increasing like the blue and the red p,T-curves do there. Finally, the magenta p,T-curve (5 mol%) is entirely left of the inversion curve of the 5 mol% blend. Thus, at 5 mol% the gas stream experiences normal Joule-Thomson behaviour all the way down the pipeline. Obviously, the temperature profile close to the outlet points downwards as usual.
The lower the pressure range the lower is the capacity loss for given hydrogen fraction. If a pipeline is e.g. operated at medium pressure, e.g. 5...25 bar(g), the hydrogen fraction of the blend may be higher than 10 mol% without capacity loss caused by the inverted Joule-Thomson effect; the capacity loss due to the a priori reduced density remains, of course. This becomes obvious when shifting the dotted frame to the left and adjusting the pressure range to, in this example, 5…25 bar(g). The whole frame is then left of the inversion curve of 10 mol% and the thermodynamic behaviour of the blend is as usual. The higher the pressure, the stronger the adverse impact of hydrogen blending on transport capacity.
Summary High pressure is necessary to establish cost efficient transport through gas pipelines. Where transport of pure hydrogen is no option, e.g. if the existing pipelines shall be used but are not optimally dimensioned for the available quantities of hydrogens, blending with natural gas can be an option. However, such gas mixtures may cause substantial capacity losses in terms of throughput and energy delivery. Increasing hydrogen fraction is directly reducing the mass density and the energy density of the blend. The effect turns out to be more and more pronounced with increasing hydrogen fraction and even more the higher the operating pressure of the pipeline is.
One way out of this dilemma would be utilising all opportunities for natural cooling of the gas flow along the pipeline. Otherwise, the capacity losses can be so significant that even additional technical cooling (e.g. electrical coolers) would pay off. All sensible options of cooling the gas stream should be considered. Design of pipelines for transport of natural gas blends with hydrogen should include prudent analysis and evaluation on the intended pressure and temperature regime relative to the specific Joule-Thomson inversion curves of the blend to be conveyed (as presented in Figure 4).
The same applies to design calculations for gas processing, such as pressure reduction through control valves or vent lines and silencers. Whenever isenthalpic processes are involved the designer should be aware of where in the p-T plane the process is to take place relative to the individual Joule-Thomson inversion curve of the blend. As long as the Joule-Thomson coefficient is positive, everything will behave as usual. If parts of or the entire operating regime are located in areas of the p-T-plane where negative Joule-Thomson coefficients occur we might experience unusual thermal behaviour of the gas stream.


