


FY26 BUDGET BOOK

Introduction - Welcome to PPS
Budget Overview
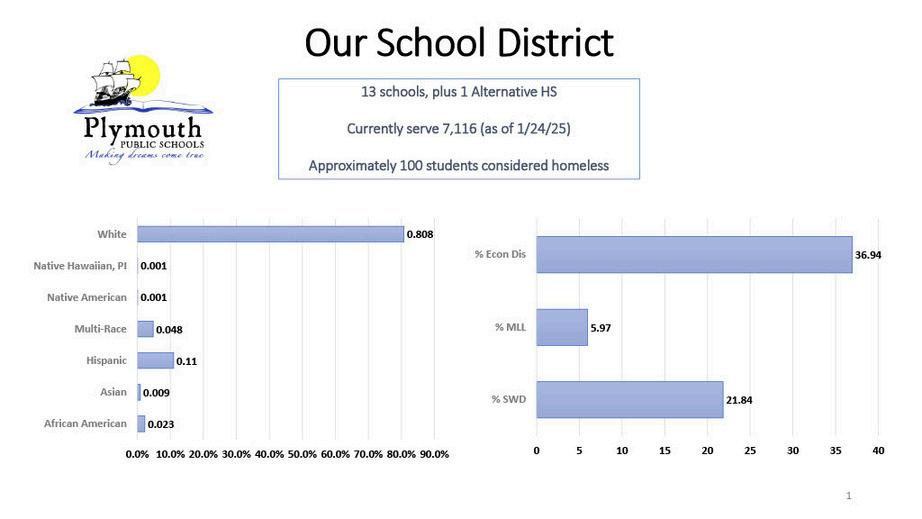
Our School District
Changing Demographic
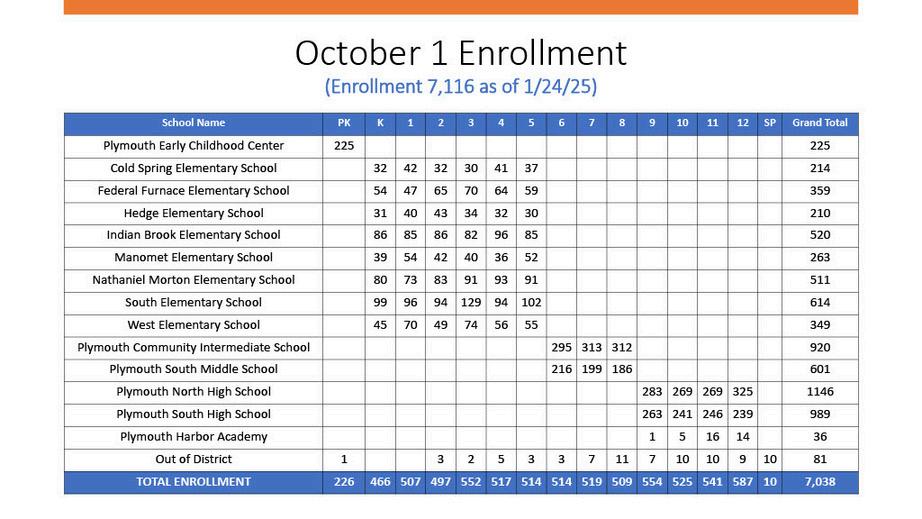
Declined Enrollment with Increased Needs
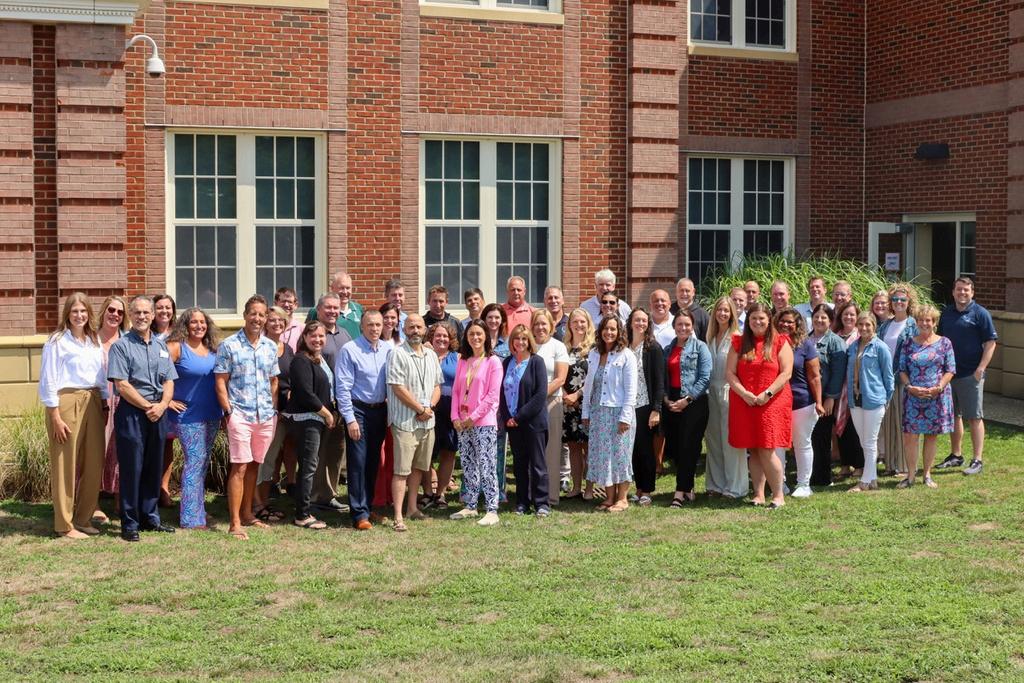
Our Staff
Guiding Principles in Budget Development
Funding to Build the FY26 Budget
FY26 Proposed Budget
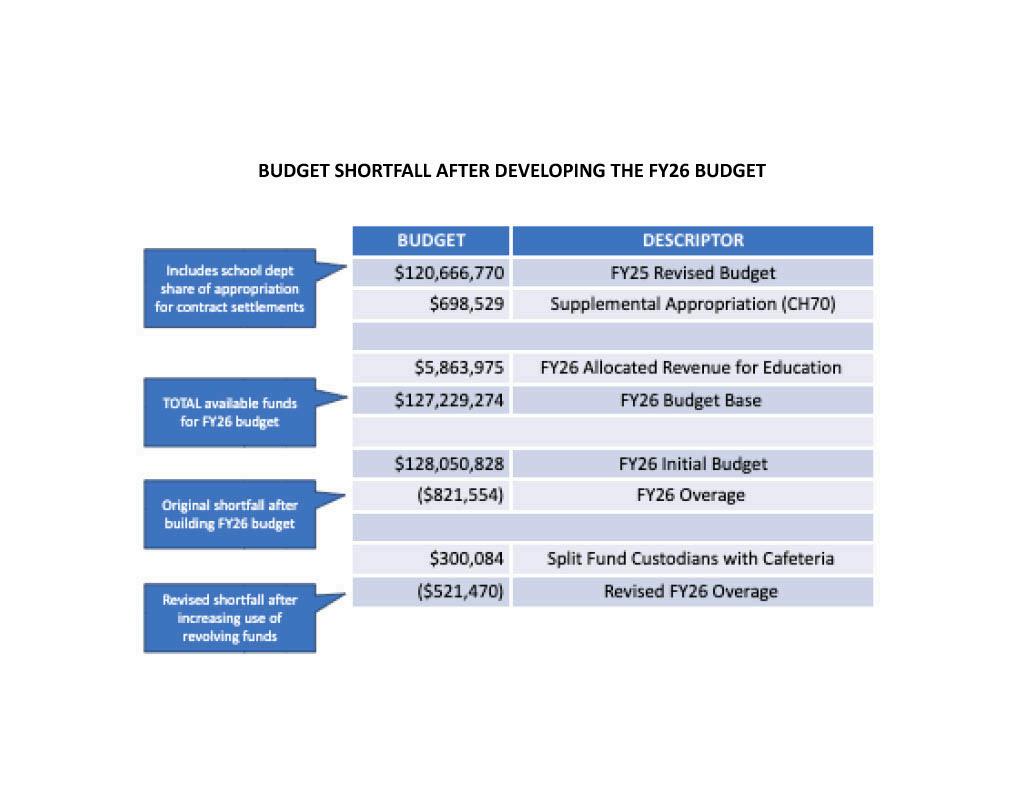
Budget Shortfall
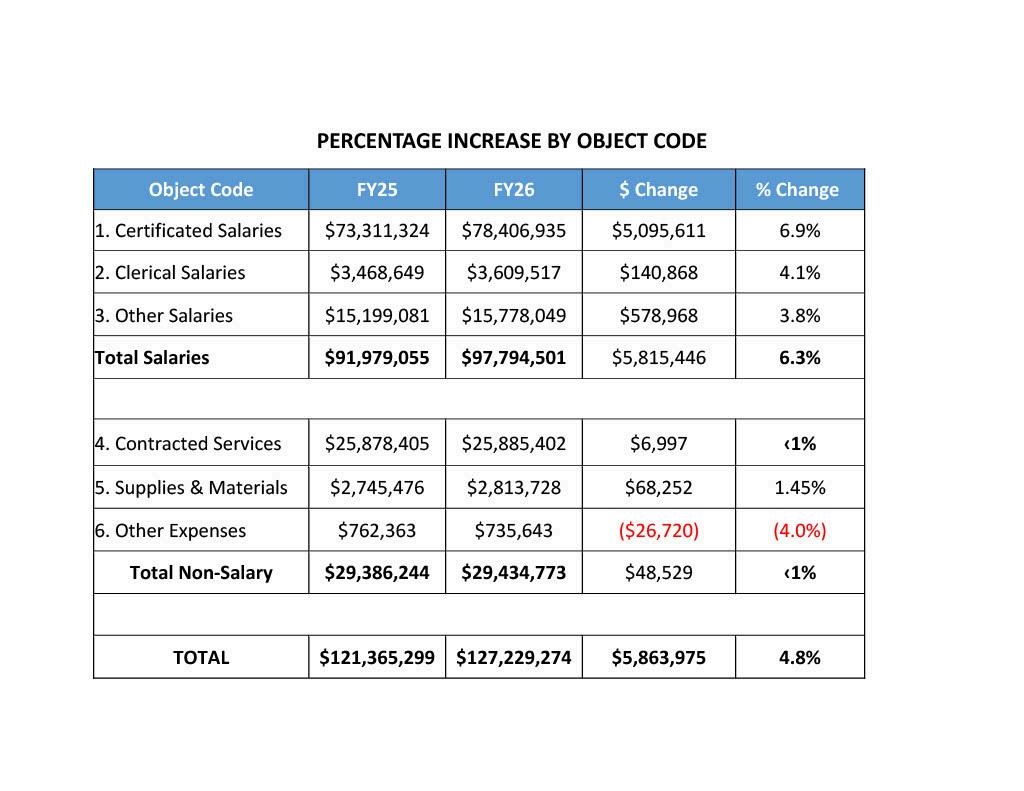
Percentage Increase by Object Code
Funding to Build the FY26 Budget / Revenue
Revenue - Grants
Revenue - Revolving
Per Pupil Expenditure
Significant FY26 Budget Drivers
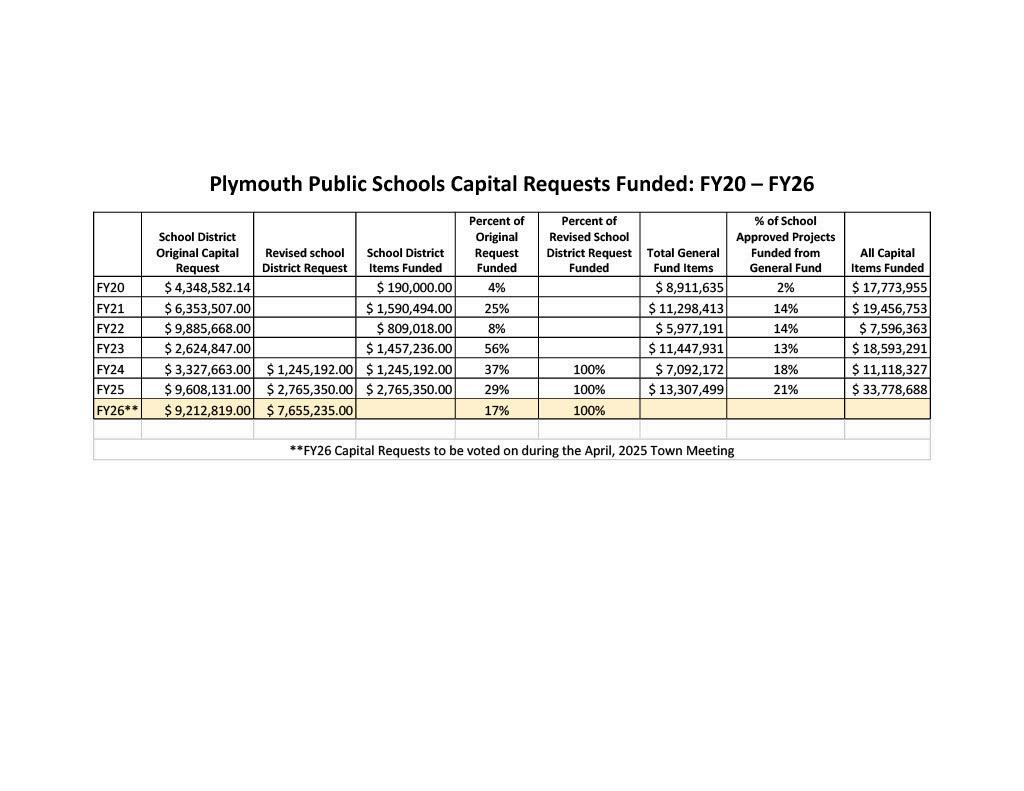
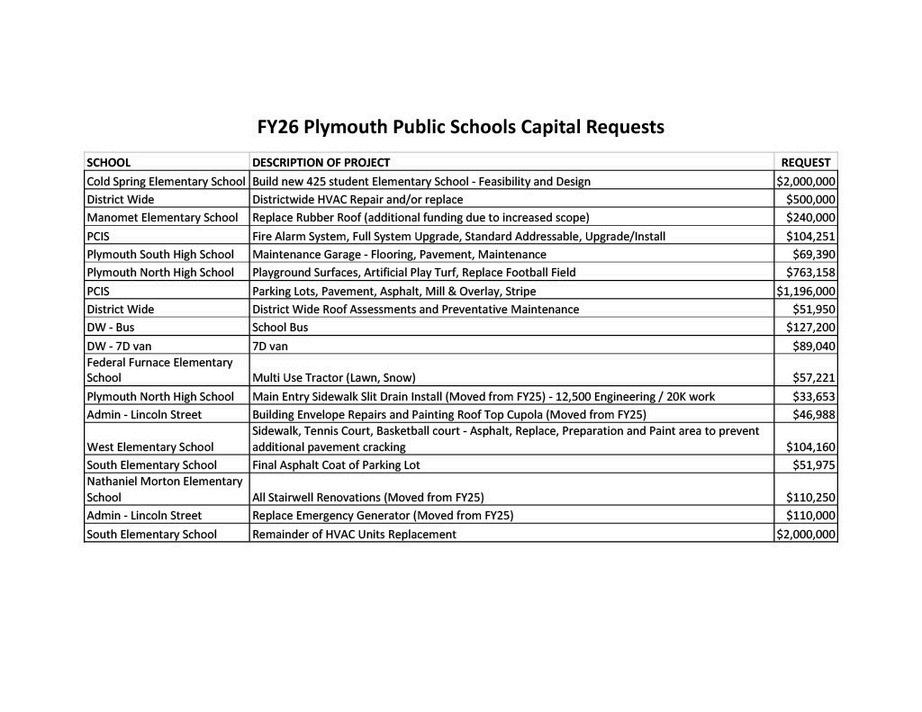
Capital Requests
Pupil Transportation
Facilities/Maintenance
Budget
and Engagement
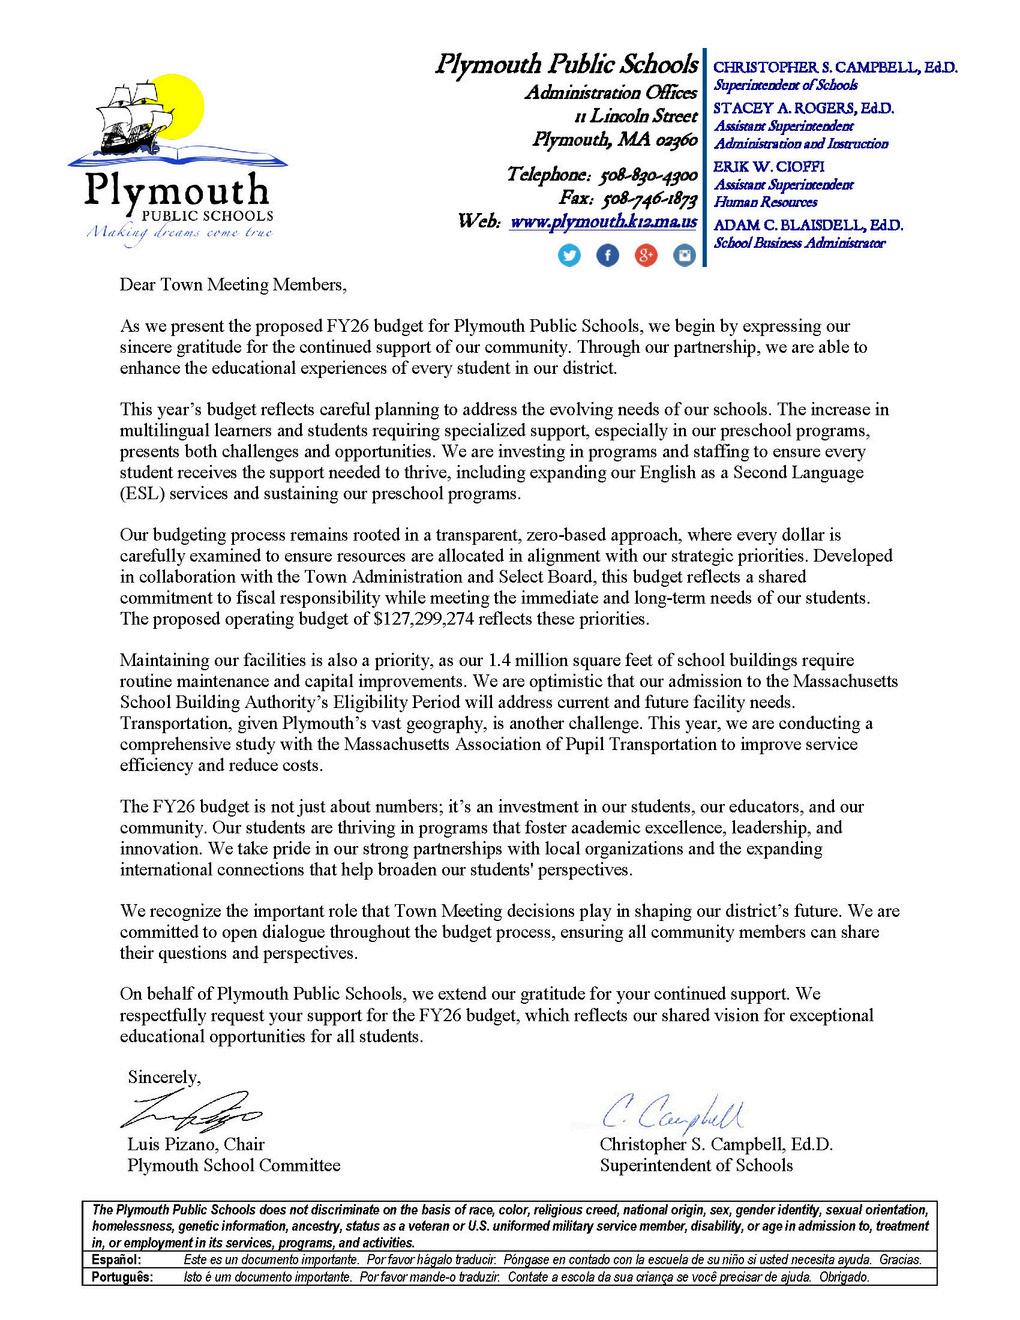
Welcome to the Plymouth Public Schools Budget Book. This publication provides a detailed overview of the financial decisions that guide our district’s operations, ensuring transparency and fostering community engagement. Whether you are a voting member at the upcoming town meeting, a parent, or a concerned citizen, this resource will help you understand how public funds are allocated to support our educational goals
Inside this Budget Book, you will find:
Budget Overview: A snapshot of the total budget for the year, comparisons to prior years, and an outline of our financial priorities.
Revenue and Expenditures: A breakdown of funding sources local, state, federal, and others along with a detailed look at how funds are spent on staffing, facilities, technology, and more.
Student Enrollment: Insights into how demographic shifts, such as increases in multilingual learners and students requiring specialized support, impact our budget planning.
Capital Improvements & Maintenance: Details on the condition of our facilities and ongoing maintenance and improvement projects to ensure a safe and effective learning environment.
Transportation & Technology: Information on efforts to enhance transportation services and investments in technology to support student learning.
Key Initiatives: A look at programs aimed at improving educational outcomes, increasing efficiencies, and supporting long-term sustainability
This publication also highlights our commitment to community engagement and budget transparency. We aim to provide clear, accessible information and encourage active dialogue with all stakeholders throughout the budgeting process.
Your involvement in reviewing and providing feedback on this budget is essential in ensuring that every dollar is spent wisely to benefit our students. Thank you for being an important part of the Plymouth Public Schools community.
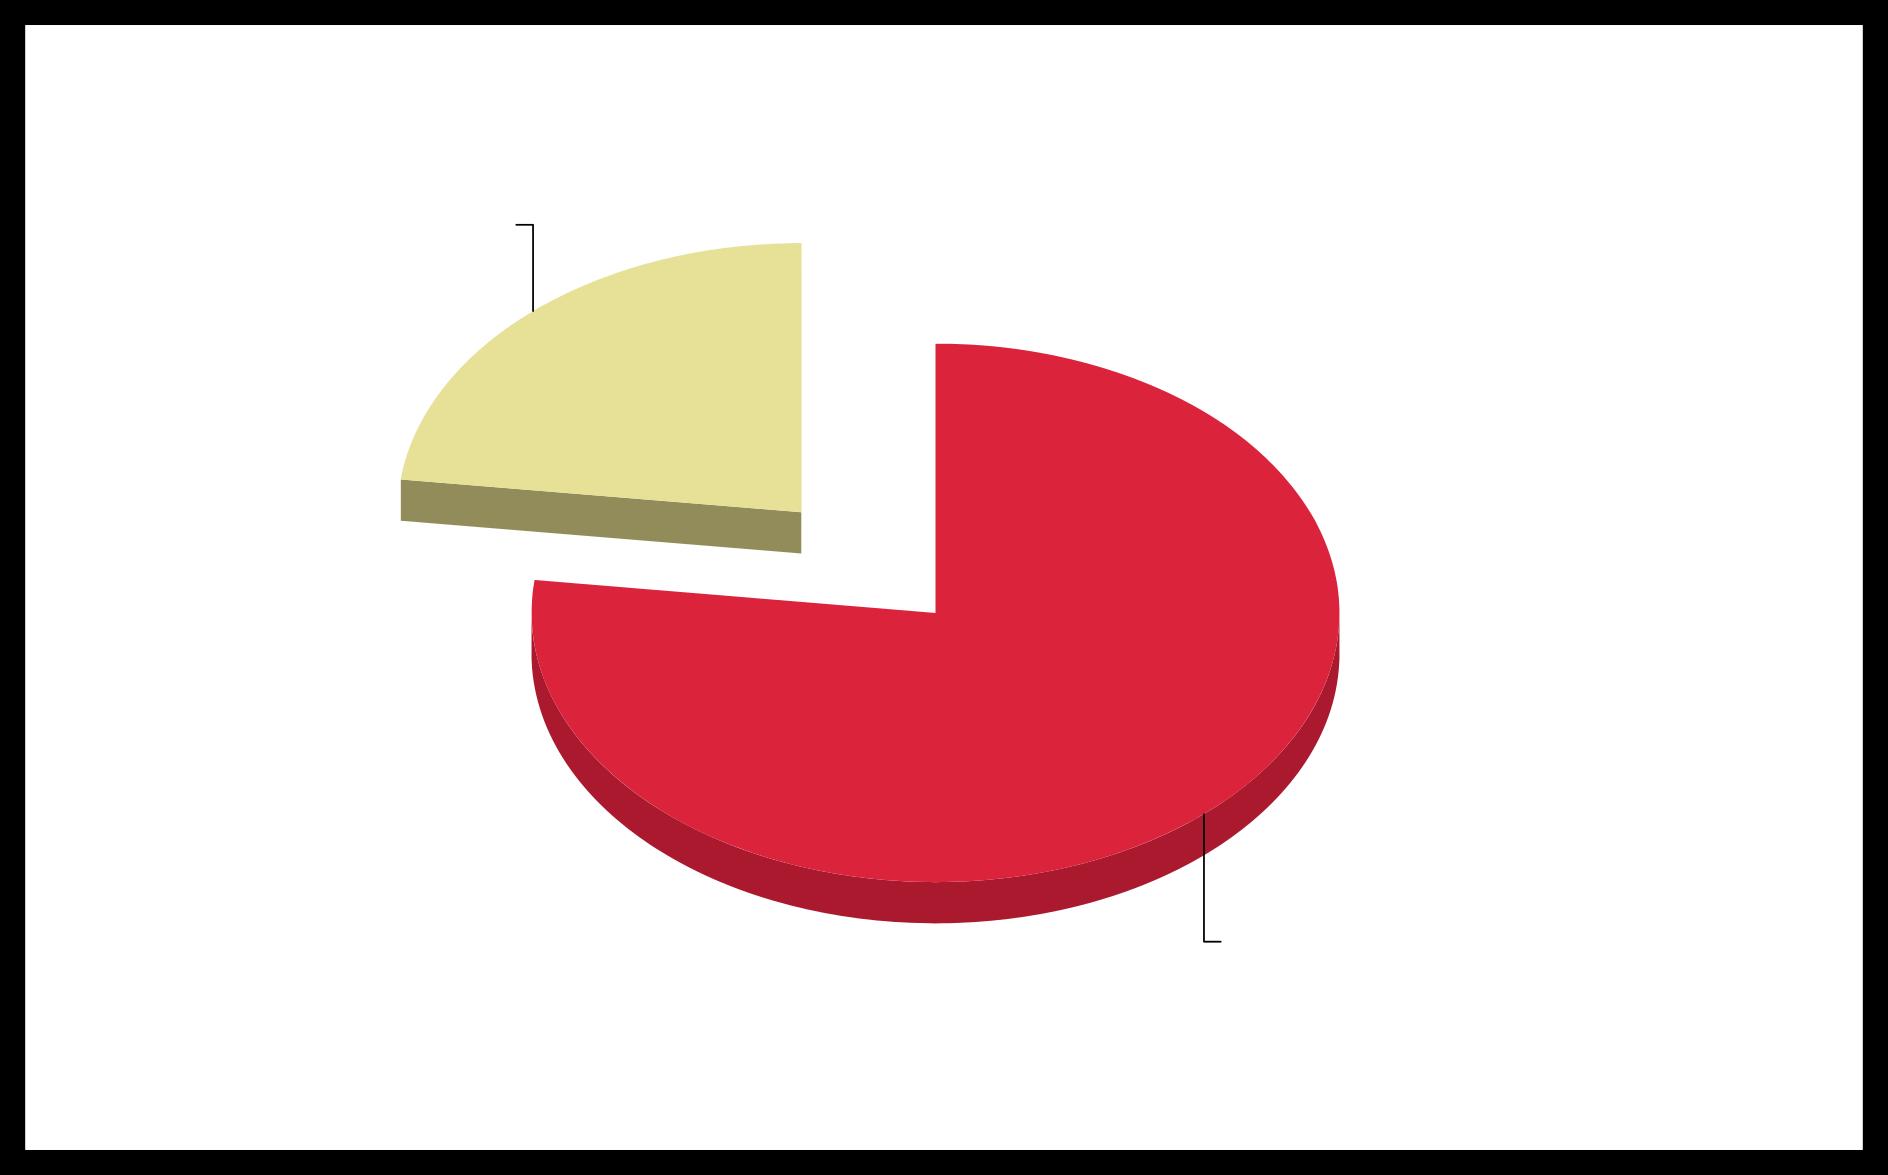
The School Department Budget, in its simplest form, is comprised of

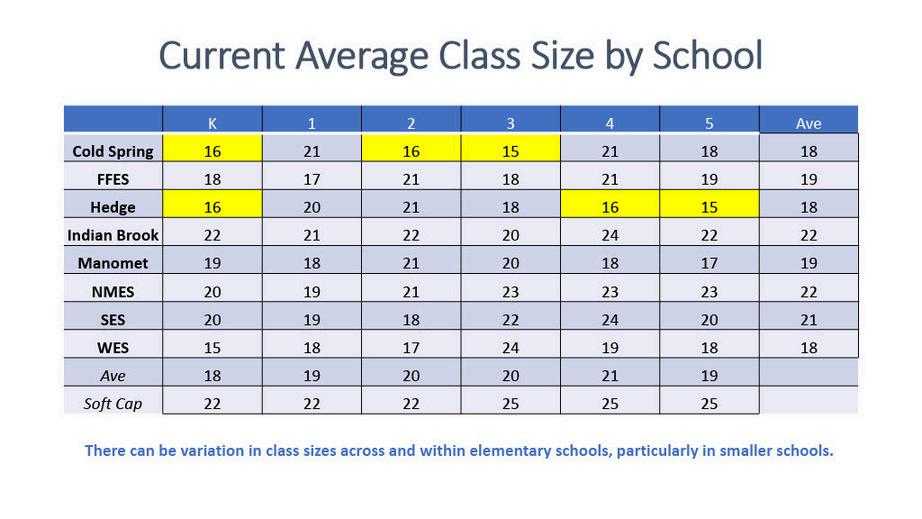
Across the district, the average class size tends to be 18 students in Kindergarten, 19 in 1st grade, 20 in 2nd grade, and 20 in 3rd grade For grades 4 and 5, the average class size rises to 21 and 19, respectively Smaller schools tend to show greater variance in class sizes across different grade levels. Our "soft cap" for class sizes is important to note because it helps guide our class size decisions. These are guidelines that help ensure class sizes remain manageable for both students and teachers. In general, class sizes fall within or below these caps. Ultimately, the district strives to balance class sizes in line with the soft cap to maintain a quality learning environment for all students
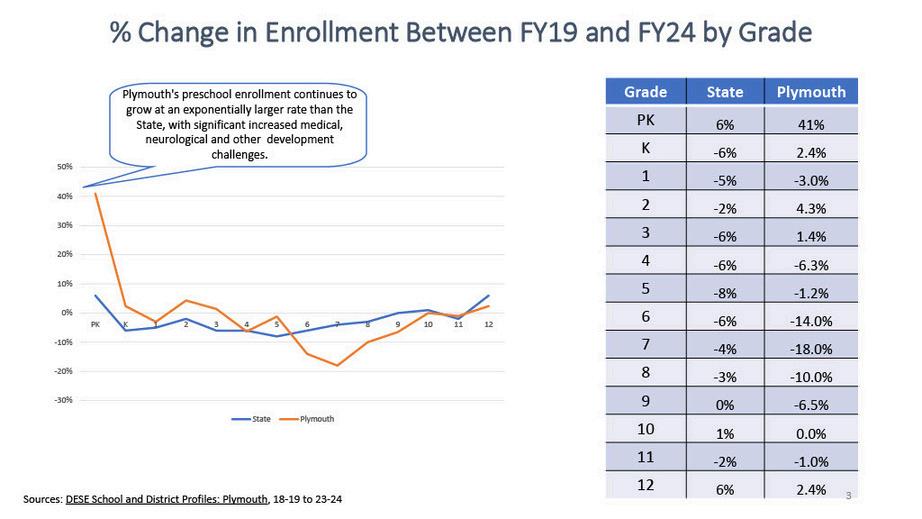
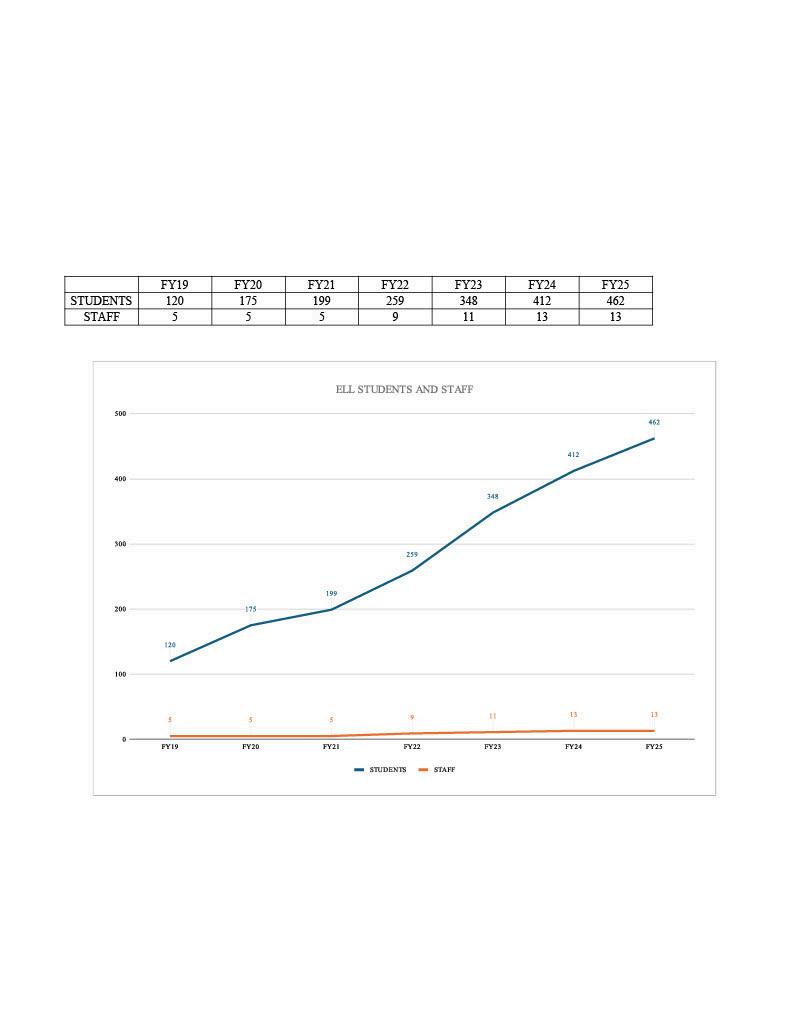
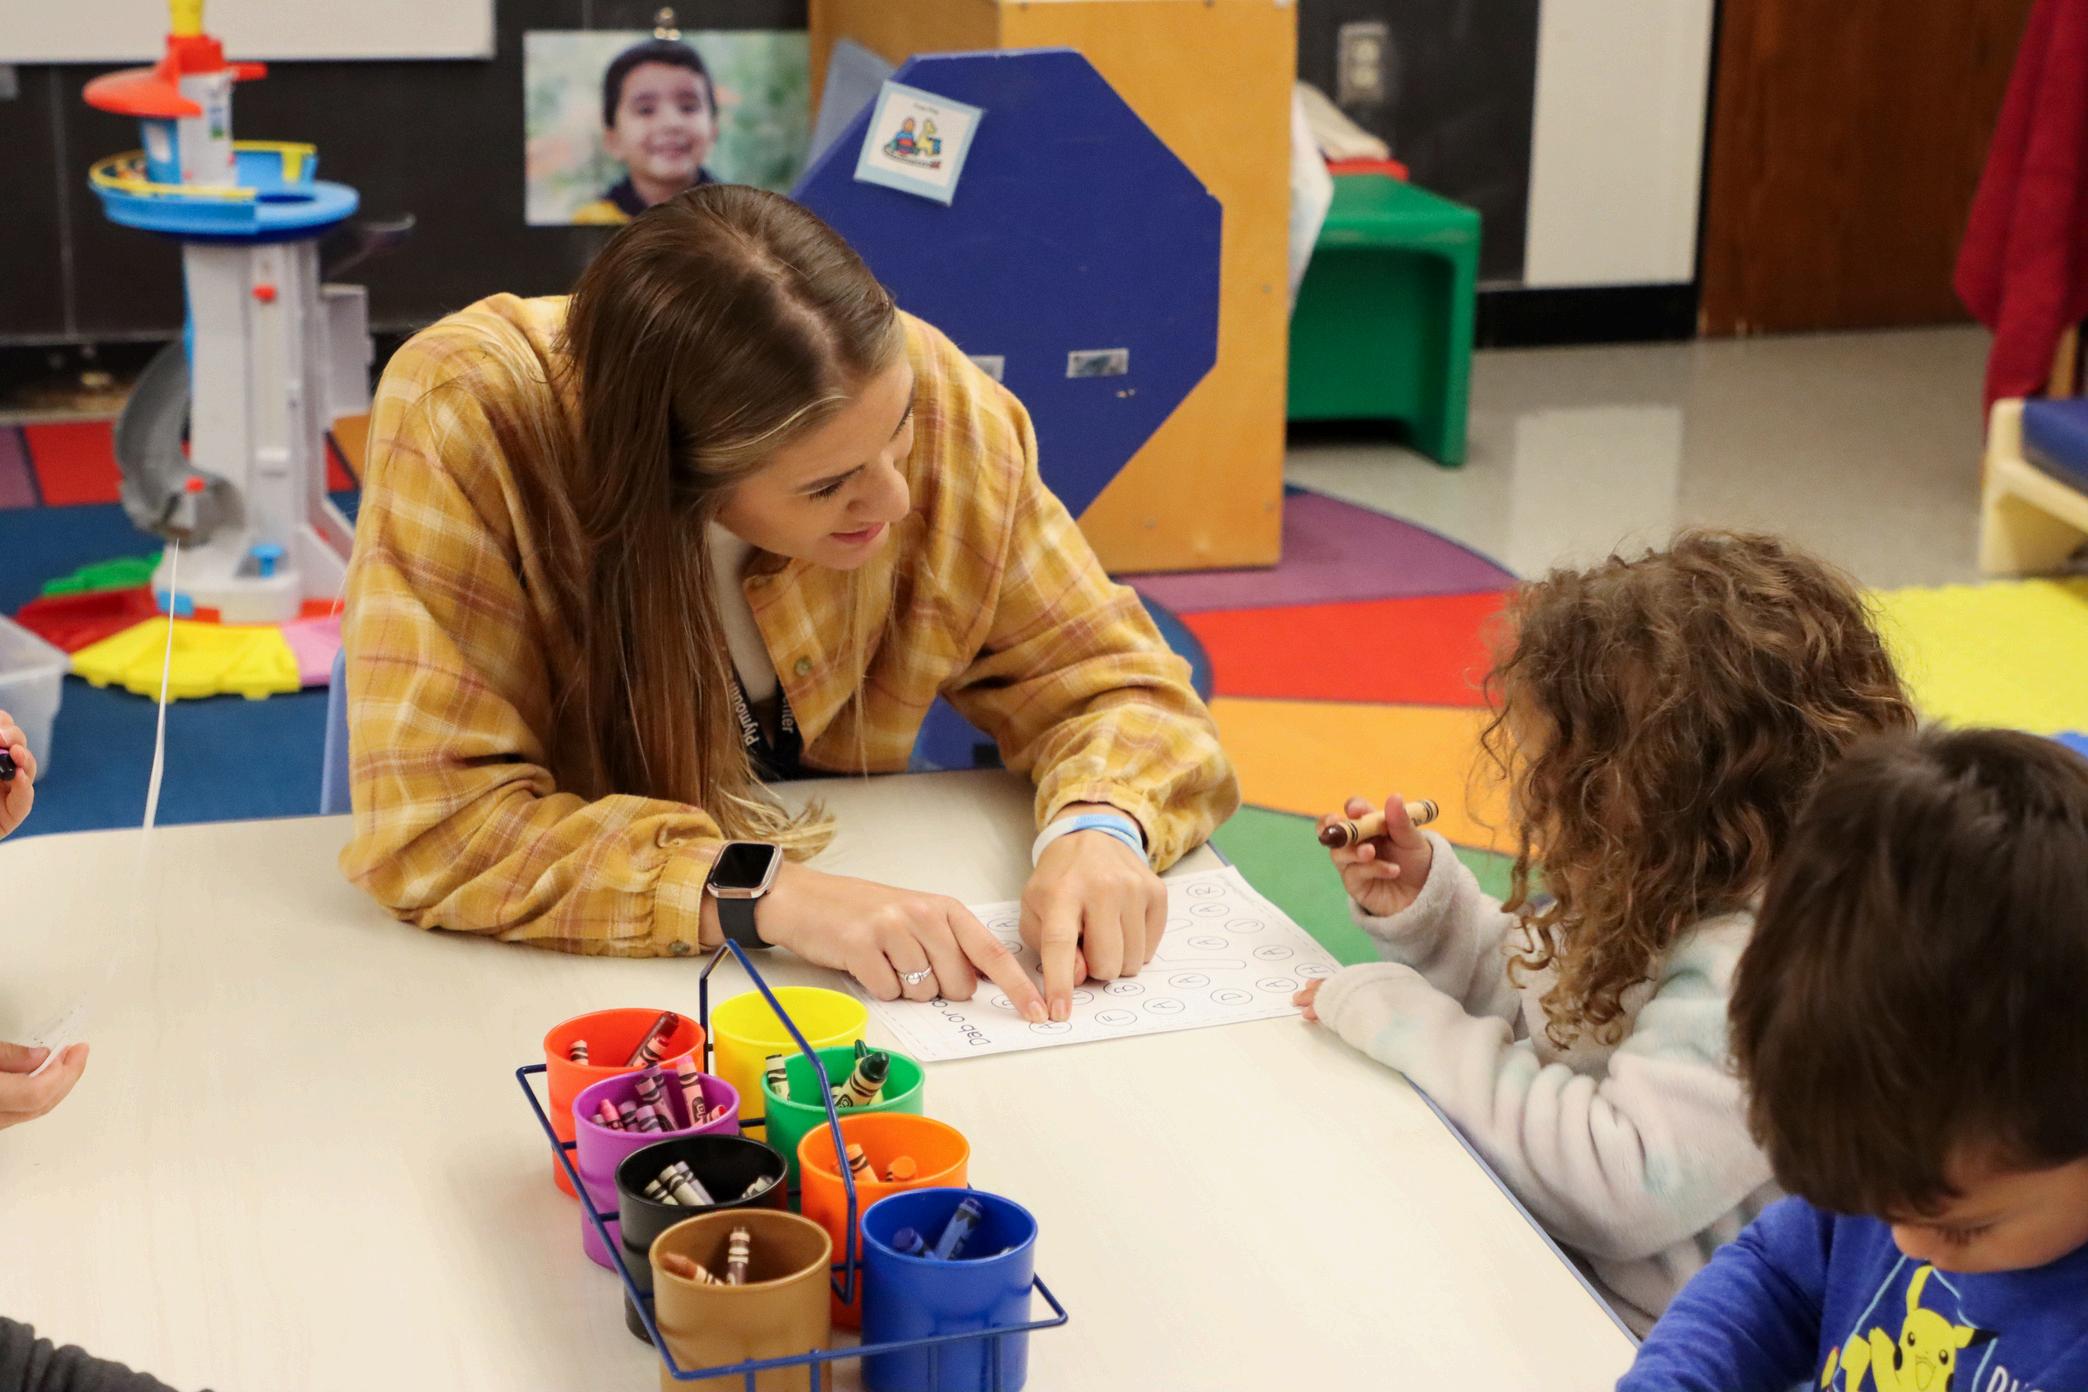
Over the past five years, our district has seen significant changes in our student population, particularly an increase in multilingual learners and students requiring specialized support, especially in our preschool programs These demographic shifts present both challenges and opportunities for
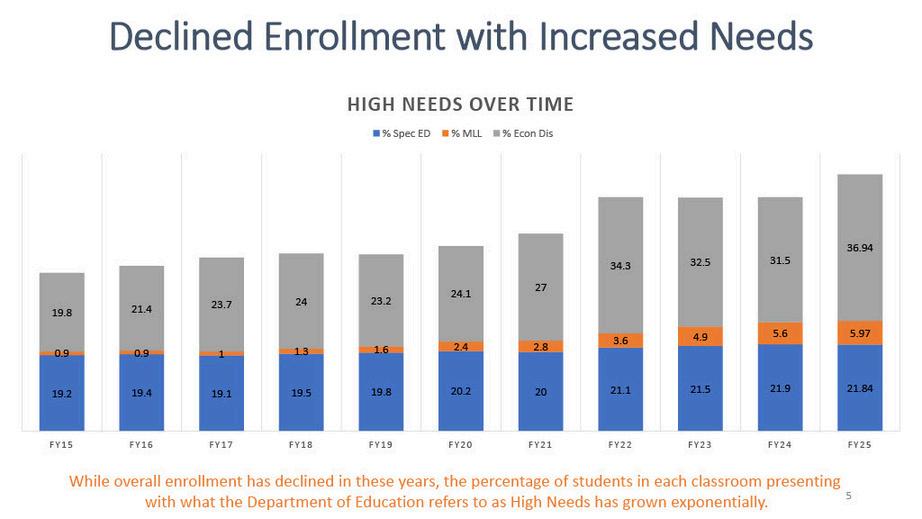
While our enrollment has declined in recent years, the percentage of high needs students has grown exponentially When a school district experiences a decline in enrollment but an increase in high-need students such as English learners, special education students, and low-income families—it must provide more specialized services. These services include additional language support, individualized education plans (IEPs), and social or mental health programs, all of which require specialized staff, smaller class sizes, and tailored curricula As a result, the district must invest more resources to meet these students’ unique needs, which can strain existing programs and staff, while also potentially shifting the focus of the curriculum to better support these students. Financially, fewer students typically mean less funding, as most school State funding is tied to enrollment numbers. However, the rising number of high-need students often leads to higher costs per student due to the additional services they require This creates a financial gap where the district has less money overall, but needs to spend more to ensure these students receive adequate support. To balance this, the district may have to prioritize these services, possibly cutting other programs or struggling to maintain staffing levels, which can impact the overall quality of education. Fortunately, we have not had to make those difficult decisions yet.
41 OBERY
Principal: Peter Parcellin Grades: 9-12
Year Built: 2012

Principal: Patricia Fry Grades: 9-12
Year Built: 2017
Principal: James Demers Grades: 9-12
Year Built: 1892
Offered at PNHS & PSHS
Director: Mark Duffy Grades: 9-12 Allied
INTERMEDIATESCHOOL
117 LONG POND RD.
Principal: Brian Palladino Grades: 6-8
Year Built: 1972
488 LONG POND RD.
Principal: Erica Barrett Grades: 6-8
Year Built: 1999
25 ALDEN ST.
Principal: Stephanie Van Winkle Grades: K-5
Year Built: 1951

80 FEDERAL FURNACE RD.
Principal: Stacey Perry Grades: K-5
Year Built: 1977

258 STANDISH AVENUE
Principal: Kristin Wilson Grades: K-5
Year Built: 1910

1181 STATE RD.
Principal: Erica Manfredi Grades: K-5
Year Built: 1977

ELEMENTARYSCHOOL
70 MANOMET POINT RD.
Principal: Patrick Fraine Grades: K-5
Year Built: 1952

6 LINCOLN ST.
Principal: Kristine Chase Grades: K-5
Year Built: 1913
178 BOURNE RD.
Principal: Derek Thompson Grades: K-5
Year Built: 1975

117 LONG POND RD.
Principal: Denise Tobin
Grades: Preschool
Year Built: 1972
Located in PCIS (Apollo House)
170 PLYMPTON RD.
Principal: Martha Deusser Grades: K-5
Year Built: 1975


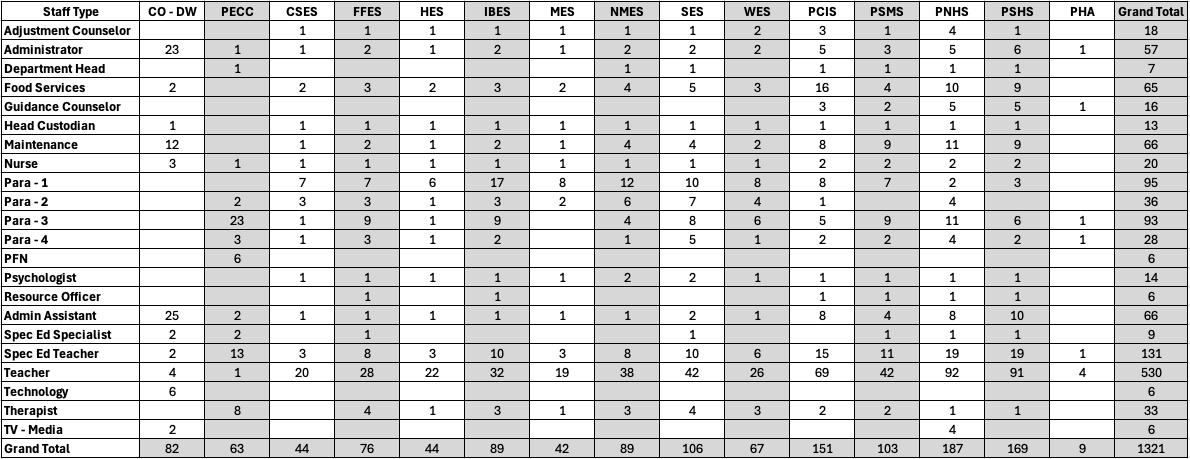
The Plymouth Public Schools employs 1,321 staff members. This is a reduction of 29 positions from FY24 In FY24, the Plymouth Public Schools employed 1,350 staff members The total number of staff at each building and in each position in the district are shown in the charts.
As we developed the FY26 budget, we focused on the principles below.
Students first.
Keep what is in the best interest of all our students’ needs (academically, socially, emotionally, and behaviorally) at the forefront of decision-making
Maintain class sizes, programs and services currently provided to our students.
Ensure that student programs and services currently provided to our students are maintained. Any reductions that need to be made are approached from furthest away from students first.
Be collaborative and transparent.
Foster a collaborative budget development process, with transparency through School Committee departmental presentations and subcommittee updates.
Allocate resources equitably.
Analyze spending to make sure that a per pupil cost is approximately equal across levels while considering the size of each school building and priorities of individual schools. It is important to acknowledge that funds are not equal year to year in specific curricular areas or schools. Shifts need to be made based upon annual needs.

The available revenue to develop the FY26 Budget for both the Town and School is $10,856,766. State aid was estimated to not increase as the Governor’s budget was not released until the beginning of 2025 and the state budget is not usually passed until the end of the school year or beginning of the summer.
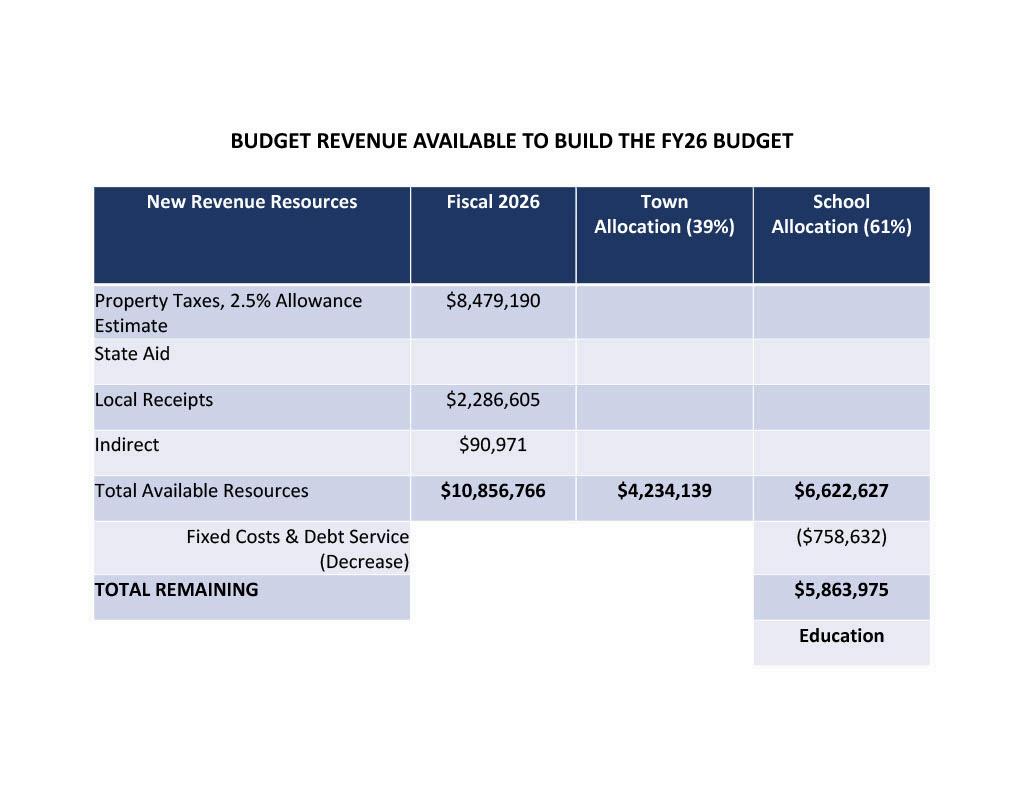
Following historical budget allocations, the town divided the available funds, 39% for the development of the town budget and 61% for the school budget After subtracting all fixed costs and debt services, the increase to the school budget could not exceed an increase of $5,863,975.
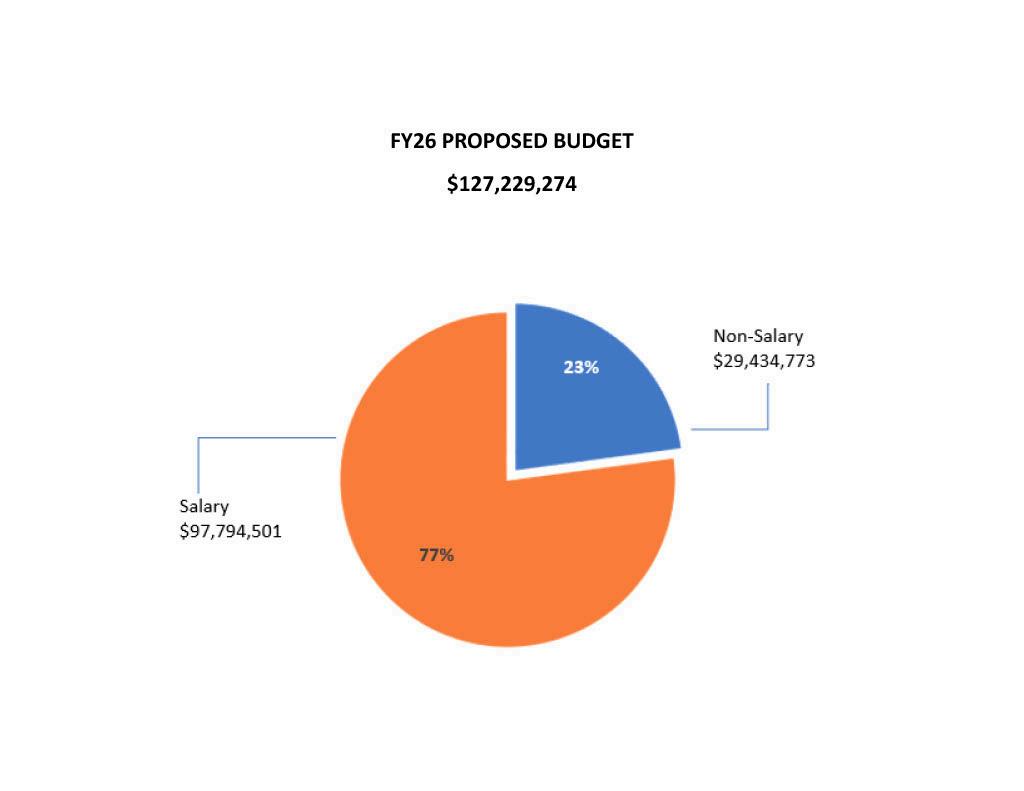
FY26 Proposed Budget
$127,229,274
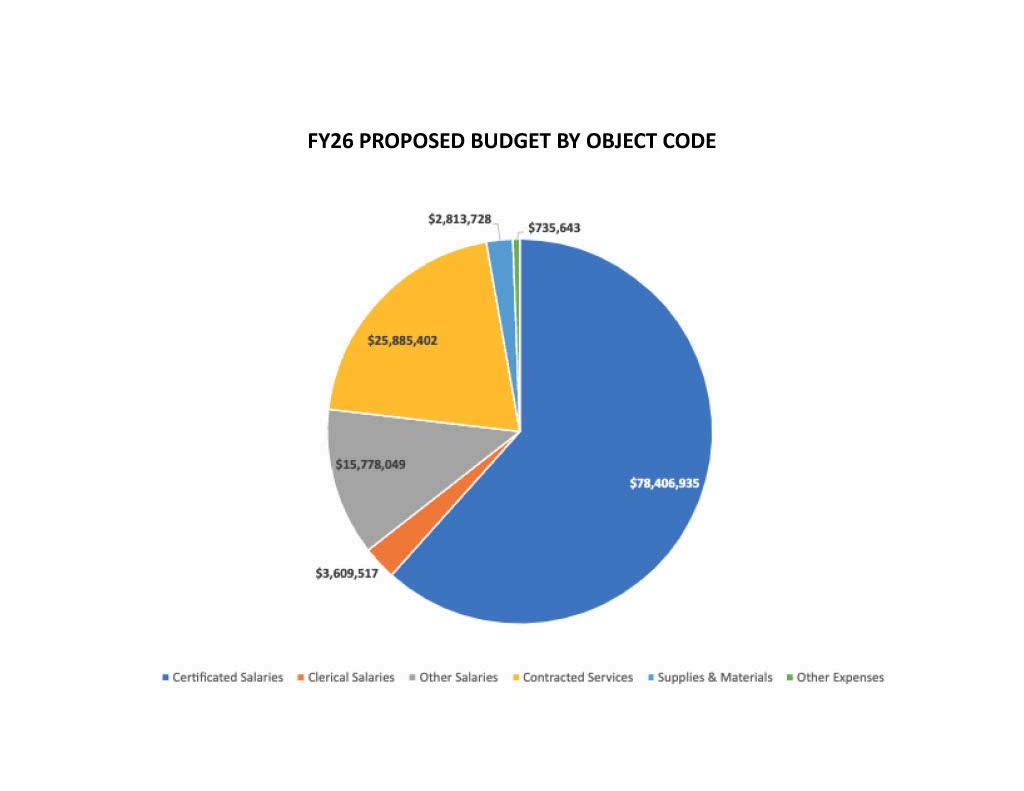
FY26 Proposed Budget by Object Code
The initial FY26 budget was $821,554 over the available funding. The $821,554 overage, occurred after reducing supplies by 10%, cutting software programs that had minimal usage, and cutting additional non-salary expenses. With state approval, we split funded several custodial salaries between the budget and cafeteria revolving, reducing the overage by $300,084. The time that the custodians are working in the cafeteria to support school lunch during the 180 days of school is the only time that can be charged to the cafeteria revolving account. In order to balance our FY26 budget, there is a reduction of $521,470 listed in Cost Center 350. This reduction will be realized in staffing reductions and is reflected in the total proposed budget of $127,229,274. The specific reductions will be determined closer to the end of the FY25 school year.
The FY26 overall budget increases 4.8% or $5,863,975 over FY25. Salaries will increase 6 3% or $5,815,446, while non-salary expenses increase less than 1% or $48,529 Salaries include the salaries of all certificated staff (teachers, administrators), clerical staff and noncertificated staff (para-educators, custodians, drivers). Non-salary expenses include contracted services (transportation, tuitions, software, utilities), supplies and materials, and other expenses (memberships, reimbursements). Cafeteria expenses are not included in the presented budget. All cafeteria expenses are paid through the cafeteria revolving account.

The Plymouth Public Schools receives entitlement grants (marked with a ) from the Federal Government annually. The annual grant allocations are not received until July before the school year begins A description of the entitlement grants are included on the subsequent page. Plymouth Public Schools receive additional competitive grants that we must apply for and are hopefully awarded Grants received in FY25 are listed in the chart on this page and subsequent pages Awarded competitive grants are not always available in future years
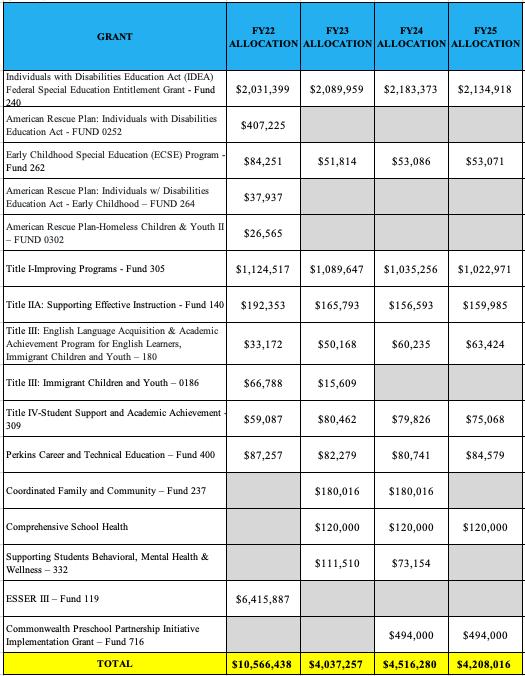

Seeking available competitive grants is crucial for our district as it allows us to access additional funding that can enhance and expand the programs and services we offer to students. These grants often target specific needs, such as improving educational outcomes, supporting innovative teaching practices, or addressing equity gaps, which aligns with our district’s priorities. By pursuing these opportunities, we not only supplement our budget but also demonstrate our commitment to securing resources that maximize student success, improve school infrastructure, and foster community partnerships. On the next few pages, the grants below are described in more detail.
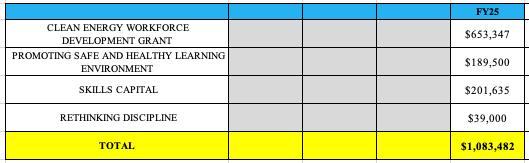
Nearly $1.6M in FY25 at end of January 2025
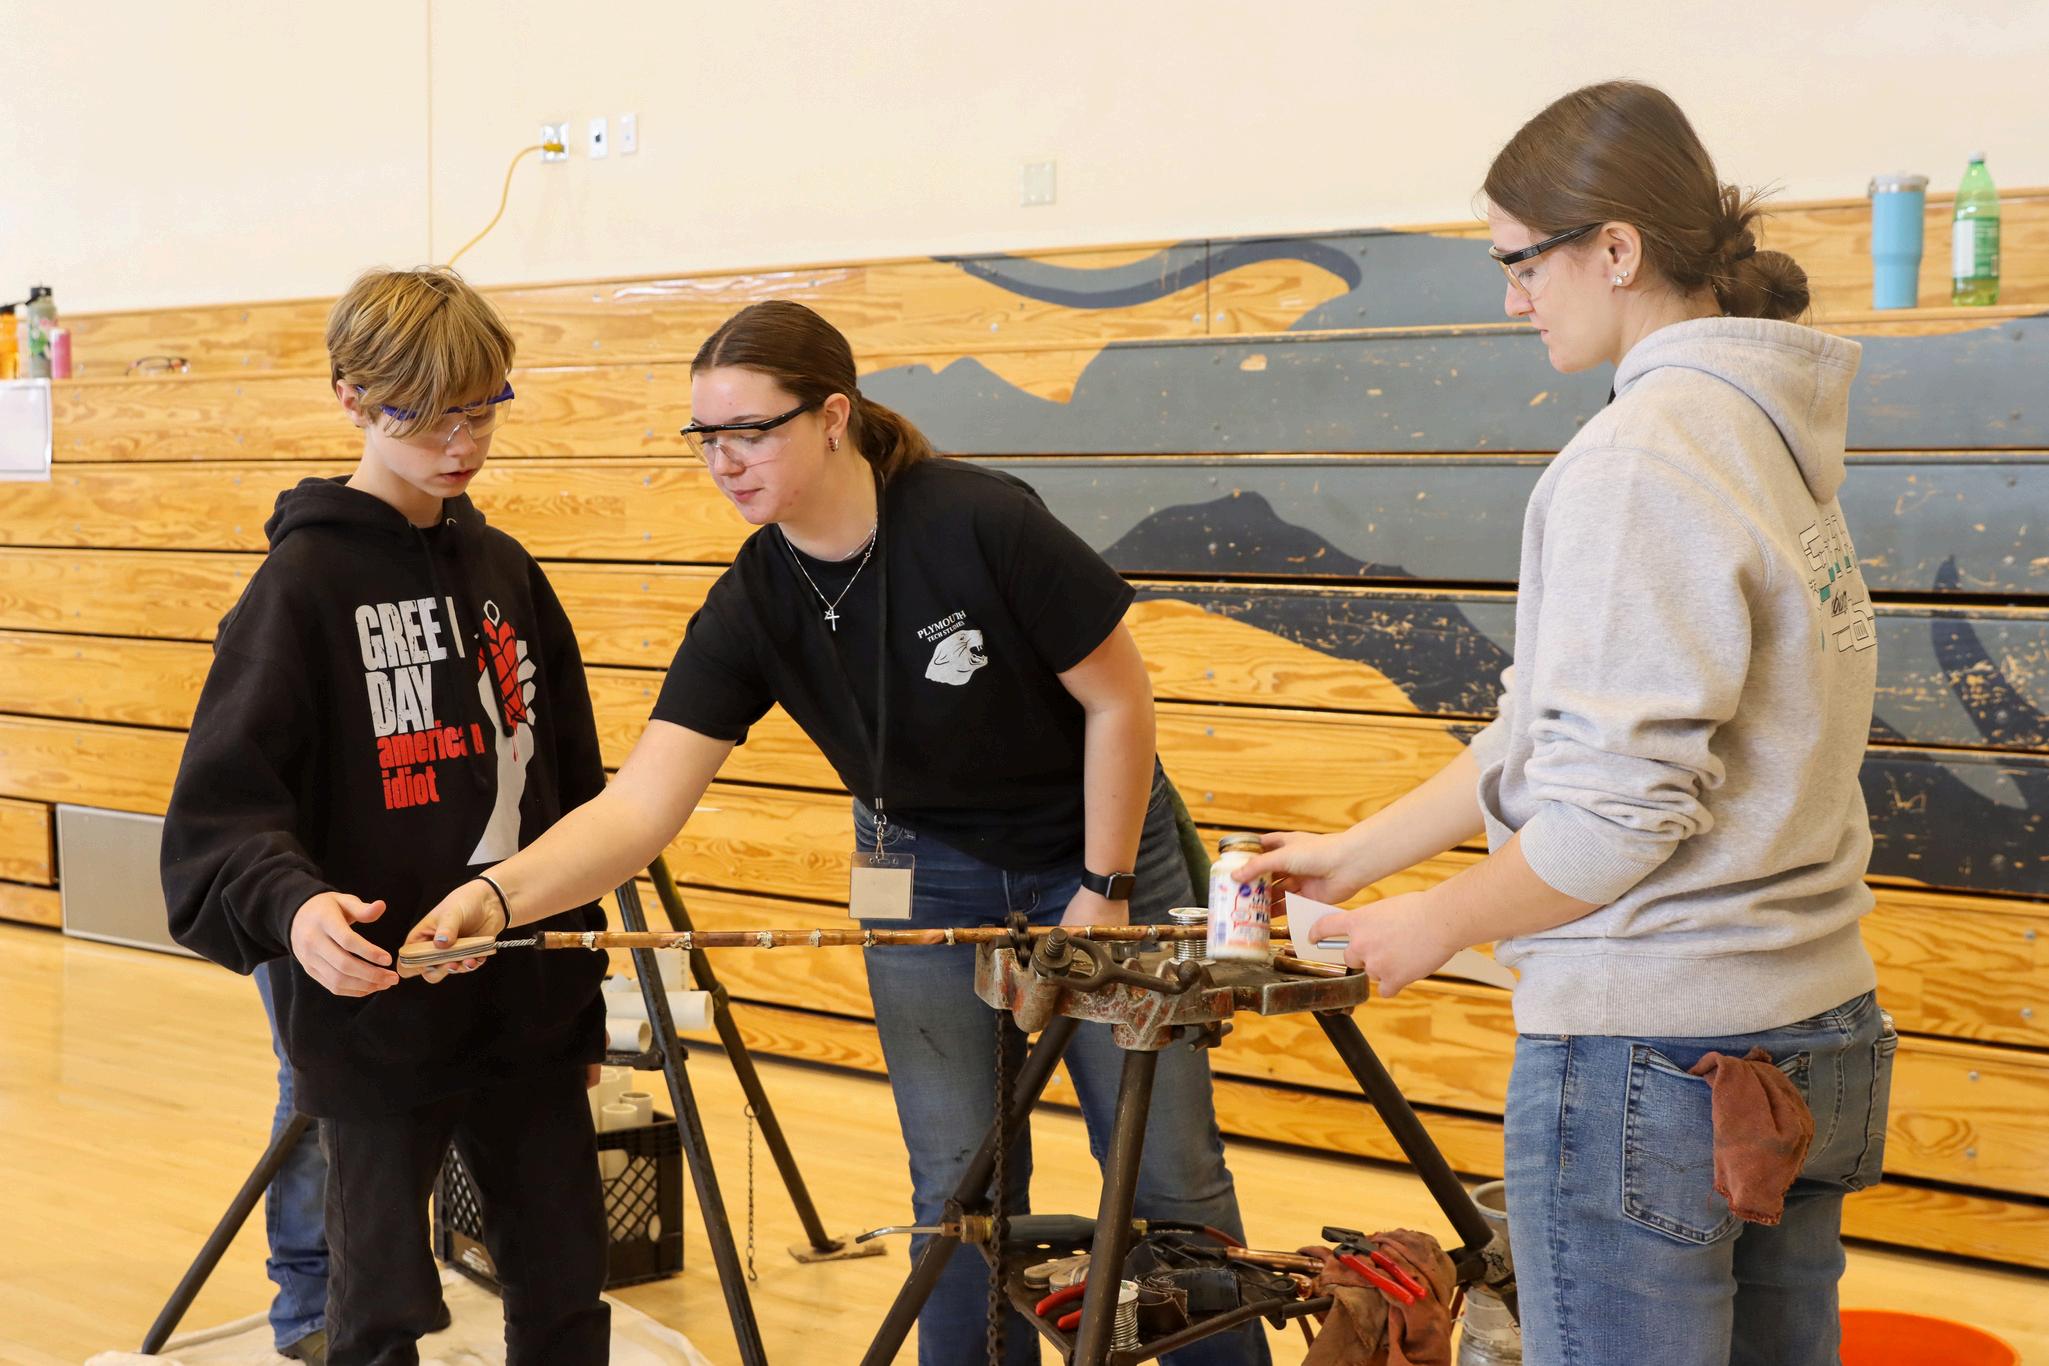
Clean Energy
Workforce Dev Grant
($653,347)
Clean Energy Lab for trades training space to provide students with hands on and collaborative training on clean energy projects.
Promoting Safe & Healthy Learning
Environment Grant
($189,500)
Health & Physical Ed
($50,000)
Teen Mental Health ($99,500)
Supporting ELL ($40,000)
Skills Capital Grant ($201,635)
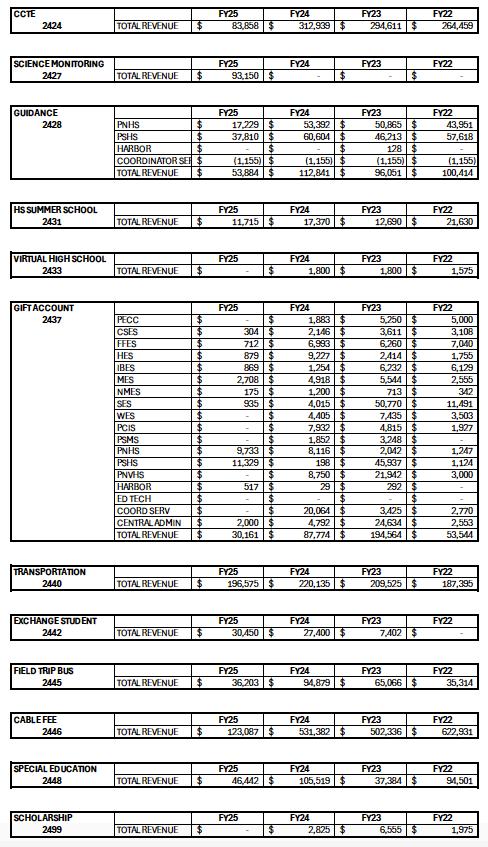
Funds to support the Plymouth South Graphic Design and Visual Communications program through the improvement of the school’s television studio and the purchase of video production equipment.
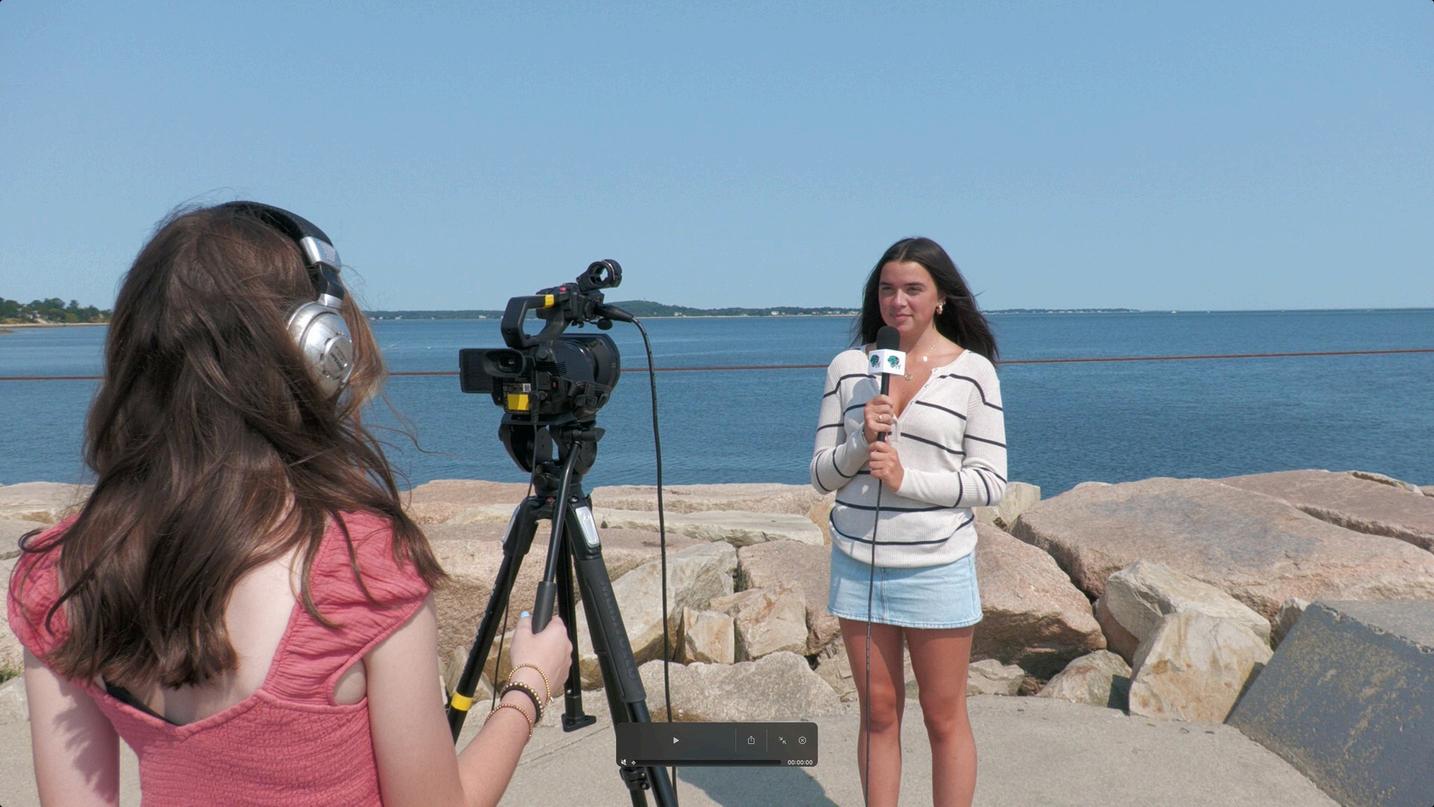
Students in Panther TV at Plymouth South High School utilizing new video equipment earned from the Skills Capital Grant.
Nearly $1.6M in FY25 at end of January 2025
Rethinking Discipline Grant ($39,000)
Implement practices and models that reduce exclusionary discipline and enhance a positive climate and culture through the use of relationship building, enhancing student voice, and integrating family engagement.
Commonwealth Preschool Partnership Grant ($494,000)
(2 consecutive years)
Funds to support the implementation of a program design that ensures full inclusion of children with special needs across local private preschools.
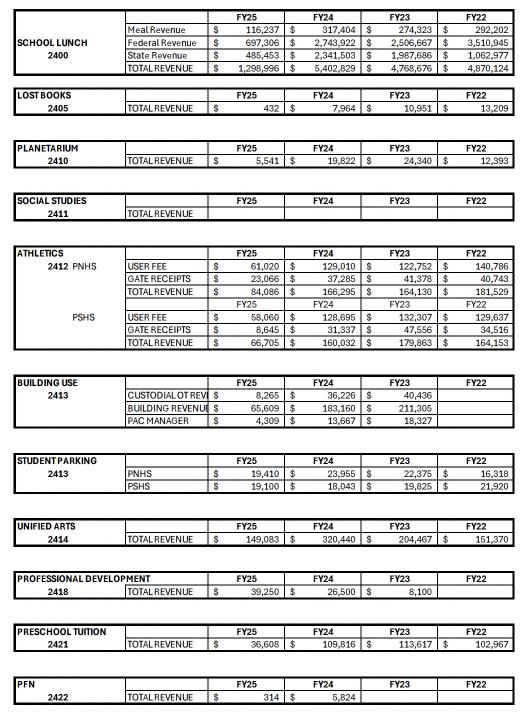
A revolving fund separately accounts for specific revenues and earmarks them for all expenditures to support the activity, program or service that generated the revenues. The revolving accounts and revenue for FY22, FY23, FY24 and FY25 through December 2024, are shown in the chart below.
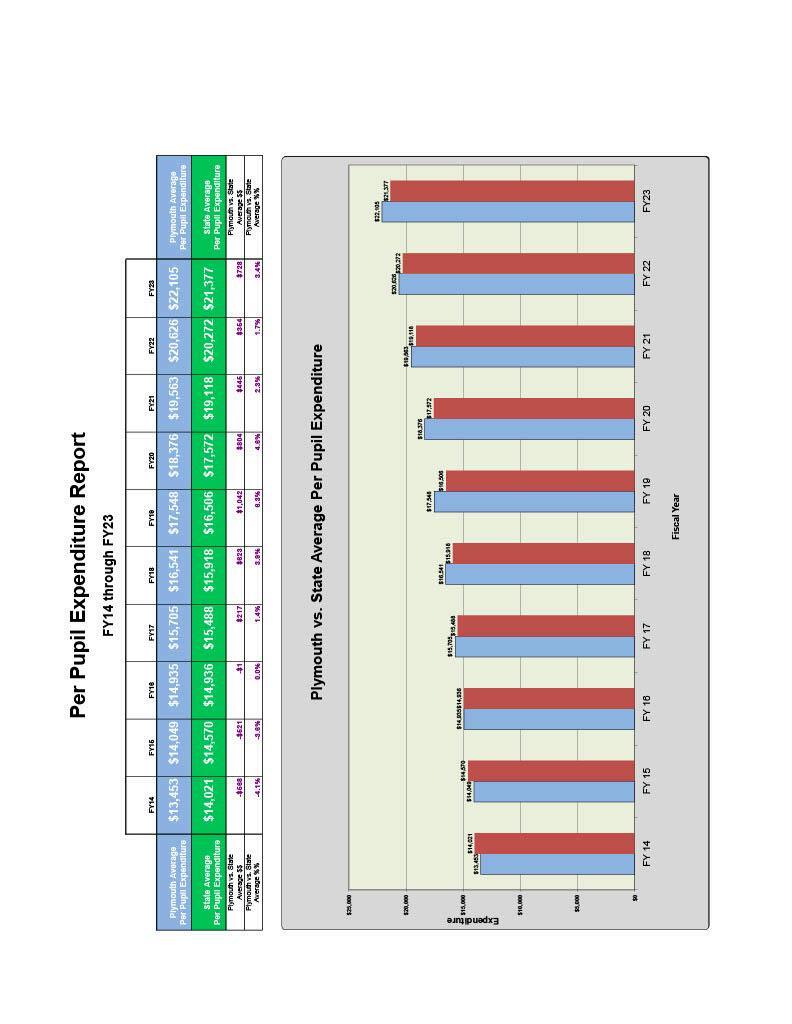
Per pupil expenditures are calculated from information provided on each district's End of Year Financial Report (EOYR). The most recent end of year report that has been reported by the Department of Elementary and Secondary Education (DESE) is FY23 FY24 per pupil expenditures are still being calculated by DESE
Per pupil calculations show all school operating expenditures including those outside the general fund such as grants, private donations, and revolving accounts. They also include payments for local resident pupils who are being educated in schools outside the district.
The following funding sources are all included in the expenditure per pupil:
school committee appropriations
municipal appropriations outside the school committee budget that affect schools
federal grants
state grants
circuit breaker funds
private grants and gifts
school choice and other tuition revolving funds
athletic funds
school lunch funds
other local receipts such as rentals and insurance receipts
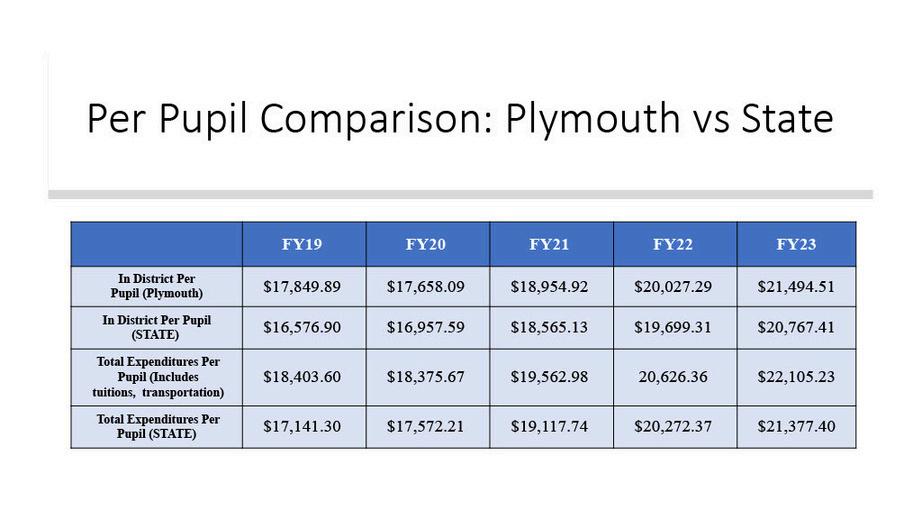
On the subsequent pages, the per pupil expenditures for Plymouth and the state are reported for FY14FY23 In addition, there is a breakdown of the FY22 and FY23 per pupil costs by spending category
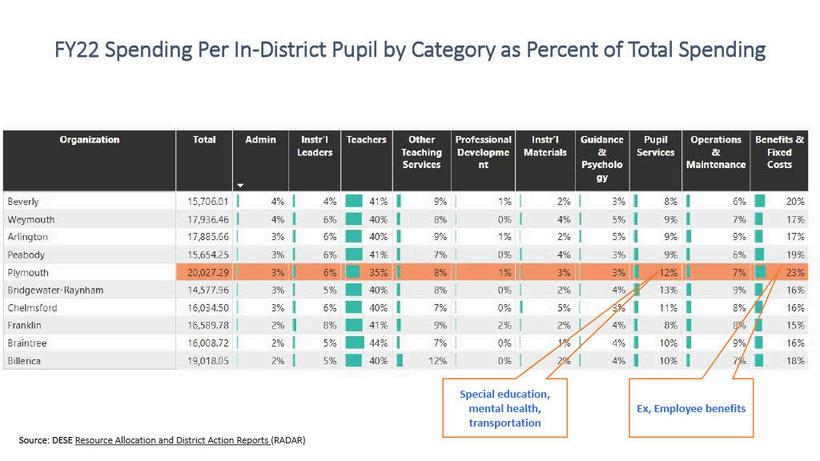
Pupil Services and Insurance, Retirement Programs comprise a high percentage of the per pupil expense as compared to the state. Pupil Services includes Special Education Services; Counseling and Mental Health Services; Speech and Language Services; Health Services; Transportation Services; Costs associated with transporting students to and from school, particularly for those with special needs and Academic Support Services: Programs designed to help struggling students such as tutoring or
Per pupil expenditures are calculated from information provided on each district's End of Year Financial Report (EOYR). The most recent end of year report that has been reported by the Department of Elementary and Secondary Education (DESE) is FY23. FY24 per pupil expenditures are still being calculated by DESE.
Per pupil calculations show all school operating expenditures including those outside the general fund such as grants, private donations, and revolving accounts. They also include payments for local resident pupils who are being educated in schools outside the district.
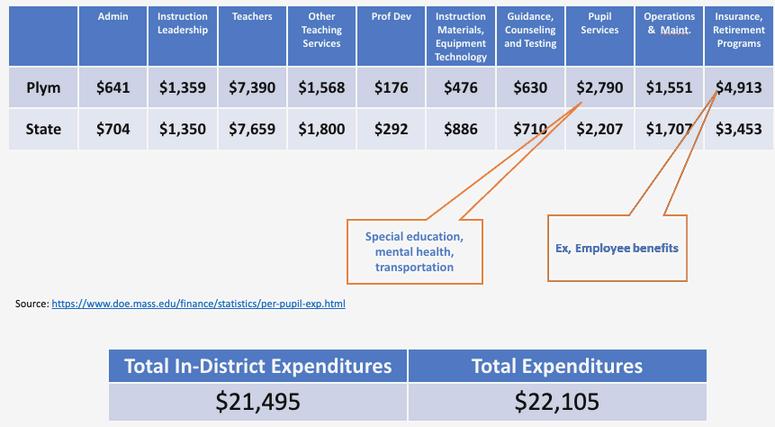
Pupil Services and Insurance, Retirement Programs comprise a high percentage of the per pupil expense as compared to the state. Pupil Services includes Special Education Services; Counseling and Mental Health Services; Speech and Language Services; Health Services; Transportation Services; Costs associated with transporting students to and from school, particularly for those with special needs and Academic Support Services: Programs designed to help struggling students, such as tutoring or intervention programs. Employee Benefits is comprised of health insurance and other benefits provided to school staff.
The district’s per pupil expenditures in FY22 and FY23 divided by spending category are displayed in the two charts on the next page The FY22 chart shows the percentage of the total spent per category as compared to comparable districts as determined by the state The FY23 chart divides Plymouth’s per pupil by dollar amount in each spending category
FY22 Spending Per In-District Pupil by Category as Percent of Total Spending
FY23 Spending Per In-District Pupil by Category as Percent of Total Spending
Contracts
Special Education Services, Transportation, & Tuitions
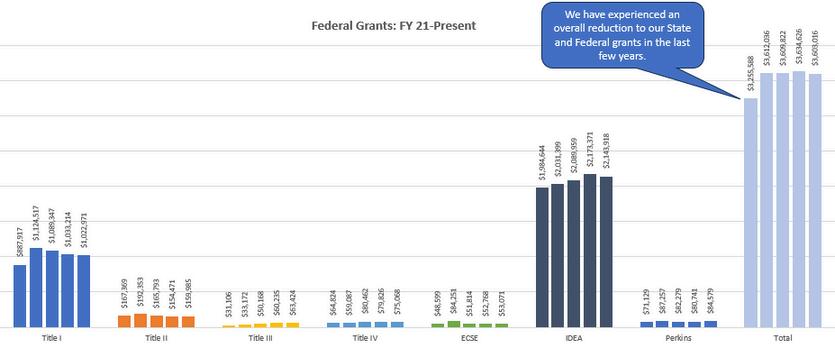
Declining State & Federal Grants
Utilities
Transportation/Crossing Guards

In FY24, the Plymouth Public Schools settled contracts with the EAPC (Teachers, Administrative Assistants, Paraeducators), COBRA (Custodians, Cafeteria), Bus Drivers, Administrators (Coordinators, Assistant Principals), Finance and Human Resources, and Computer Technicians.
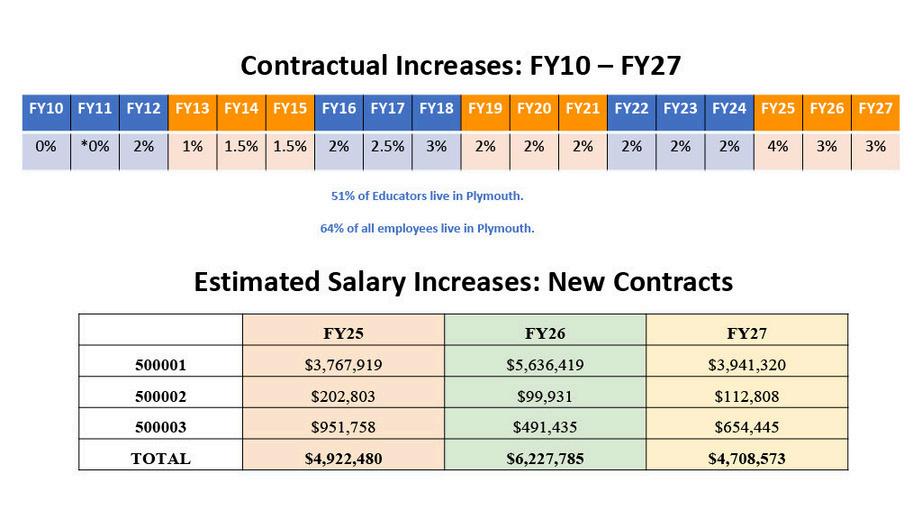
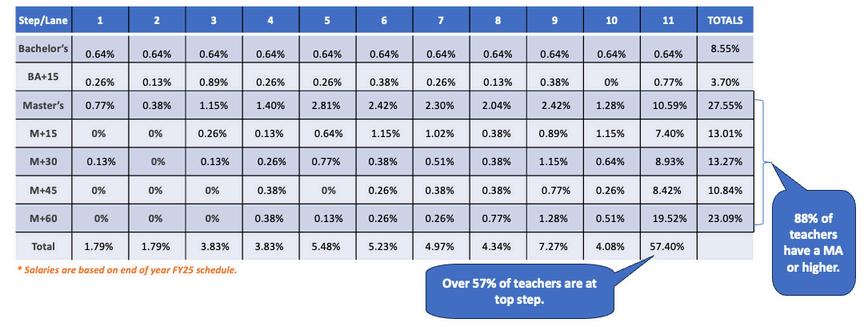
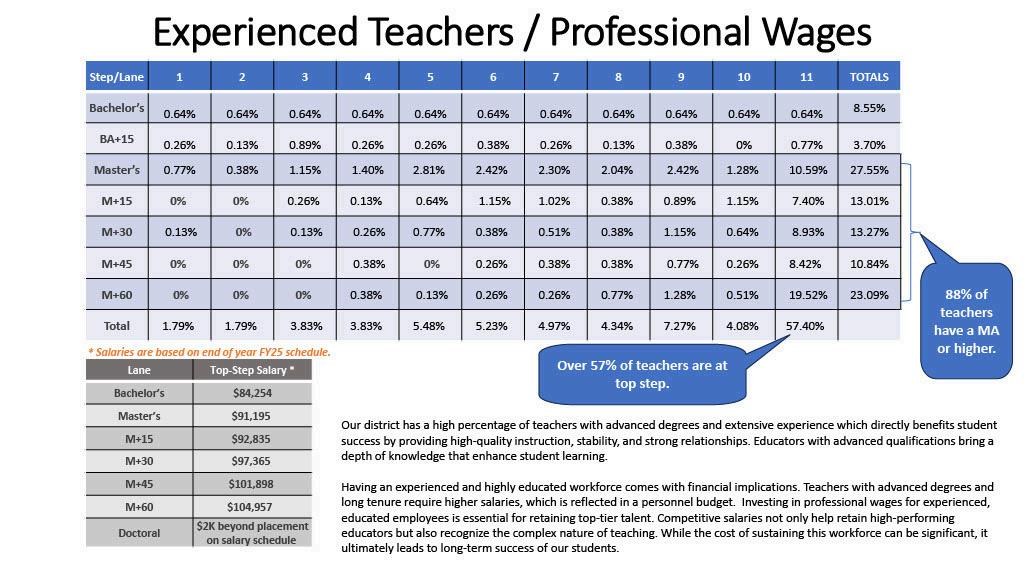
Our district has a high percentage of teachers with advanced degrees and extensive experience which directly benefits student success by providing high-quality instruction, stability, and strong relationships. Educators with advanced qualifications bring a depth of knowledge that enhance student learning.
Having an experienced and highly educated workforce comes with financial implications Teachers with advanced degrees and long tenure require higher salaries, which is reflected in a personnel budget Investing in professional wages for experienced, educated employees is essential for retaining top-tier talent
Competitive salaries not only help retain high-performing educators but also recognize the complex nature of teaching While the cost of sustaining this workforce can be significant, it ultimately leads to long-term success of our students.
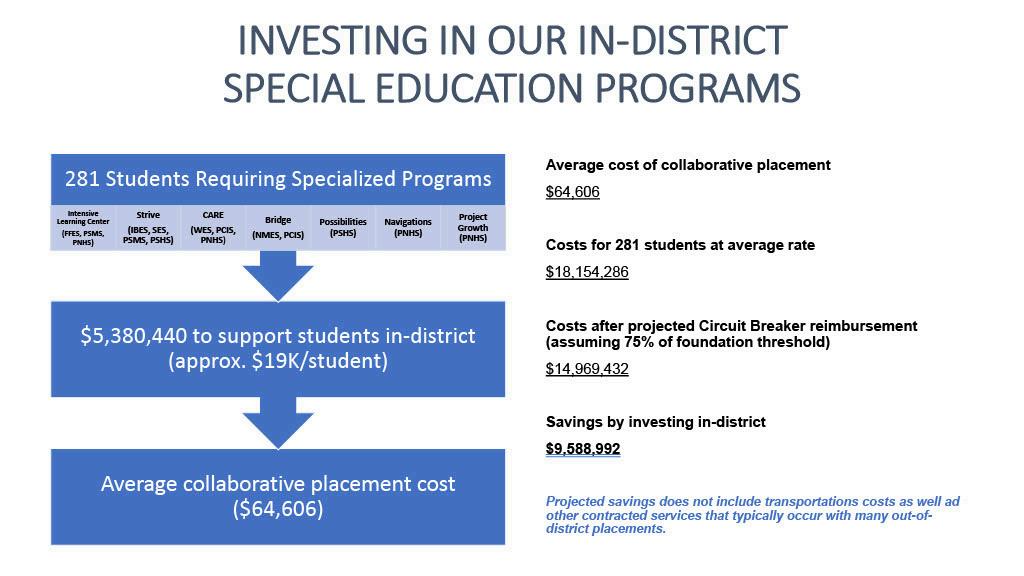
The anticipated increase for all Special Education out of district tuitions is set by the Operational Services Division. For FY26, the increase is 3.67%. Several schools have requested and been approved for a higher increase for FY26 through OSD. Transportation contracts will be an 8% increase. The following pages show Plymouth Public Schools’ Special Education costs and how we have saved on out of district costs by creating in-district special education programming.
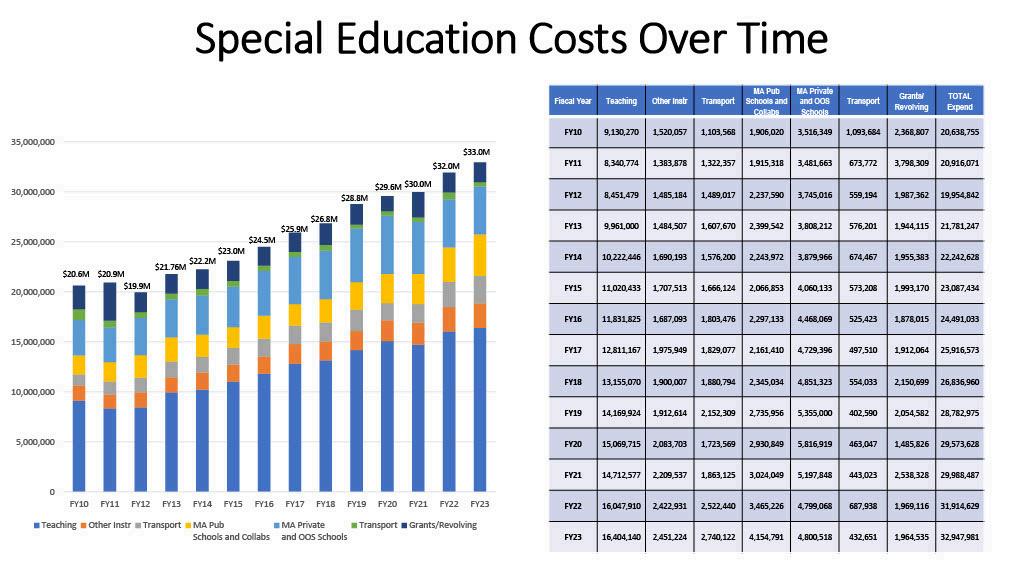
Investing in specialized programs for students with complex special needs is not only a moral and educational imperative but also a fiscally responsible decision for our district
Educationally, these in-district programs allow for tailored support that maximizes learning outcomes, minimizes disruptions, and reduces the need for costly out-of-district placements
Fiscally, while there may be initial investments, these programs can lead to long-term savings by decreasing transportation costs, ensuring more effective use of resources, and retaining students within the district, thus building stronger community ties and enhancing the reputation of our educational system This slide illustrates the investment in our in-district programs as well as the fiscal savings we make when investing in such programs Not only is it best for our students and families, it is best for our taxpayers.
State and Federal Grants have declined over the past 5 years. Most of these grants are allocated for critical services such as specialized staffing, including teachers, support staff, and counselors, whose roles are essential for addressing the unique challenges faced by our most vulnerable students. Salaries have increased but the grants are not increasing to meet the salary increases. Staff previously paid by grants need to be moved into the operational budget or reduced.
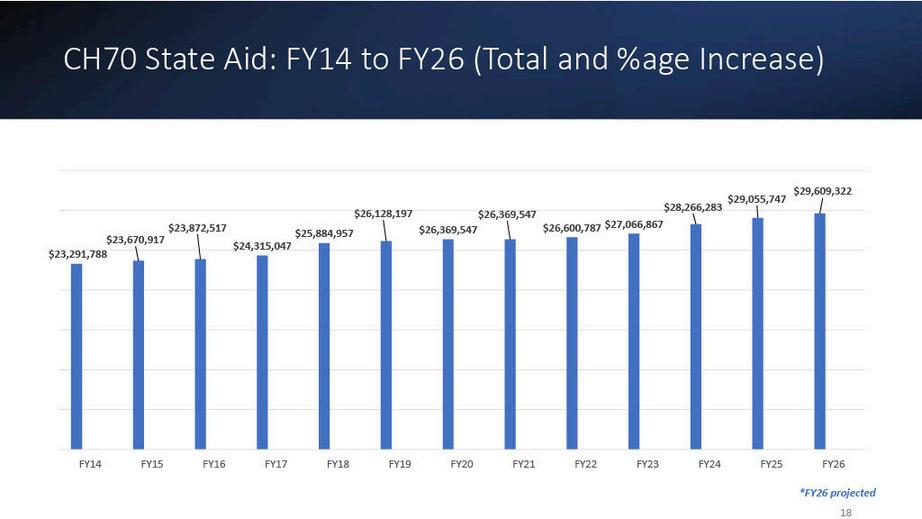
CH70 State Aid: FY14 - FY26 (Total and % Age Increase)
The usage of electricity in the district increased approximately 1 million kilowatts (1 megawatt) over last year, causing an FY26 budget increase of approximately $400,000.
The district is bringing in a lighting control company to look at relay switches, controls and programming at Plymouth South High School. We are conducting a walkthrough with our energy consultant to determine additional energy saving measures.
Despite the increase in energy usage, we continue to benefit from significant cost avoidance through out investment in solar as demonstrated below on solar savings / avoidance. We are currently working with the Town of Plymouth’s Sustainability and Resilience to examine the possibility of installing solar canopies at three school locations.
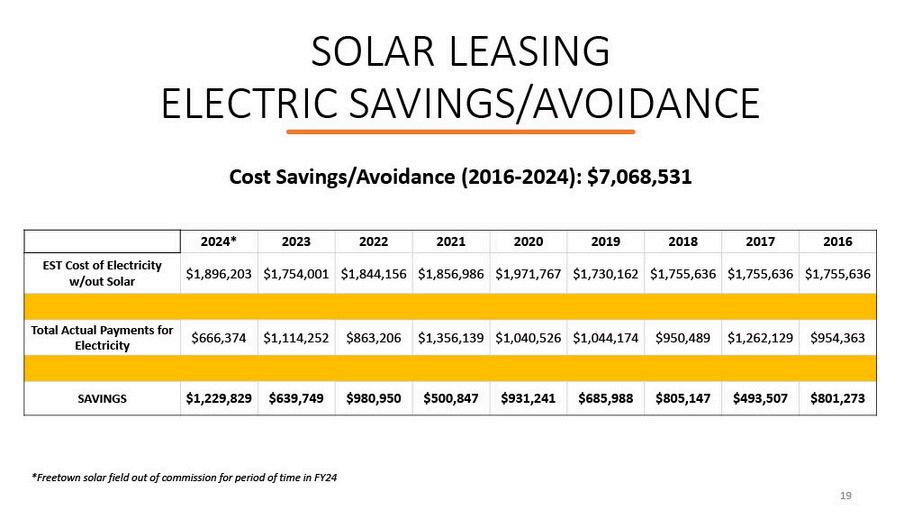
*Freetown Solar Field out of commission for period of time in 2024
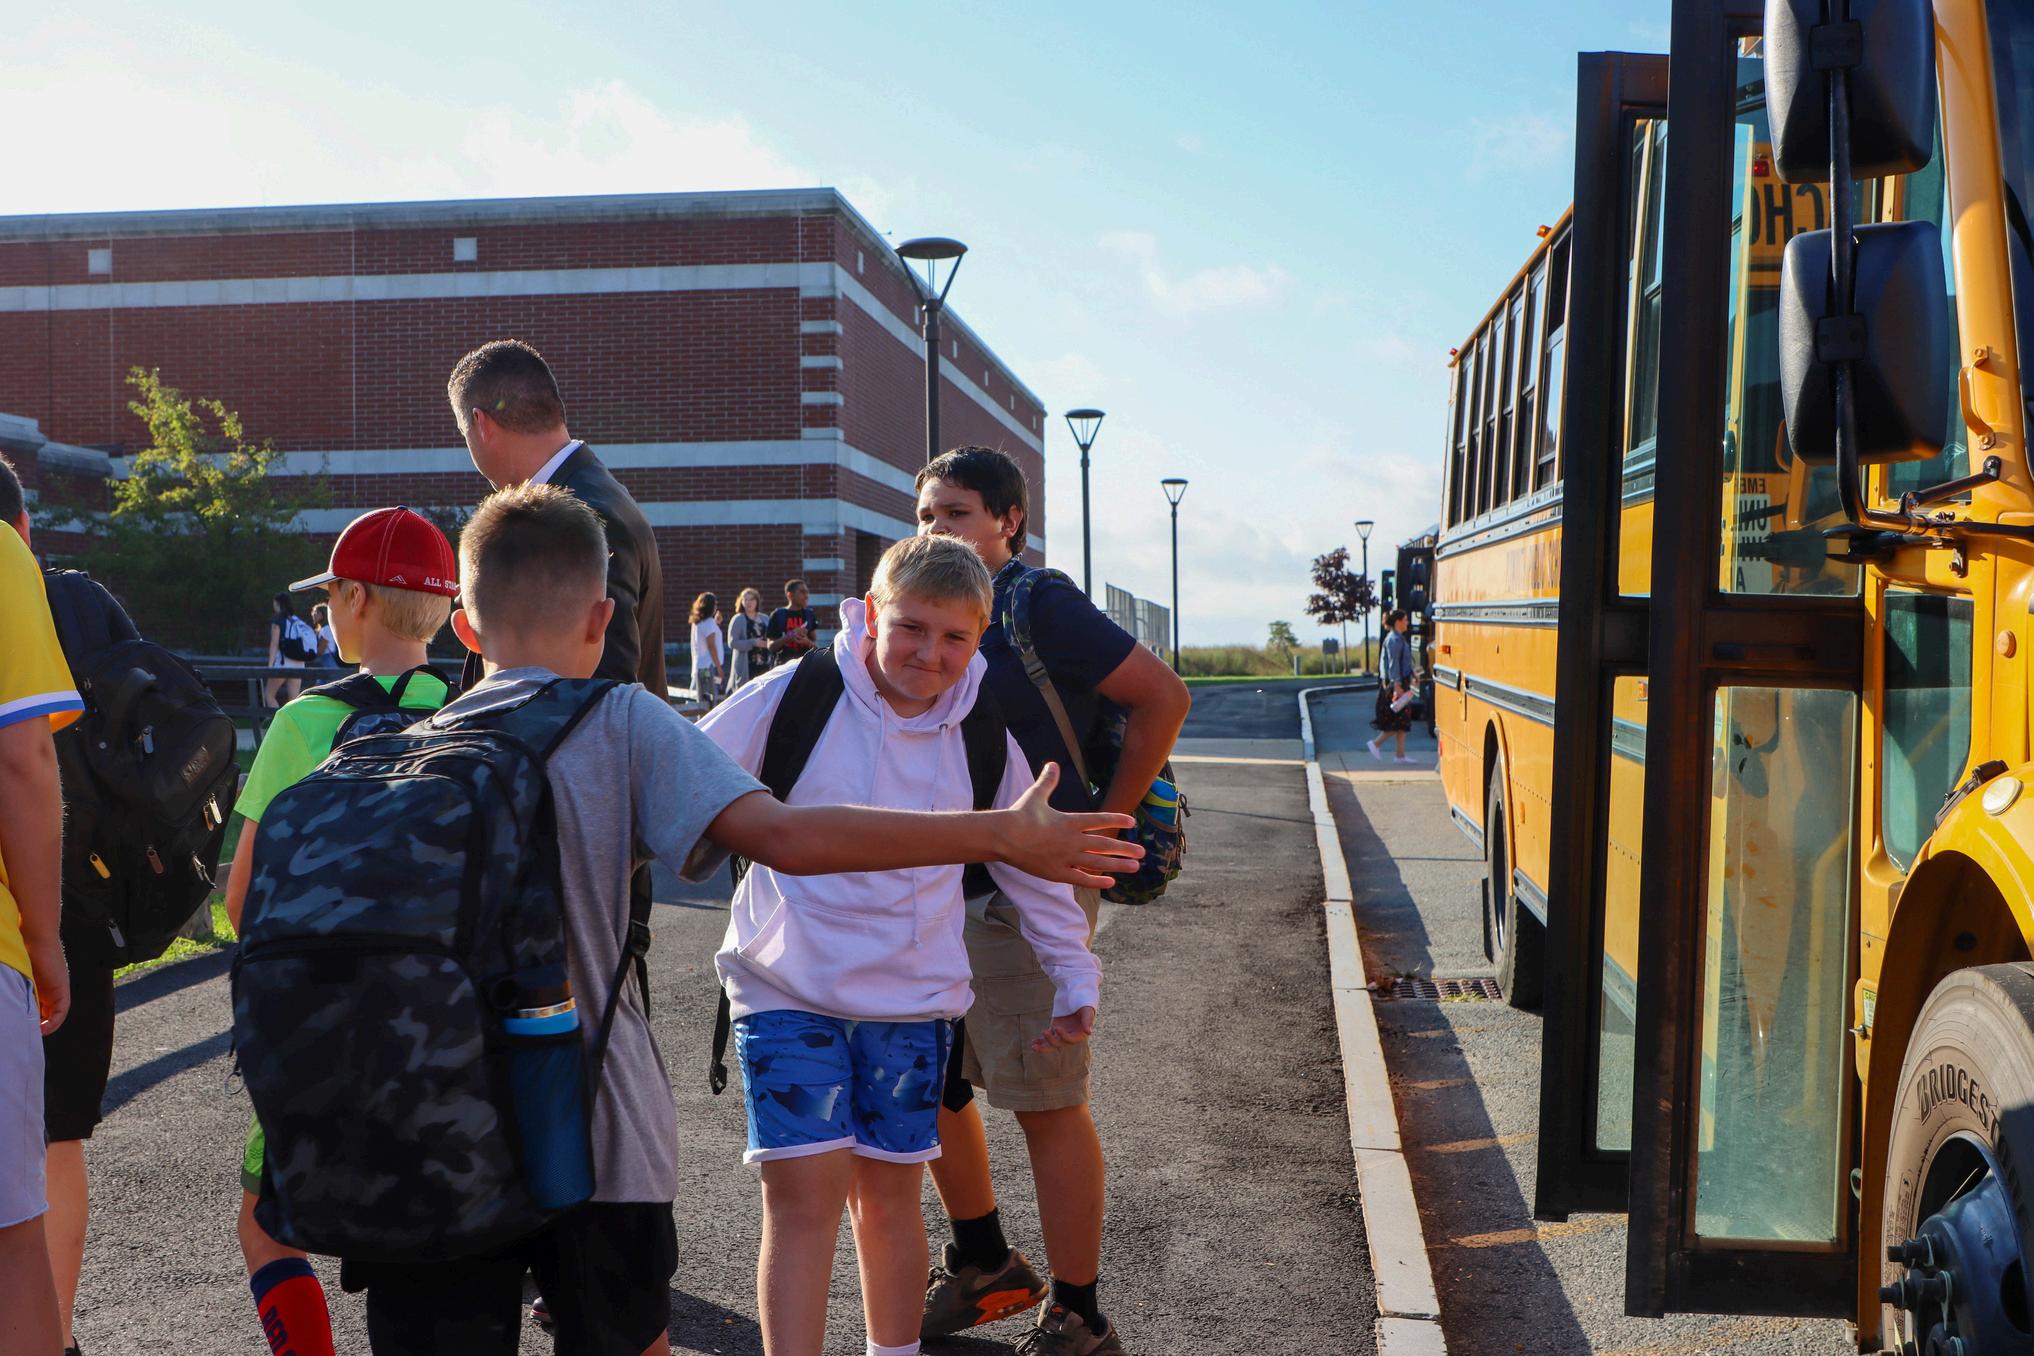
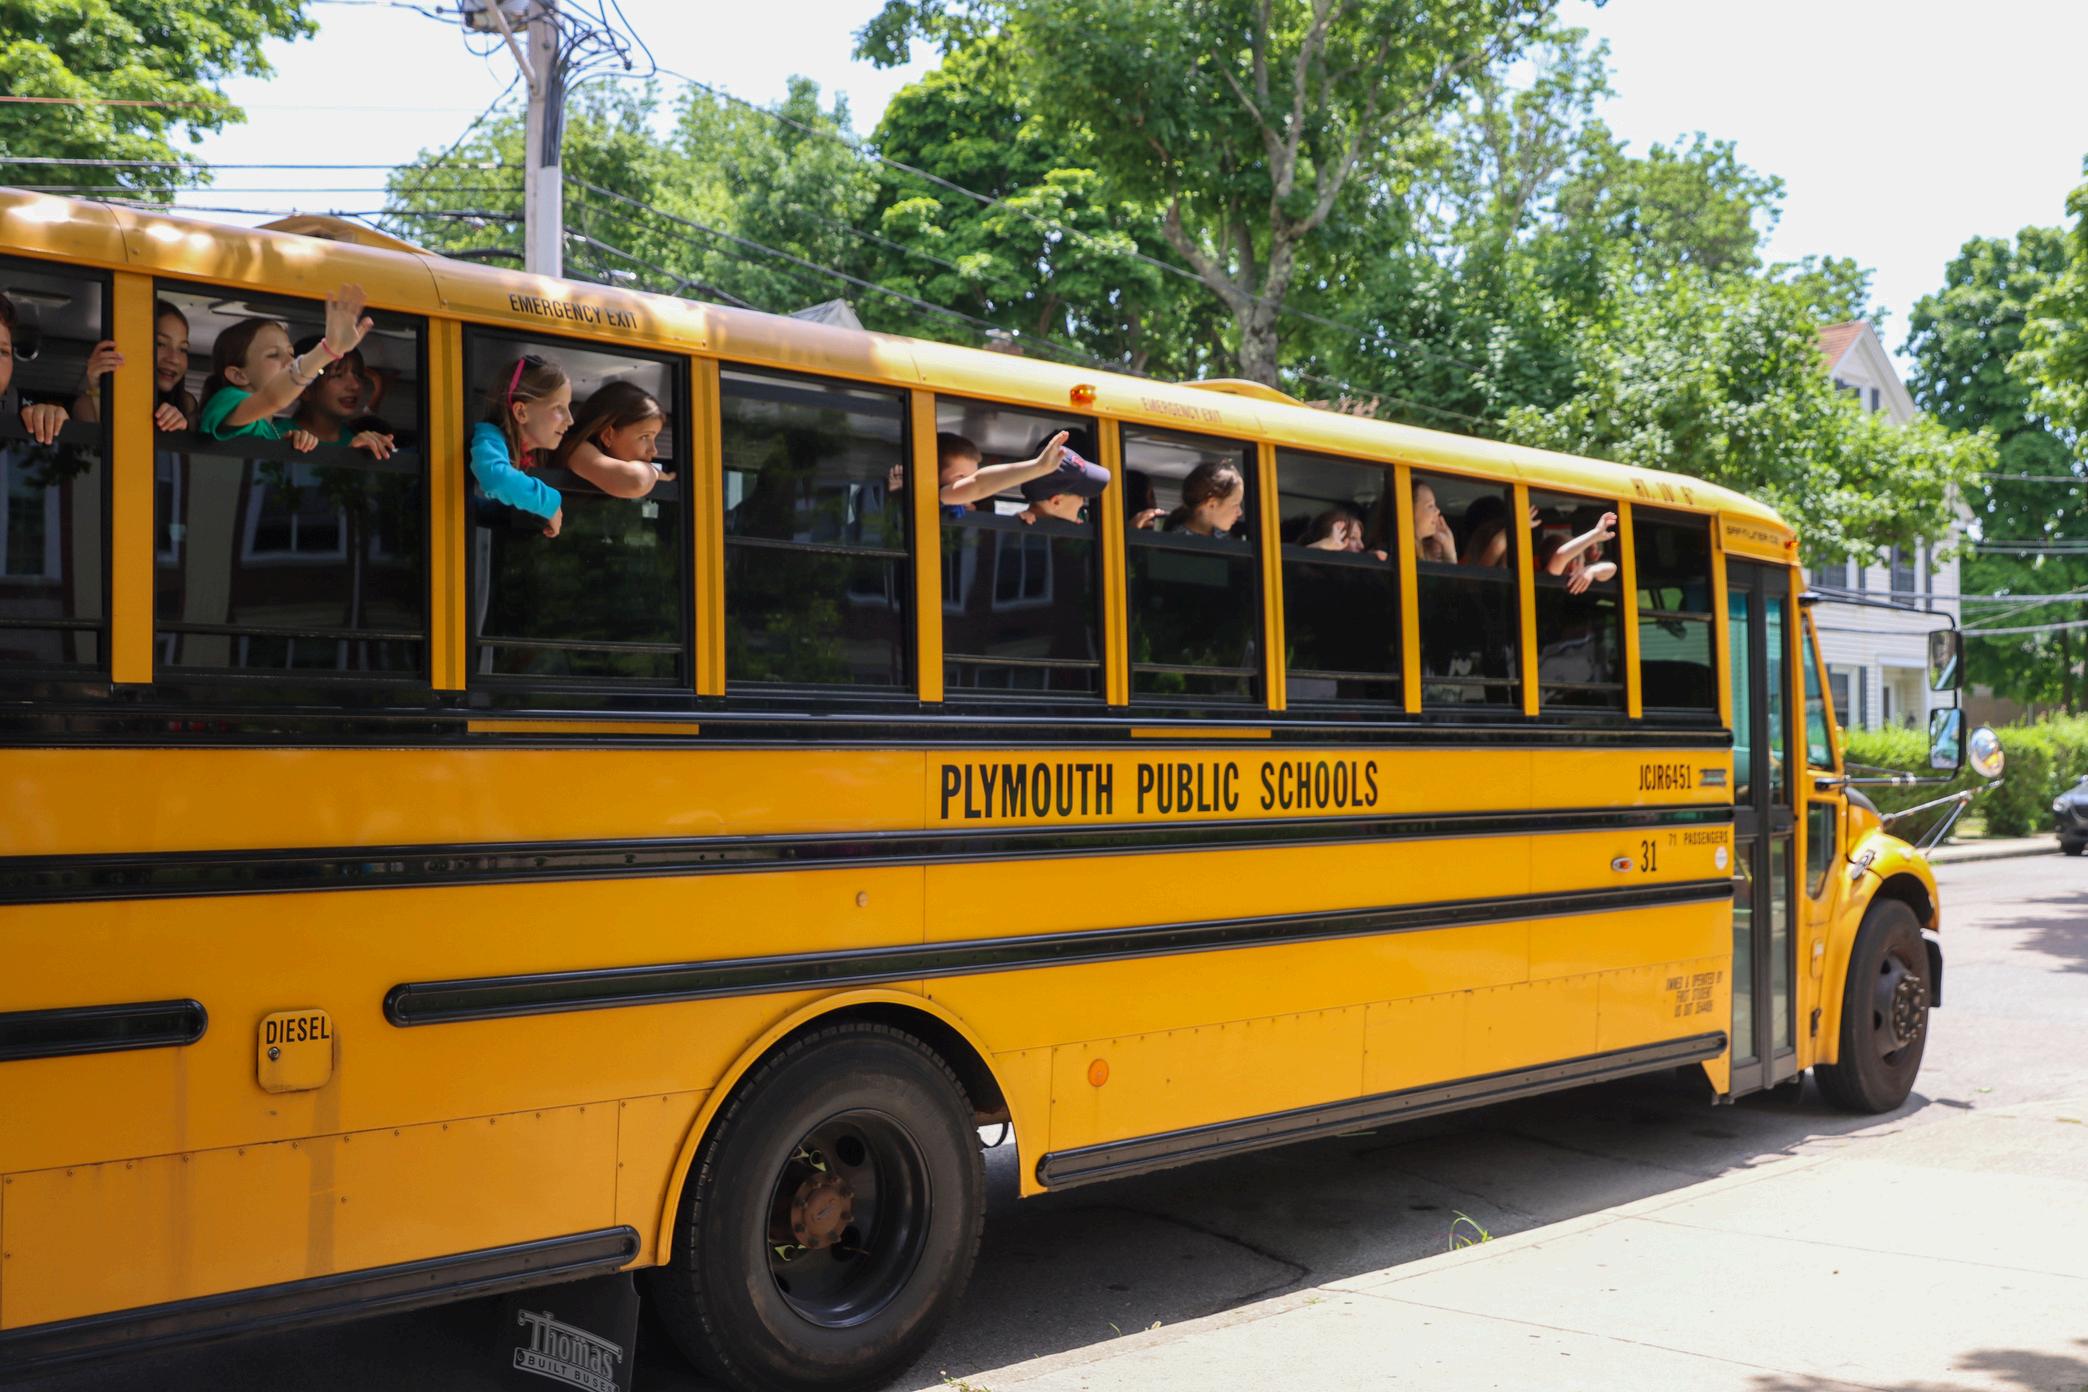
Our First Student buses travel 4,729 miles per day transporting our students to and from school. A total of 71 buses per day are used to for non-special education transportation, including:
2 Harbor Academy Buses (Plymouth run)
3 MAP Academy Buses (Plymouth run)
1 Bristol Agricultural Bus (Plymouth run)
65 First Student Buses (9 buses also drive for Rising Tide Charter School)
As approved by the School Committee, First Student will be in the second oneyear option of their contract in FY26. The First Student contract increases 2.75% for yellow school bus transportation In FY25, we pay $486.45 per bus per day or $87,561 per bus per year. In FY26, we will pay $499.83 per bus per day or $89,969.40 per bus per year.
VanPool will be in the third year of their five-year contract with an 8% increase over prior year for Special Education transportation. In addition, private vendors for Special Education transportation rates remain very high. Plymouth Public Schools will continue to conduct some routes as possible.
The crossing guard contract with Tarian Security will increase 5% in FY26, the last year of their contract.
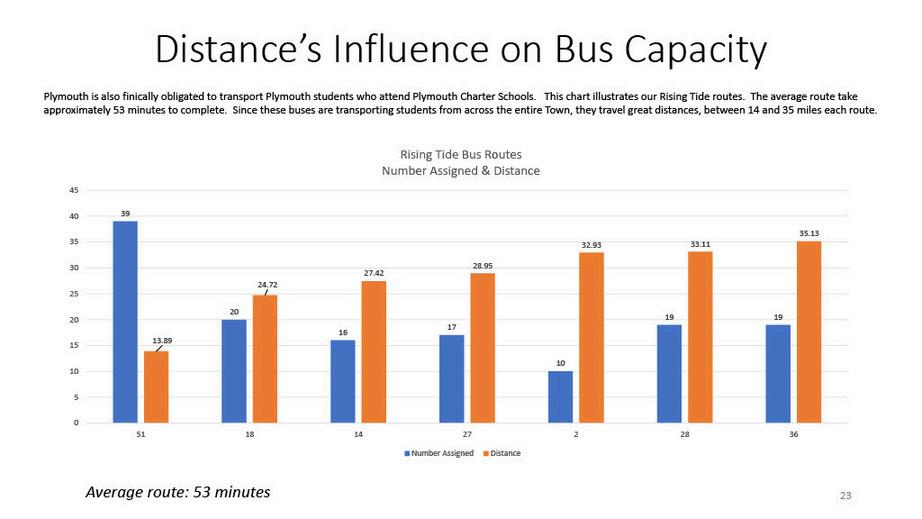
Transportation is a vital component of our operational budget, and understanding its complexities is essential for all of us While our district’s cost per bus route is lower than that of many other districts, our per pupil expense tends to be higher due to the unique challenges we face Covering over 104 square miles more than double the size of the second-largest town in Massachusetts our buses often travel long distances, and you may notice that some routes are not always at full capacity Navigating private roads and increased traffic complicates our ability to condense bus runs further, despite our ongoing efforts to do so
To address these challenges, we have recently acquired additional buses and vans, significantly reducing our transportation expenses Thanks to federal grants, we have saved over $170,000 annually by taking control of transportation for one of our charter schools and our alternative high school This action has also allowed us to rely less on contracted services for athletics and field trips, resulting in further savings for taxpayers
This year, we are undertaking a comprehensive transportation study in collaboration with the Massachusetts Association of Pupil Transportation Our goal is to enhance both the efficiency and quality of our transportation services while exploring options for internal transportation expansion
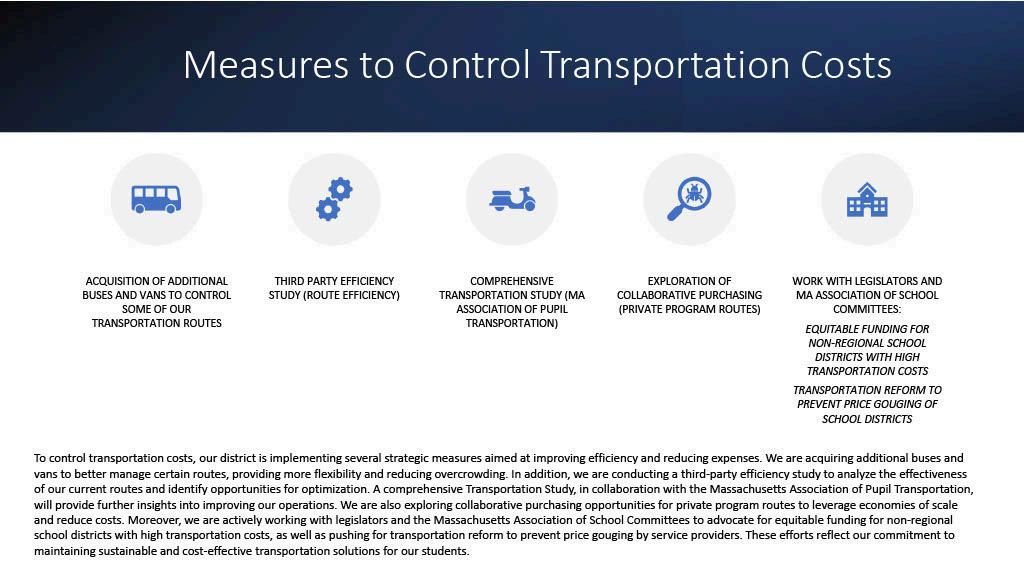
To control transportation costs, our district is implementing several strategic measures aimed at improving efficiency and reducing expenses. We are acquiring additional buses and vans to better manage certain routes, providing more flexibility and reducing overcrowding. In addition, we are conducting a third-part efficiency study to analyze the effectiveness of our current routes and identify opportunities for optimization. A comprehensive Transportation Study, in collaboration with the Massachusetts Association of Pupil Transportation, will provide further insights into improving our operations We are also exploring collaborative purchasing opportunities for private program routes to leverage economies of scale and reduce costs Moreover, we are actively working with legislators and the MA Association of School Committees to advocate for equitable funding for nonregional school districts with high transportation costs, as well as pushing for transportation reform to prevent price gouging by service providers These efforts reflect our commitment to maintaining sustainable and cost-effective transportation solutions for our students
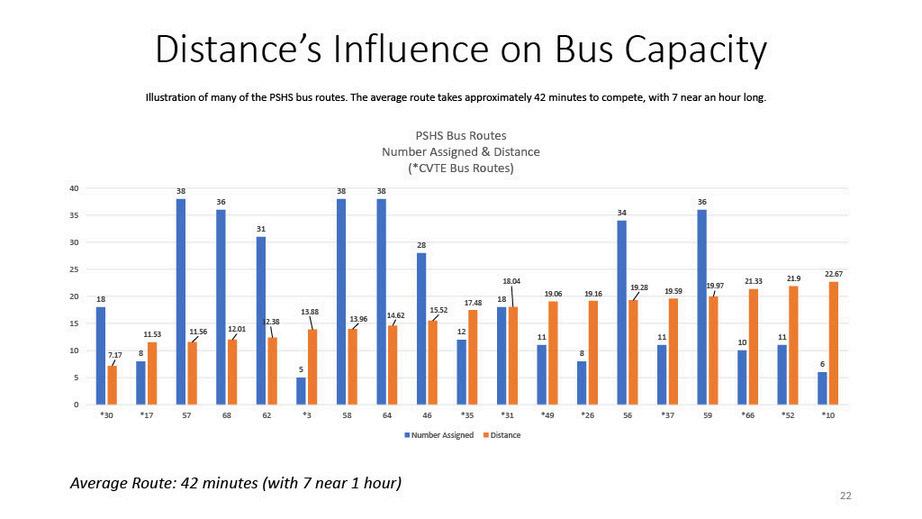
The table below illustrates a representational sample of our elementary bus runs. Our elementary buses are very occupied. When determining the number of students assigned to each bus, several key factors must be considered to ensure efficiency, safety, and timely transportation.
The number of students that can be safely assigned to each bus is influenced by the size of the bus and the overall capacity needed to accommodate students However, this number isn't fixed other logistical factors, such as the distance between students' homes and the school, play a significant role in capacity planning. Longer distances require more time for students to travel to and from school, which affects how many students can realistically be assigned to a bus. Balancing the distance with the number of students ensures that buses aren’t overcrowded while still keeping routes manageable. To minimize delays and ensure students aren’t on buses for excessive periods, routes must be designed thoughtfully, balancing route duration with the number of stops and students assigned.
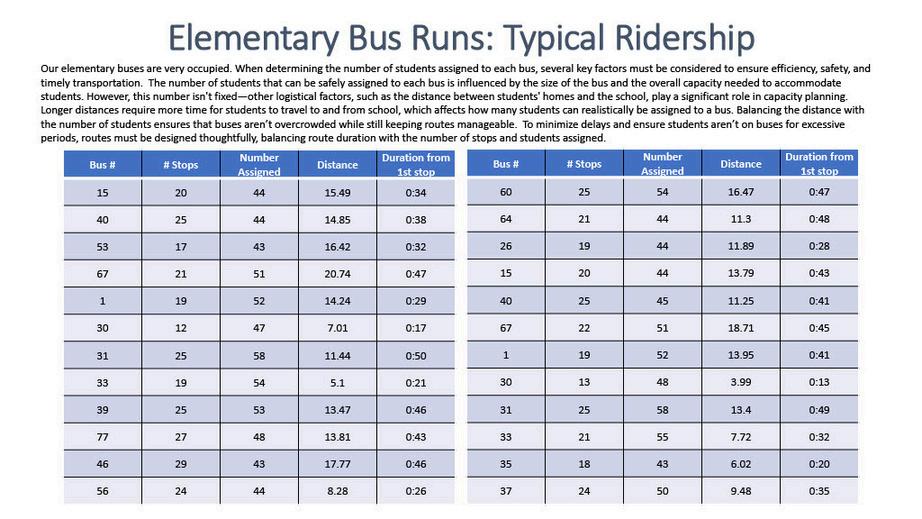
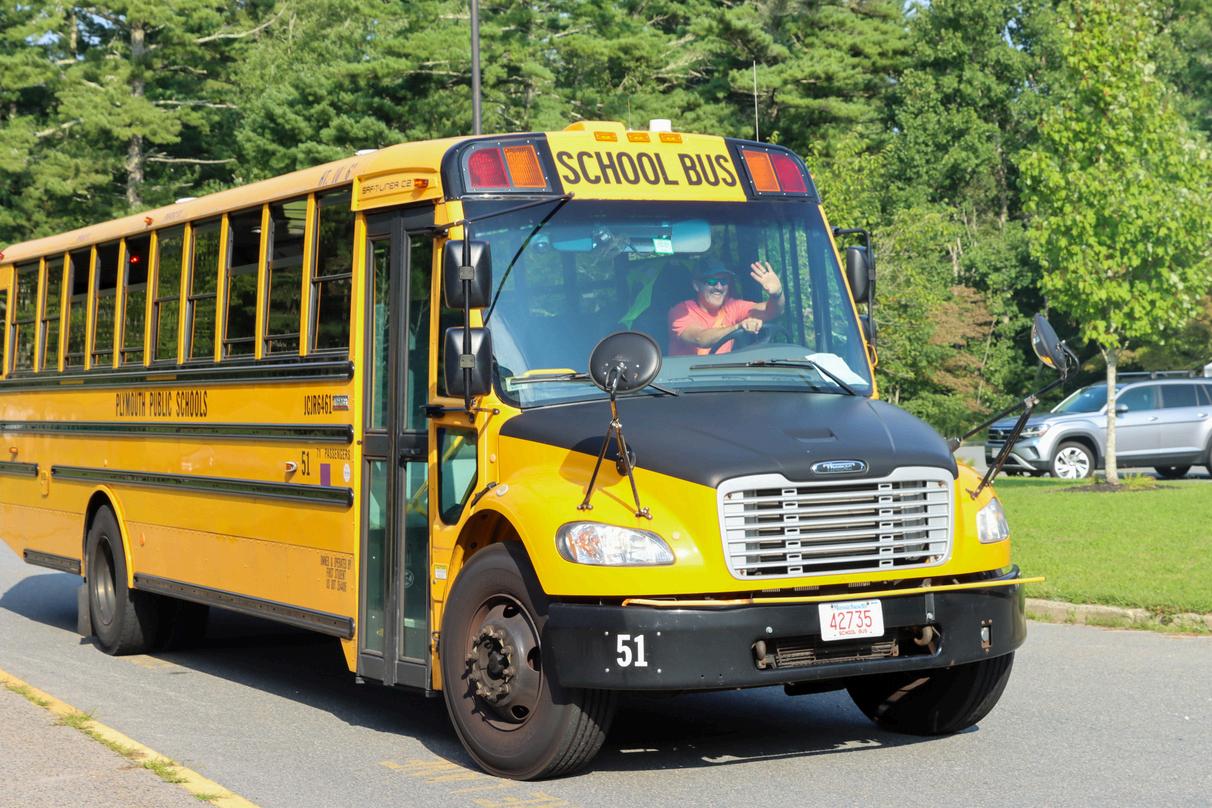
Illustration of many PSHS bus routes.
Average route takes approximately 42 minutes to complete, with 7 near an hour long.
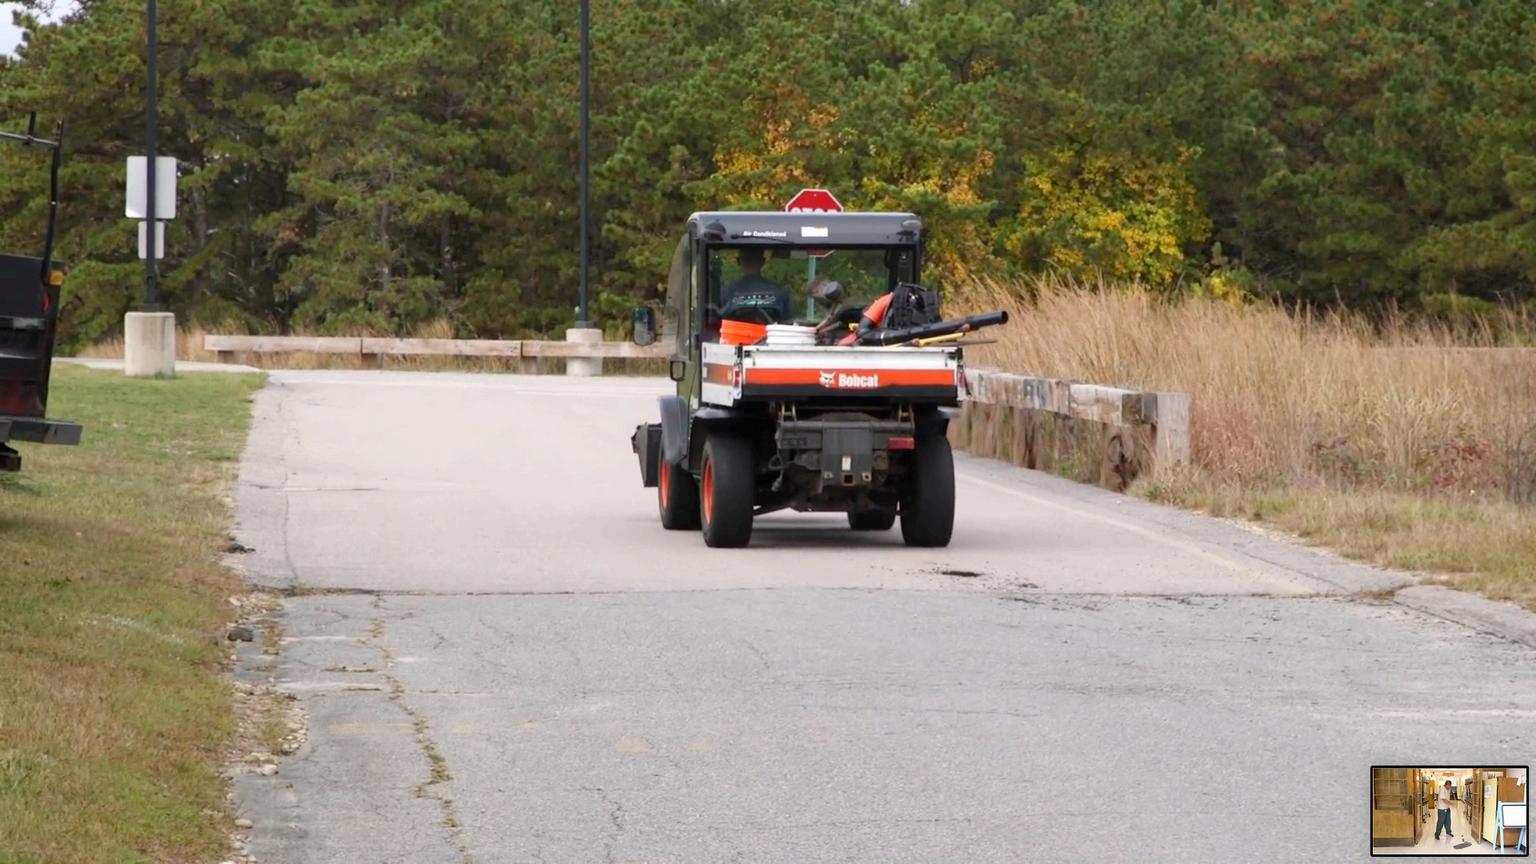
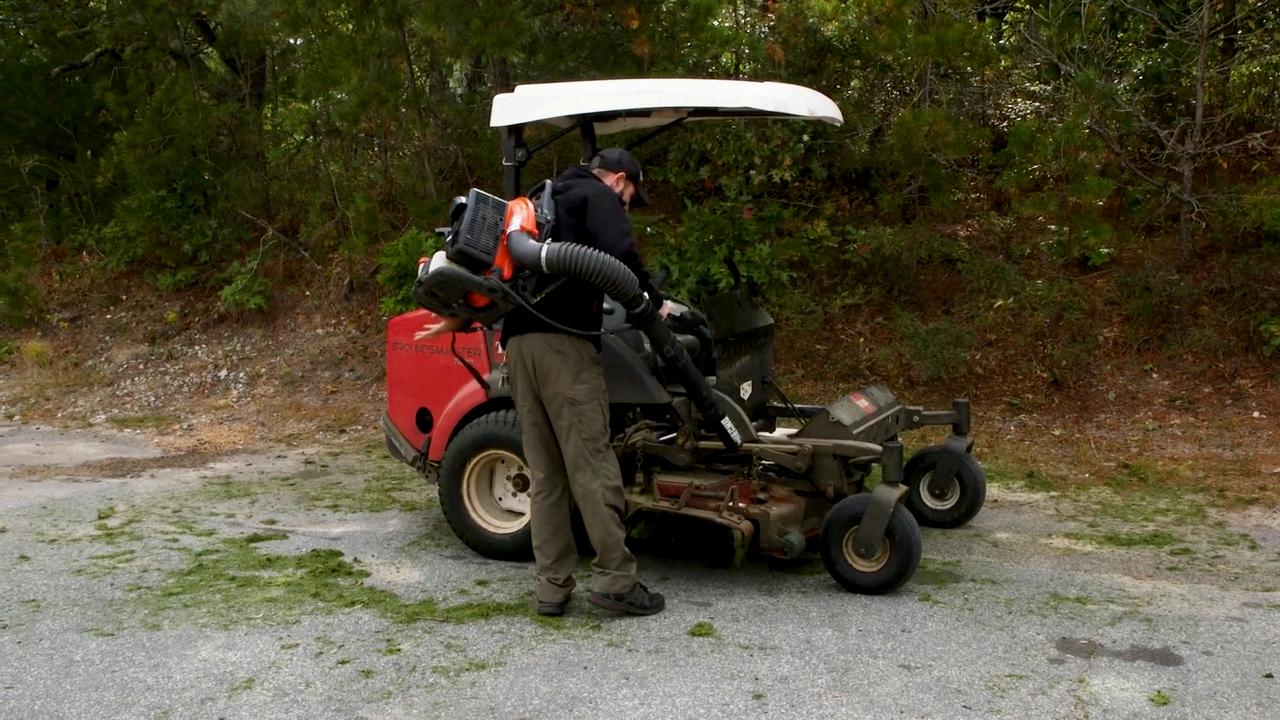
Our schools are more than just buildings; they are nurturing environments where our children learn, grow, and thrive. Ensuring the routine maintenance of these facilities is crucial, as it not only fosters a safe and comfortable learning atmosphere but also helps us avoid significant expenses in the future.
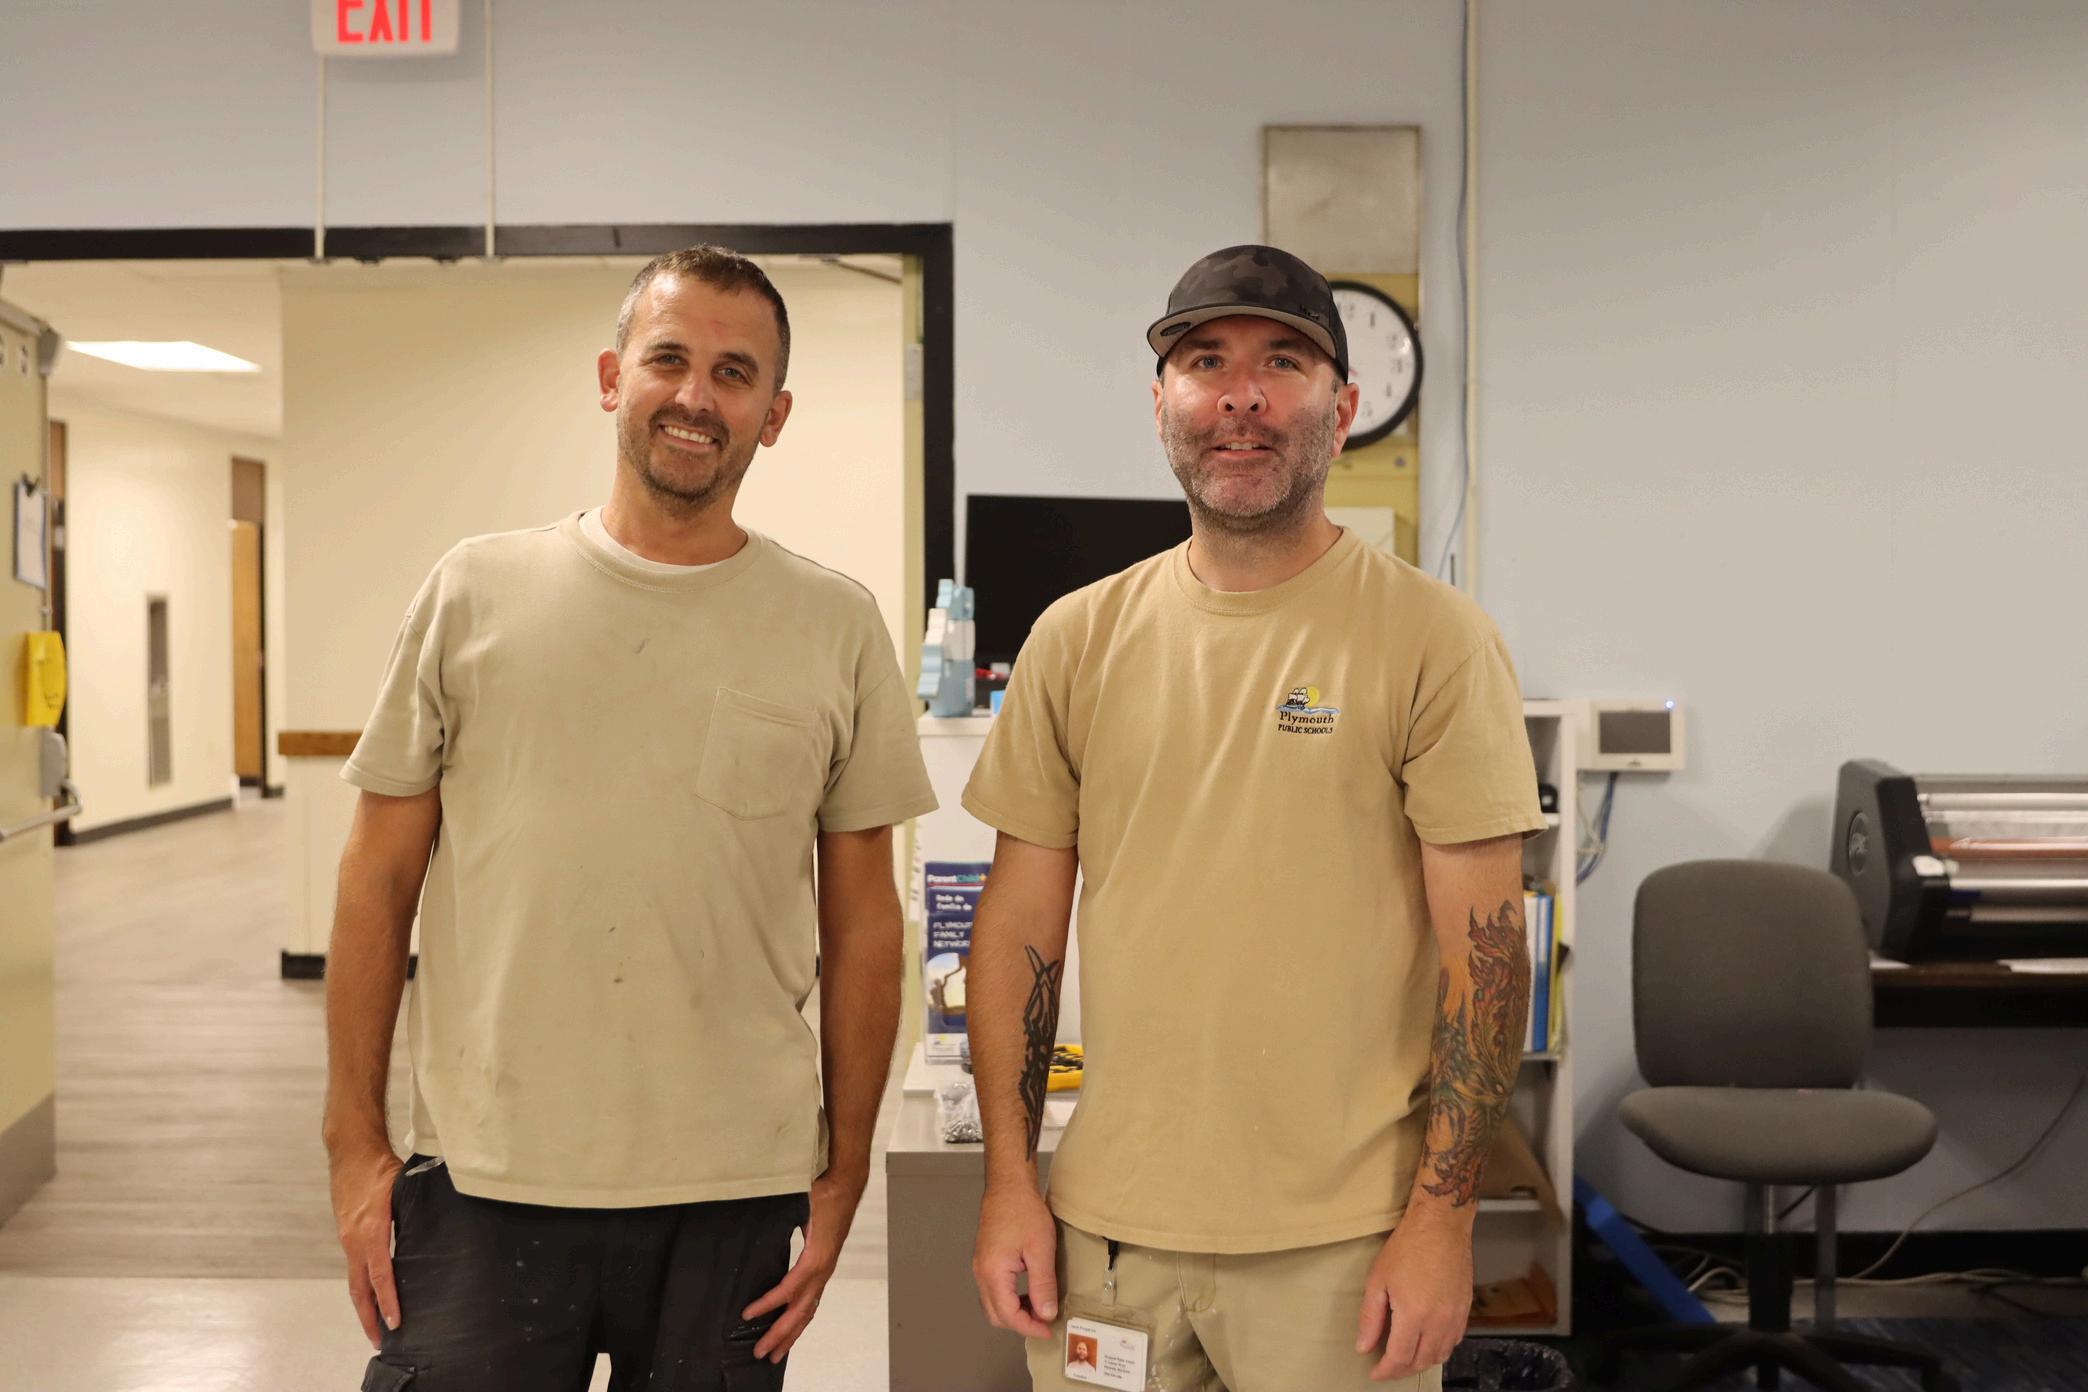
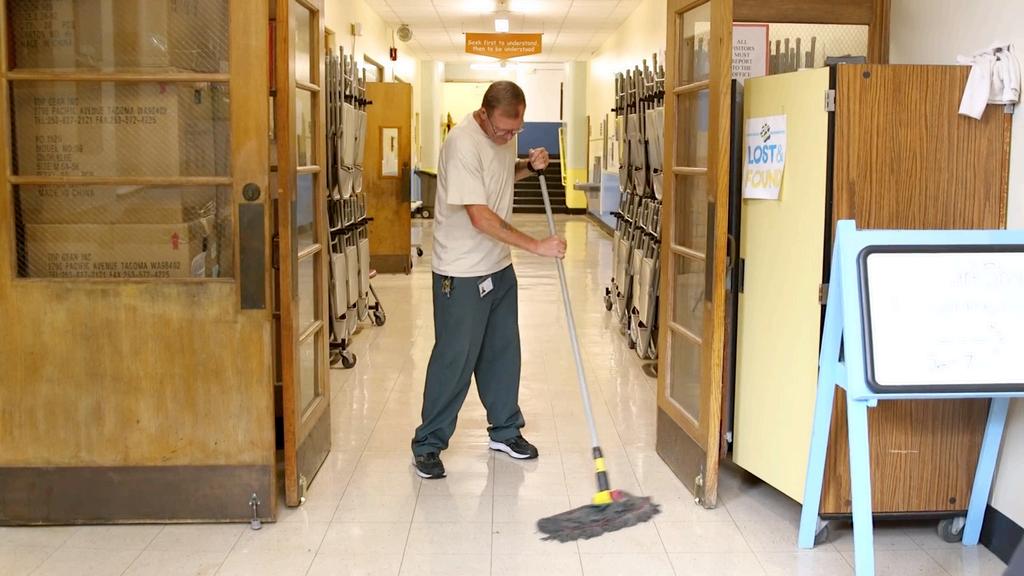
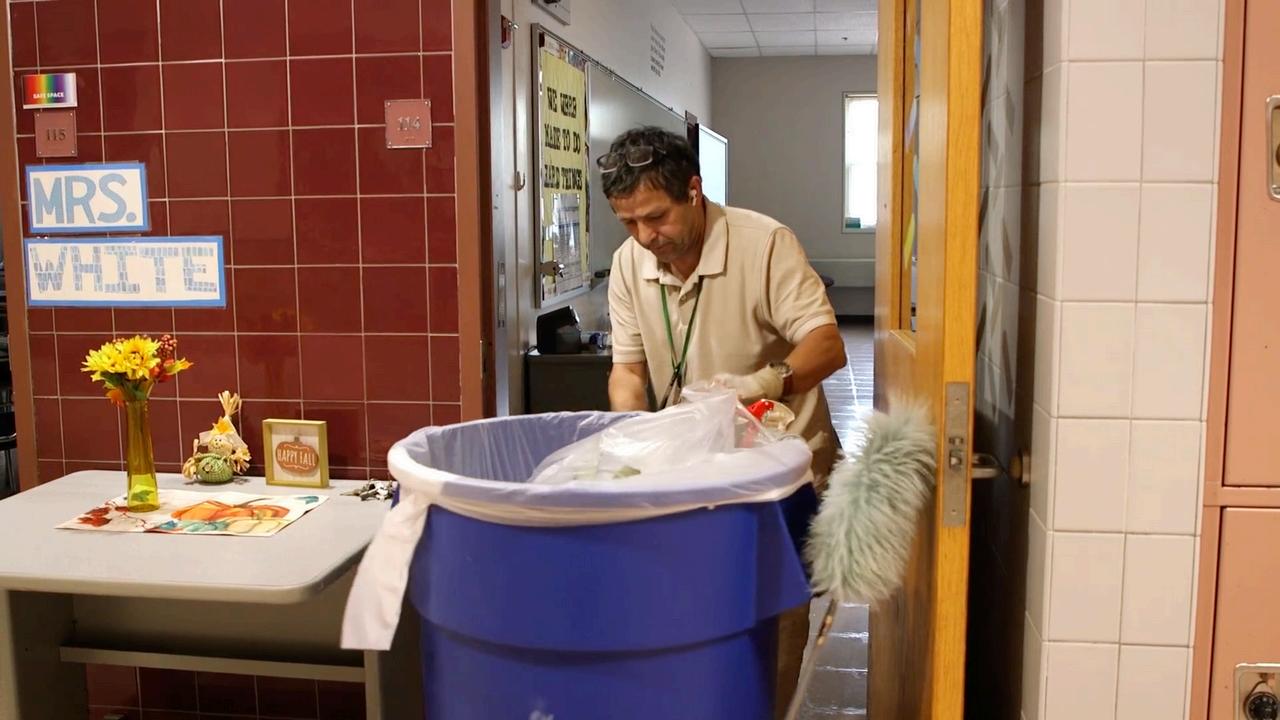
As our facilities age, they require careful attention We are fortunate to have a dedicated team of custodians and skilled craftsmen who work diligently to maintain over 1.4 million square feet of building space and 323 acres of grounds. Their expertise is invaluable in preventing small issues from escalating into costly repairs.
In July 2021, we conducted a comprehensive facilities condition assessment, which has provided us with a 20-year roadmap identifying necessary improvements across our schools. However, with numerous competing needs within the Town of Plymouth, it is challenging to address all capital improvement projects as quickly as we would like
Our operational budget allocates approximately $1.11 per square foot for facilities maintenance. Yet, when critical systems, such as HVAC units or boilers, fail, we often cannot afford to wait for additional funding. In these instances, we are compelled to transfer funds from other accounts, which in turn limits our capacity to support other important educational initiatives.
To tackle these challenges, we have submitted a Statement of Interest to the Massachusetts School Building Authority We are hopeful for significant grant funding that would allow us to construct a new elementary school This project would not only consolidate two aging facilities but also enable us to allocate capital expenses more effectively across our remaining buildings. Most importantly, it will enhance the educational environment for hundreds of students and staff.
Maintaining our schools is truly an investment in our children’s future. We must prioritize routine maintenance to create safe, functional spaces for learning. For more information about the topics discussed, please feel free to reach out to Mr. Matthew Durkee, Director of Facilities, or visit our website at plymouth.k12.ma.us/facilities.

When we communicate clearly about our financial strategies, we empower everyone to understand the rationale behind our budget decisions, fostering a sense of collaboration and trust. Our goal is to continuously enhance community understanding and support through various transparency initiatives. These include hosting informative sessions, publishing detailed financial reports, launching educational campaigns, and utilizing digital platforms for improved communication.
We oversee a $120 million operating budget, supplemented by state, federal, and competitive grants This budget supports not only our students but also the transportation and tuition for hundreds of students attending charter schools and agricultural programs Recognizing that school financing can be complex, we are committed to making our budget accessible and understandable through regular public discussions and comprehensive reporting.
During each school committee meeting, we present line-item reports that detail the budget for each cost center highlighting what has been funded, spent, and encumbered. These quarterly updates are vital for enhancing transparency and accountability, which, in turn, helps build trust within our community.
To further ensure responsible financial management, our finances undergo a thorough third-party audit every year. Independent auditors review our practices and compliance with regulations, producing detailed reports that reassure stakeholders of our commitment to managing public funds responsibly. By ensuring compliance and offering recommendations for improvement, we reinforce effective governance in our schools.
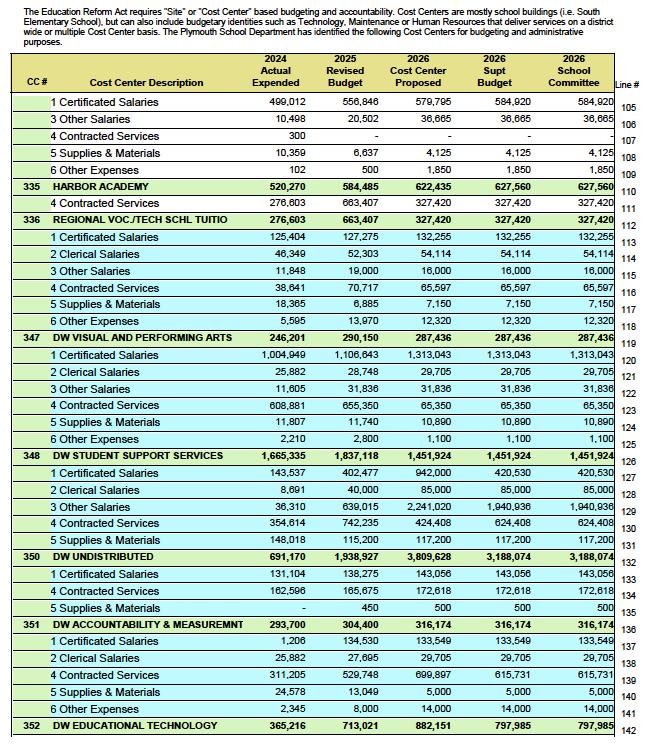
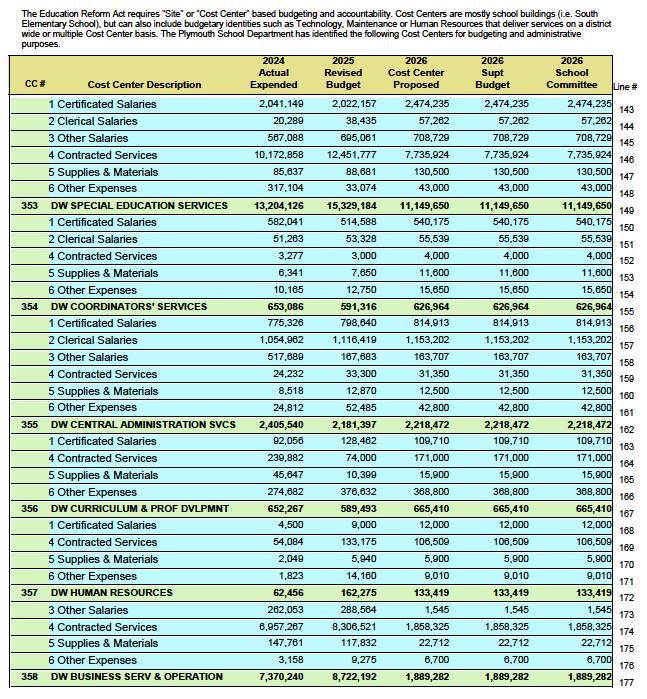
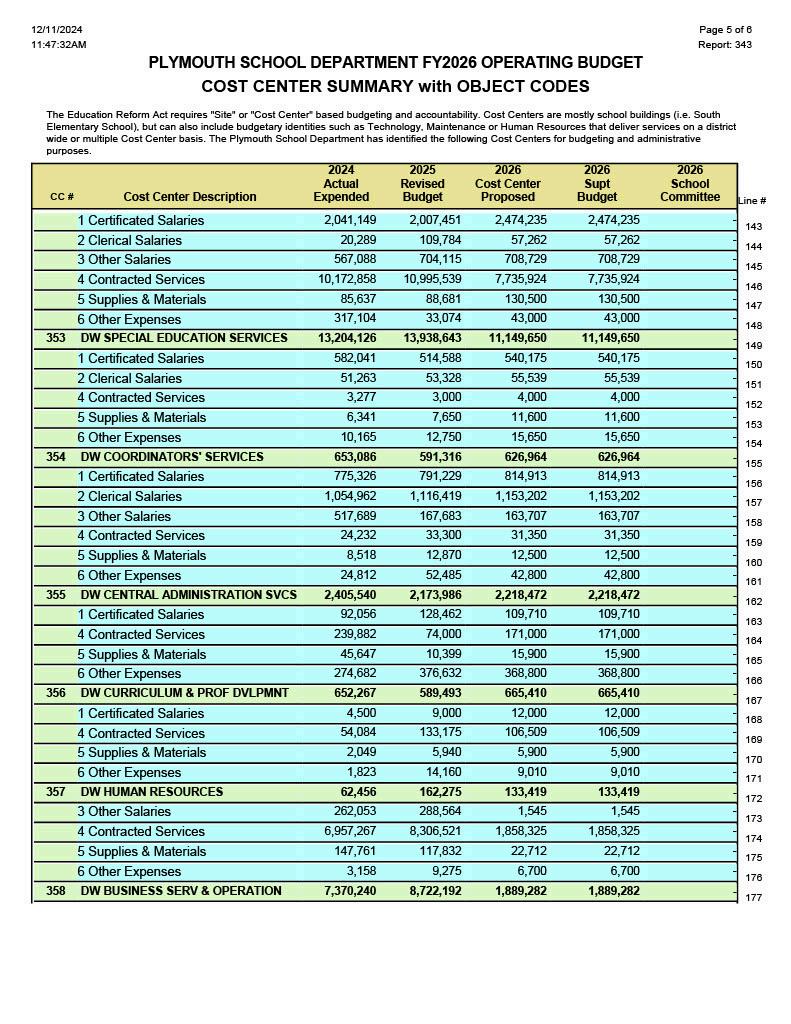
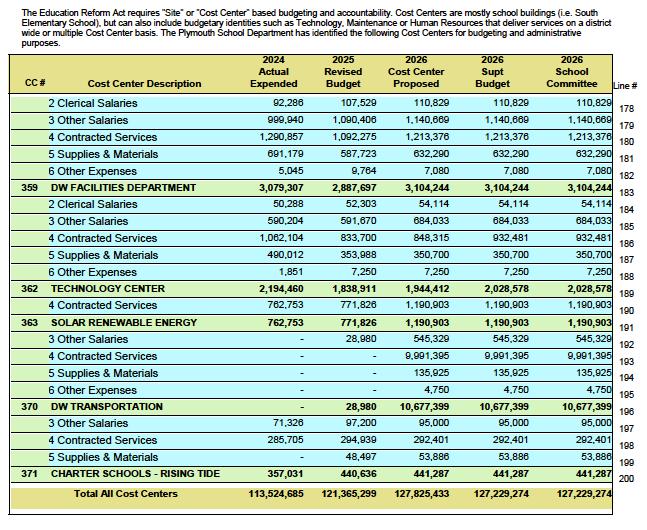
The Massachusetts Department of Education "Chart of Accounts" separates School Department budgets into six different "OBJECT" Codes.
The SALARY Accounts are separated into OBJECT Codes 1, 2, & 3: (1) CERTIFICATED SALARIES, (2) CLERICAL SALARIES and (3) OTHER SALARIES.
Codes 1, 2 & 3
Accounts
The NON-SALARY Accounts are separated into OBJECT Codes 4, 5, & 6: (4) CONTRACTED SERVICES, (5) SUPPLIES & MATERIALS and (6) OTHER EXPENSES
Total Non-Salary Accounts
Total Salary and Non-Salary All Object Codes 1 - 6
78,406,935 3,609,517 15,778,049 97,794,501 25,885,402 2,813,728 735,643 29,434,773
The Massachusetts Department of Education "Chart of Accounts" separates School Department budgets into six different "OBJECT" Codes.
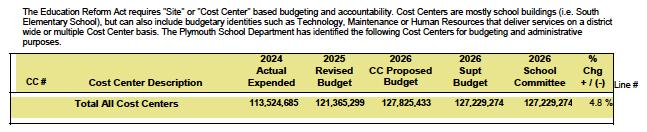
Column 1 represents last year's FY 2024 Actual Expenses of 113,524,685
Column 3 represents the FY 2026 CC Proposed budget with contract obligations
Column 4 represents the FY 2026 Superintendent's Budget of 127,229,274 which is a 4 76% increase over FY 2025 revised budget
represents
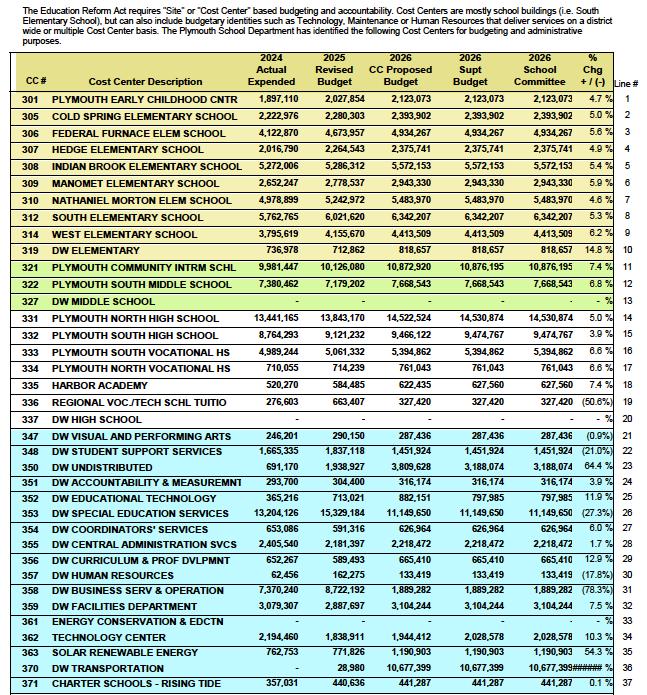
Plymouth School Department FY26 Operating Budget COST CENTER SUMMARY
Report 342 2/2

Plymouth School Department FY26 Operating Budget COST CENTER SUMMARY w/ OBJECT CODES
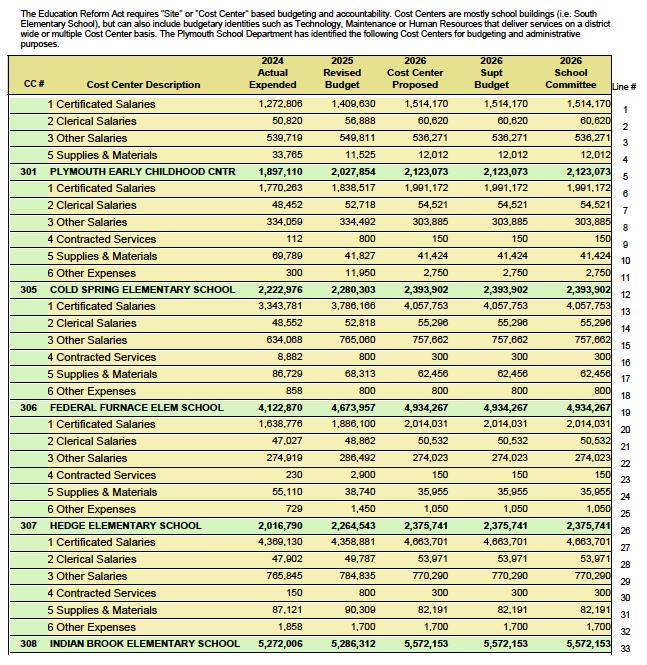
Report 343 1/6
Plymouth School Department FY26 Operating Budget COST CENTER SUMMARY w/ OBJECT CODES
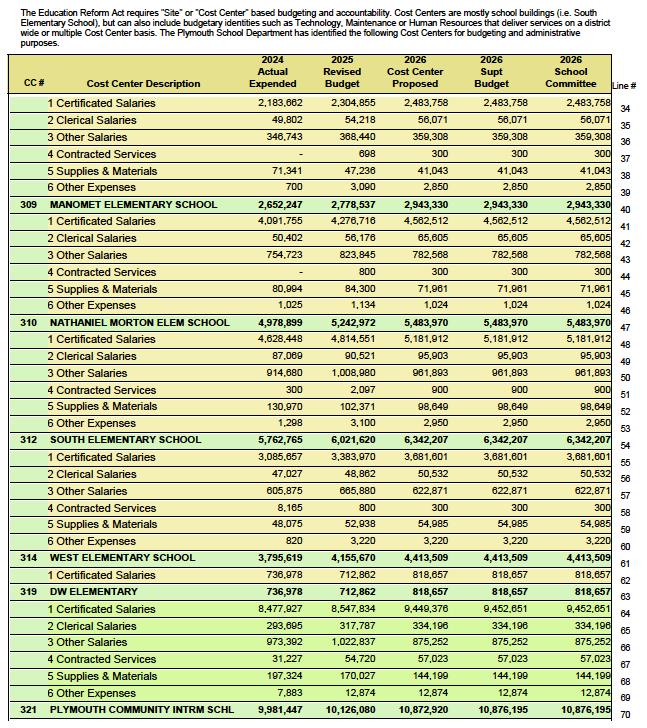
Report 343 2/6
Plymouth
Report 343 3/6
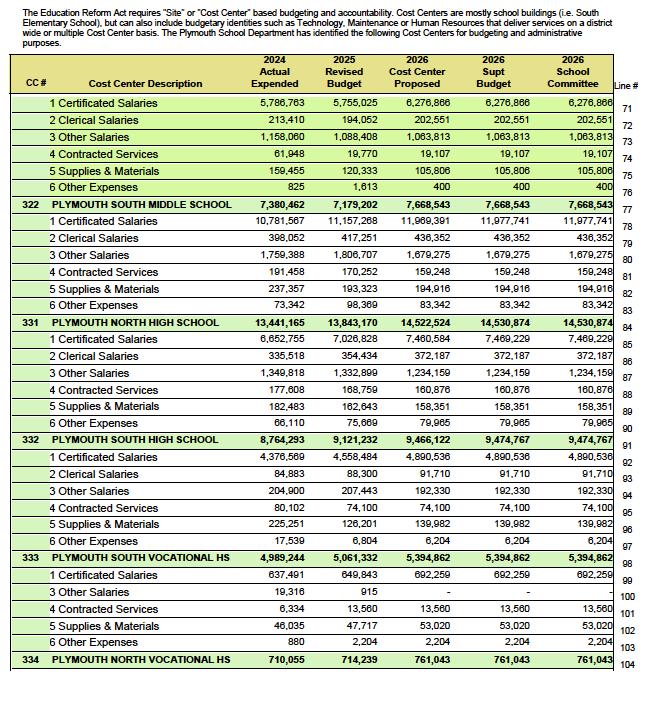
Plymouth School Department FY26 Operating Budget COST CENTER SUMMARY w/ OBJECT CODES
Report 343 4/6
Plymouth School Department FY26 Operating Budget COST CENTER SUMMARY w/ OBJECT CODES
Report 343 5/6
Plymouth School Department FY26 Operating Budget COST CENTER SUMMARY w/ OBJECT CODES
Report 343 6/6
View videos in which Superintendent Dr. Campbell and School Business Administrator Dr. Blaisdell break down the multifaceted process behind budget development on our Budget Webpage at plymouth.k12.ma.us/budget.
View the entire Cost Center Account Detail Report for FY26 by scanning the QR code or visiting the Business Services page on our website at plymouth.k12.ma.us/business.
Find school- and district-level data relative to enrollment and achievement, educators, and district indicators such as per pupil spending.
If you have any questions about the budget development process, don’t hesitate to reach out to the following contacts:
Dr. Christopher Campbell, Superintendent of Schools ccampbell@plymouth.k12.ma.us (508) 224-5035
Dr. Adam Blaisdell, School Business Administrator ablaisdell@plymouth.k12.ma.us (508) 830-4315
Mr. Matthew Durkee, Director of Facilities mdurkee@plymouth.k12.ma.us (508) 830-4005
Visit our website at www.plymouth.k12.ma.us for more information.
As Superintendent of Plymouth Public Schools, I take great pride in our students' achievements, which enhance their education and strengthen our community.
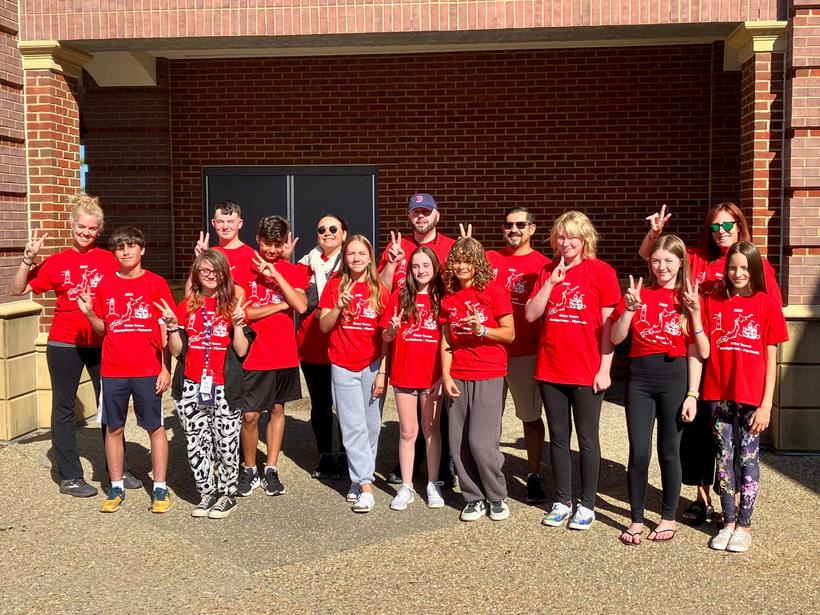
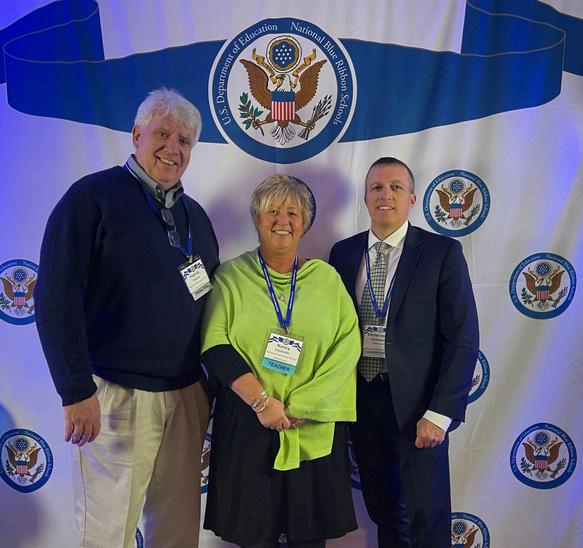
Our dedication to academic excellence shines through diverse programs, including our Biomedical Program and a strong selection of Advanced Placement (AP) courses that allow students to earn college credit while in high school. Our schools have received accolades like National Blue-Ribbon Status, and our Student Council has earned the Gold Council of Excellence designation, reflecting our students' leadership and community engagement.
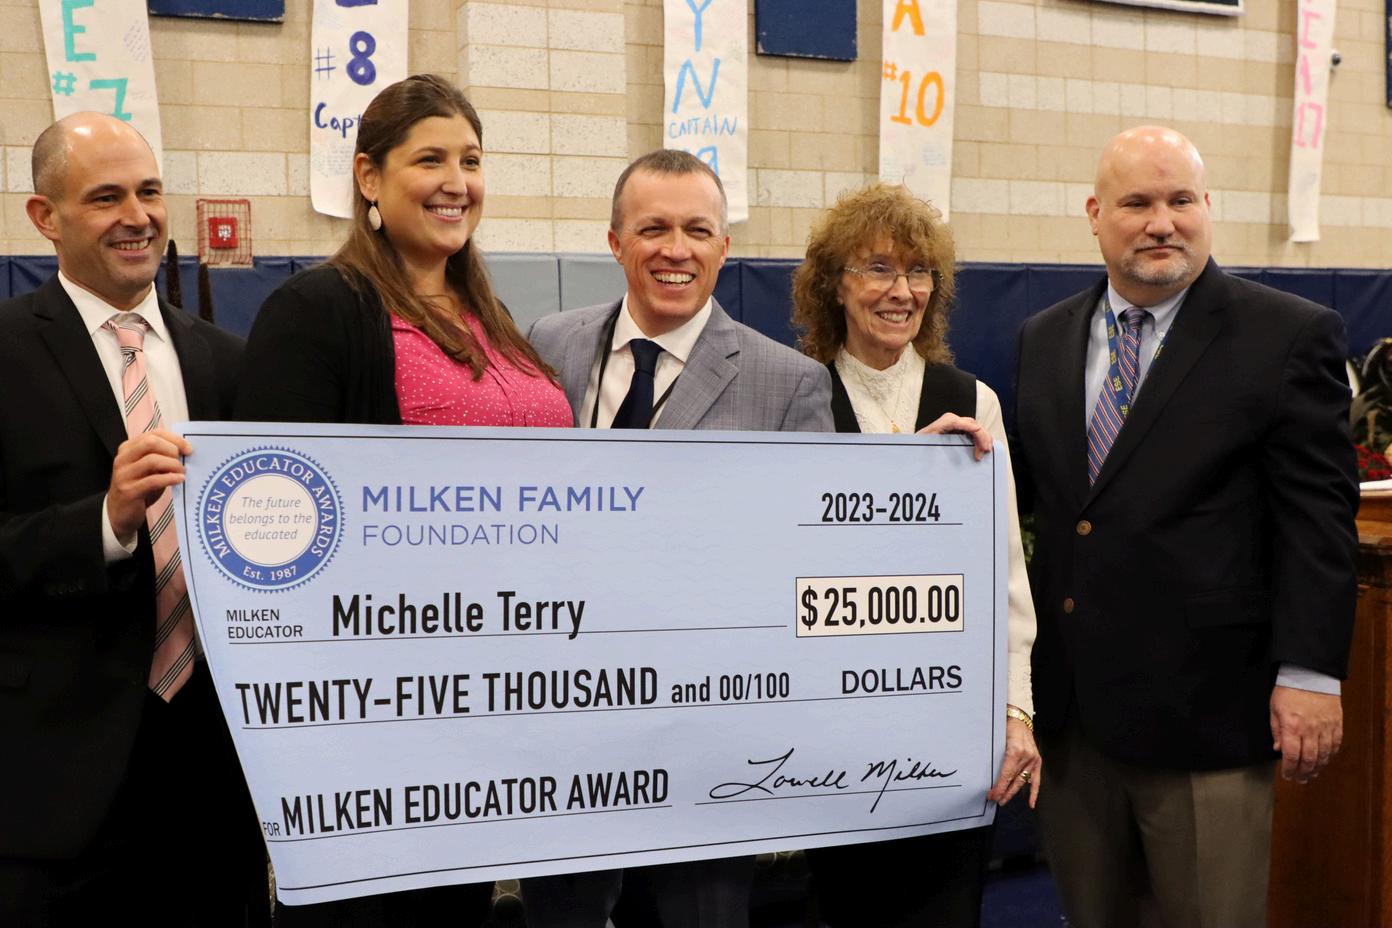
The dedication of our educators is equally impressive, with several State and National Teacher Award recipients inspiring our students to excel Our partnerships with local organizations, such as the Chamber of Commerce and the Plymouth Education Foundation, foster a supportive environment Initiatives like the Yellow Tulip Project promote mental health awareness, ensuring our students are well-rounded
International experiences further enrich our students' education through partnerships with schools in the UK, Japan, and Italy, as well as educational trips to countries like France and Iceland. We also take pride in programs encouraging young women to pursue careers in technology, promoting gender equity in STEM.
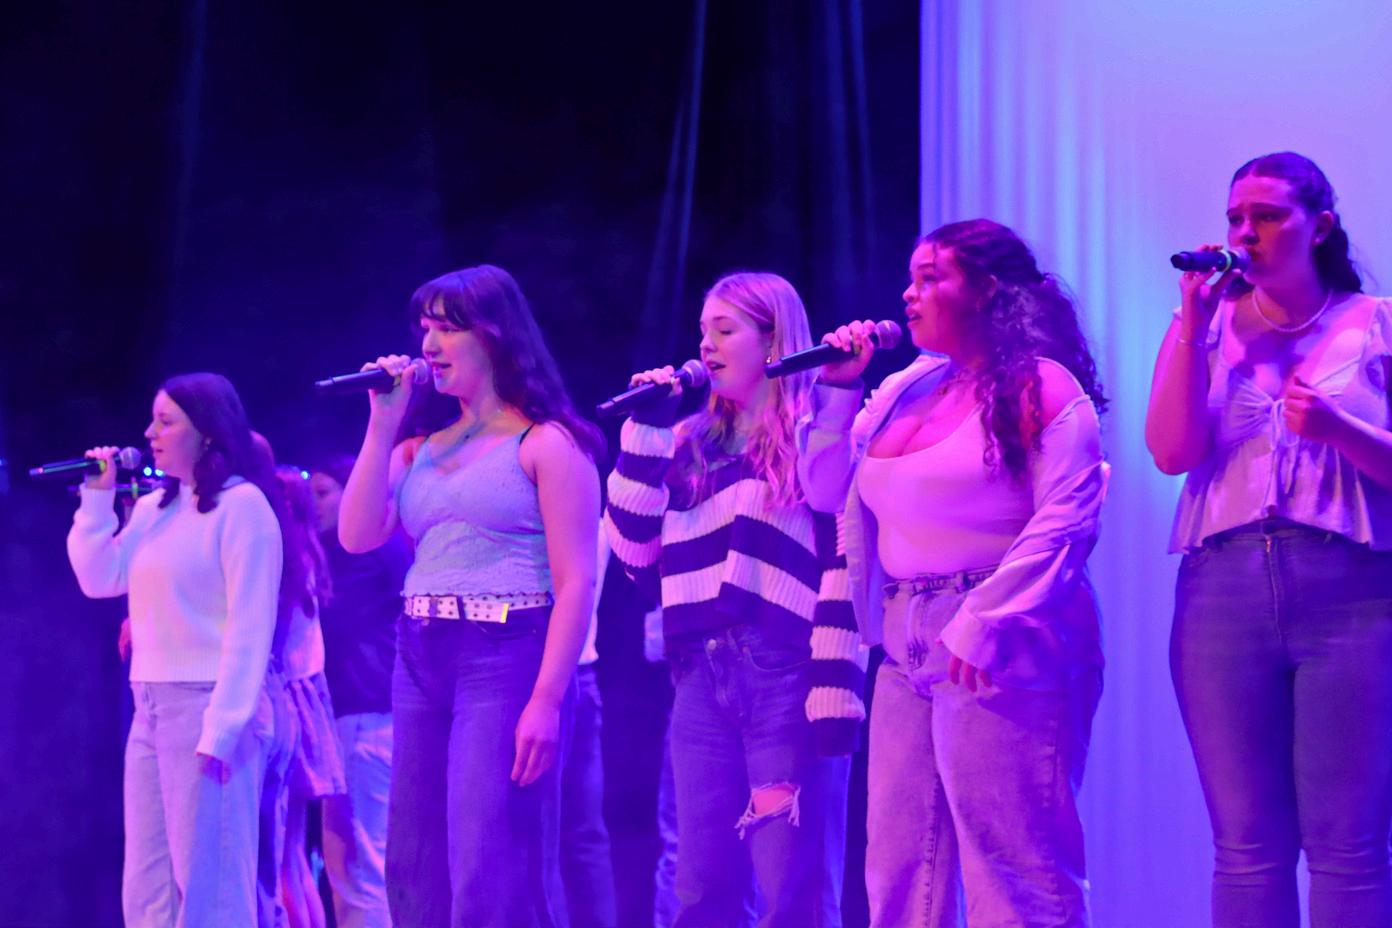
Our arts programs flourish, with our Television/Media students earning accolades from the National Academy of Arts & Sciences and our a cappella groups achieving national recognition. Our musicians frequently excel at events like the Annual SEMSBA and are honored as All State and All District performers
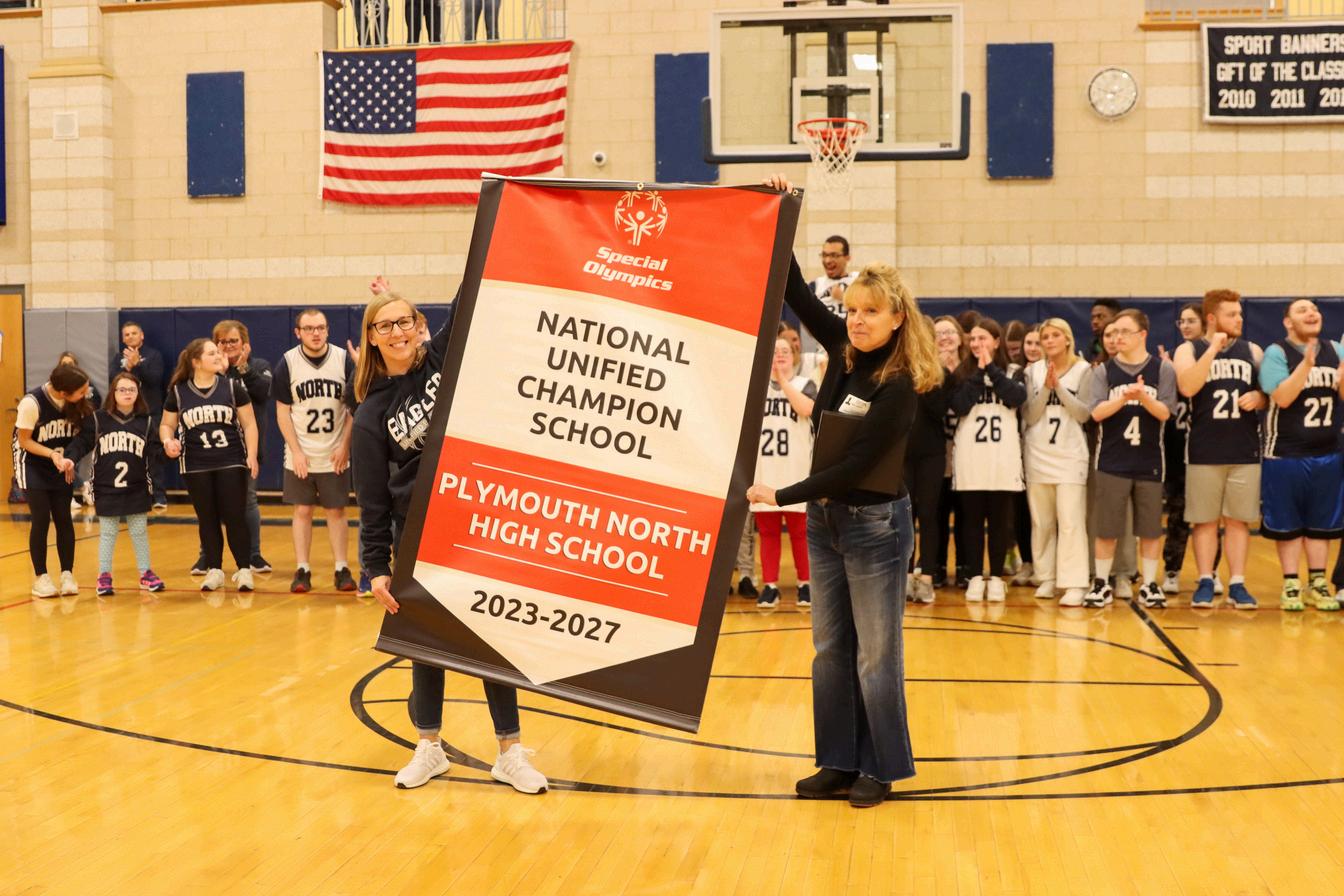
Athletics are inclusive through our Unified Sports Program, and 93% of our teams qualified for state tournaments this past year Our students have excelled in competitions, including many SkillsUSA National Champions and DECA medalists at various levels
These achievements reflect the hard work of our educators, families, and community partners. Together, we are enhancing students' lives and contributing to a vibrant community. I invite you to celebrate these accomplishments and support our ongoing efforts to provide exceptional educational opportunities. Thank you for being a vital part of our journey toward a brighter future.
Sincerely,
Christopher S. Campbell, Ed.D. Superintendent of Schools