


LIVEABILITY PLATFORM EXECUTIVE SUMMARY NOV 2020

• Research Study Summary – 4
• About The Respondents – 5
• Executive Summary – 6

• Introduction – 9
• Port Stephens Top 15 Care Factors – 10
• Neighbourhood Liveability – 11
• Neighbourhood Liveability Breakdown – 12
• Place Dimensions and Promotion - 13
• LGA Strengths and Priorities – 14
• Strengths And Priorities by Theme – 15
• Open Space – 16
• Economy – 17
• Movement – 18
• Housing and development – 19
• Social Facilities and Services – 20
• Community Connection – 21
• Community Ideas For Change – 22


Place Score offers two sophisticated data collection tools, Care Factor (CF) survey and Place Experience (PX) Assessments.
Like a ‘place census’, Care Factor captures what your community really values, while PX Assessments measure the community’s lived place experience.
Together they help you identify what is important, how a neighbourhood is performing, and what the focus of change should be. An attribute with a high CF but a low PX should be a priority for investment as it will have the most positive impact on the most amount of people.

The Liveability Platform provides instant access to our community's Place Score data. Explore the dashboard to identify their priorities and better understand local values, neighbourhood liveability scores and community ideas for change.
To access your Liveability Platform contact:
• Amber.Herrmann@portstephens.nsw.gov.au
• Elizabeth.Akerman@portstephens.nsw.gov.au
• Rachna.Sangwan@portstephens.nsw.gov.au
Or get in contact with Place Score directly at: amulya@placescore.org
Between 1 September and 5 October 2020, Place Score, on behalf of Port Stephens Council, collected online surveys: 3,536 people shared their values (CF) 1,638 people rated a neighbourhood (PX) 3,606 people shared their ideas for change

These community insights are the basis of your Liveability Platform, which identify key investment areas for the LGA, by neighbourhood and for key demographic groups.
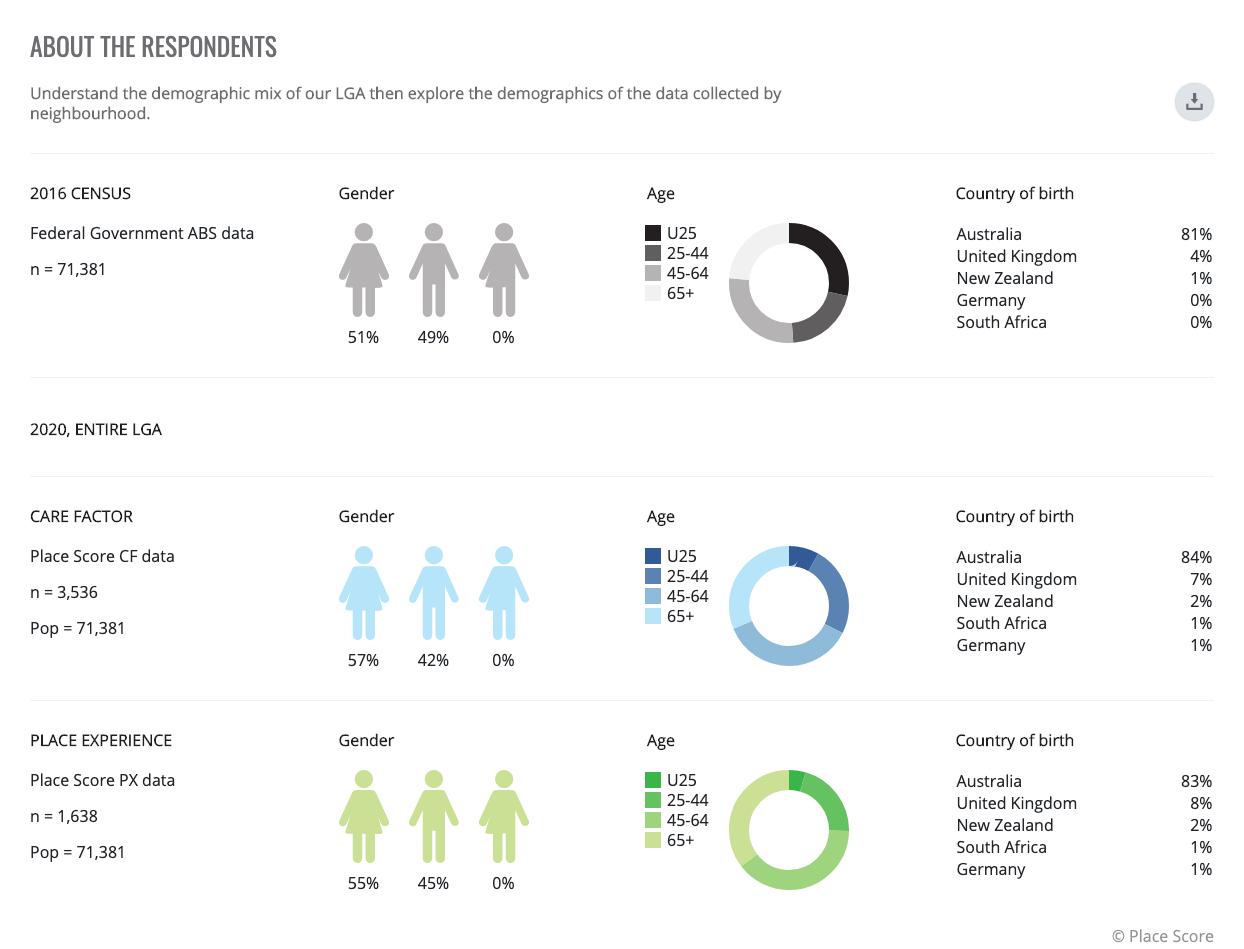
DEMOGRAPHIC TARGET (ABS) ACHIEVED CONFIDENCE
ALL 800 3,536 99% +-2.2%
FEMALE 404 2,027 99% +-2.9%
MALE 395 1,496 99% +-3.3%
15-24 228 286 90% +- 4.9%
25-44 162 858 99% +-4.4% 45-64 219 1,286 99% +-3.6% 65+ 191 1,106 99% +-3.9%
DEMOGRAPHIC TARGET (ABS) ACHIEVED CONFIDENCE
ALL 600 1,638 95% +-1.2pts
FEMALE 303 906 95% +-1.6pts
MALE 297 731 95% +-1.8pts
15-24 171 73 90% +-4.8pts
25-44 122 340 95% +-2.7pts 45-64 164 644 95% +-1.9pts
65+ 143 581 95% +-2.0pts


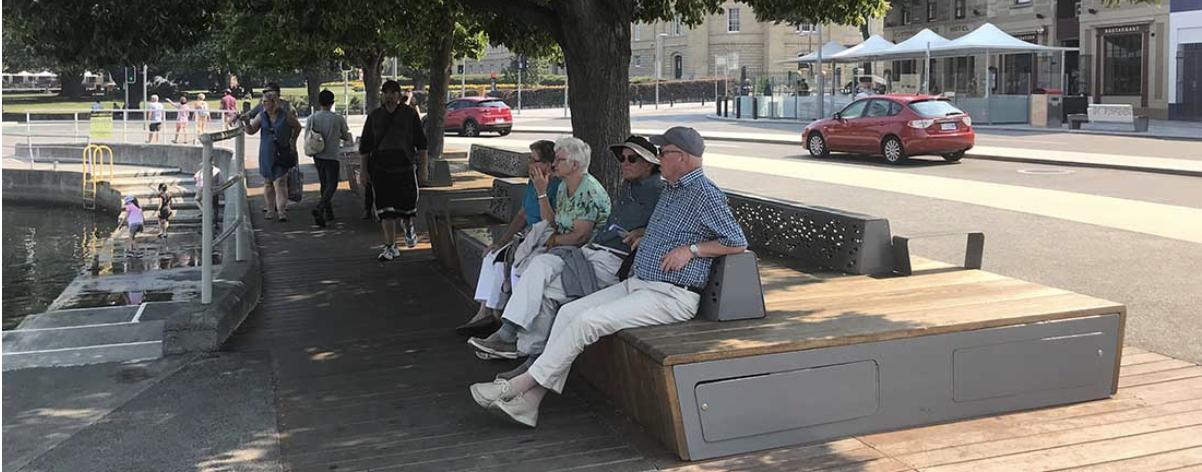
The Port Stephens community aspires to neighbourhoods that feature unique natural elements, views, landscapes or vegetation.
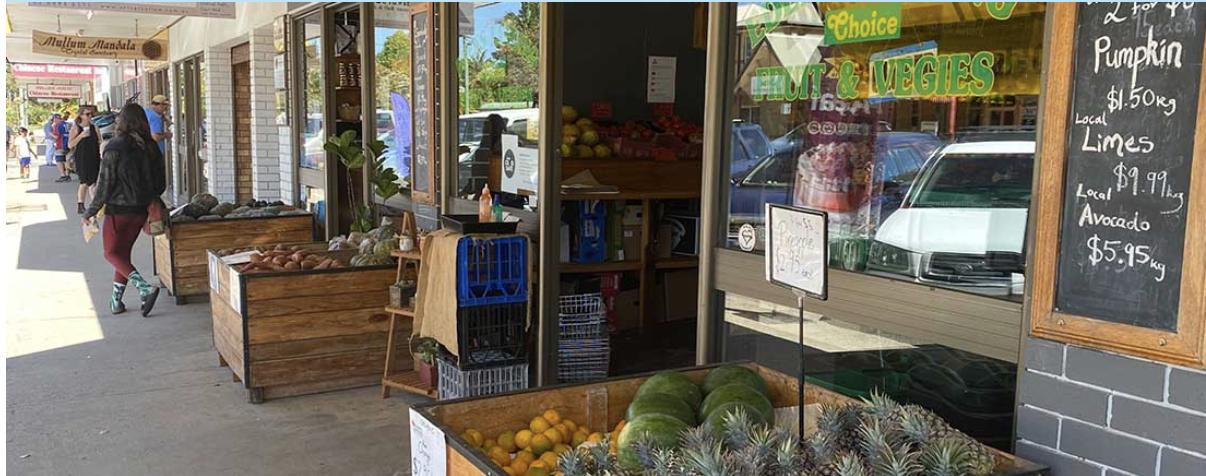
Neighbourhoods should feature locally owned and operated businesses that provide the community with their daily needs.
Neighbourhoods should offer shared community amenities, like local shops within walking or cycling distance.
Neighbourhoods should have well maintained and managed public domain; footpaths, parks, roads and other public assets.

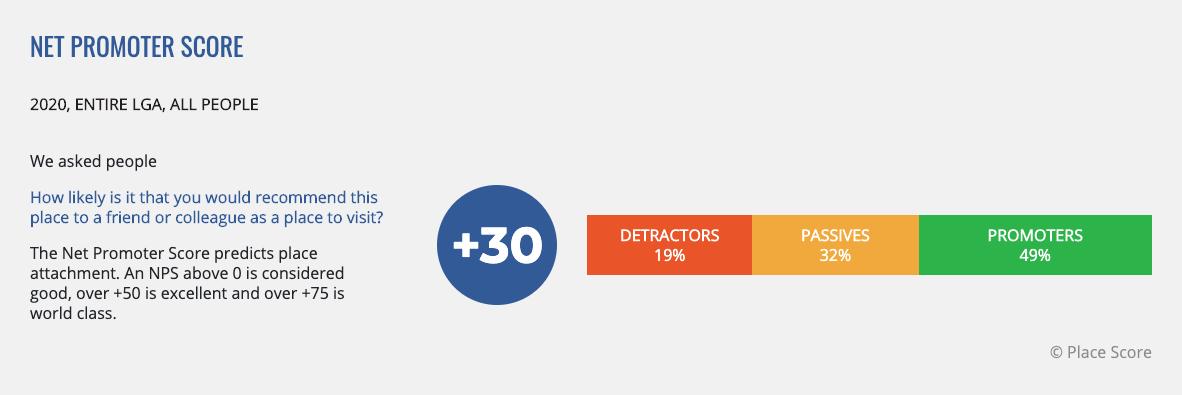
Port Stephens LGA received an average score of 66/100. Only one point lower than the national average. Neighbourhoods located in the Tomaree Peninsula received the highest the liveability scores.

Net promoter score (NPS)1
66 / 100
Area with the highest liveability score2 Fingal Bay (75/100)
Port Stephens’ best performing attribute3 Elements of natural environment (natural features, views, vegetation, topography, water, wildlife etc.)
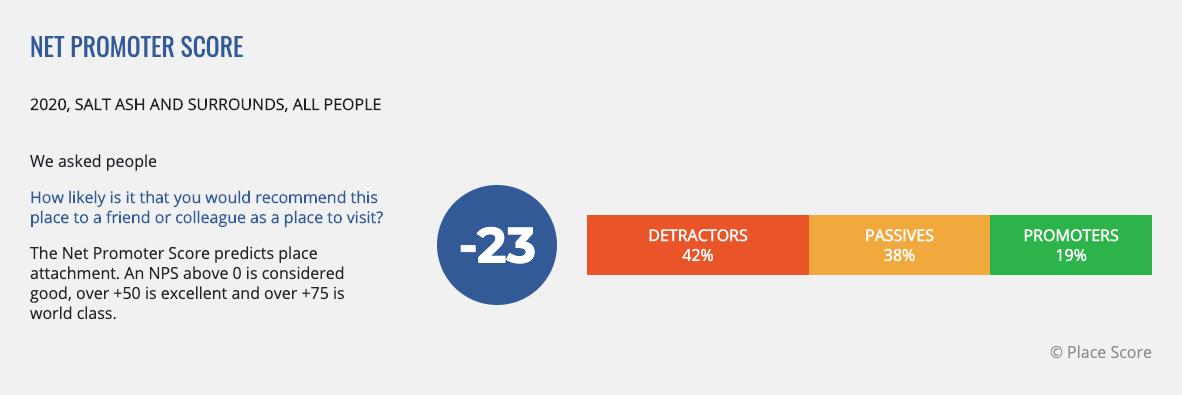
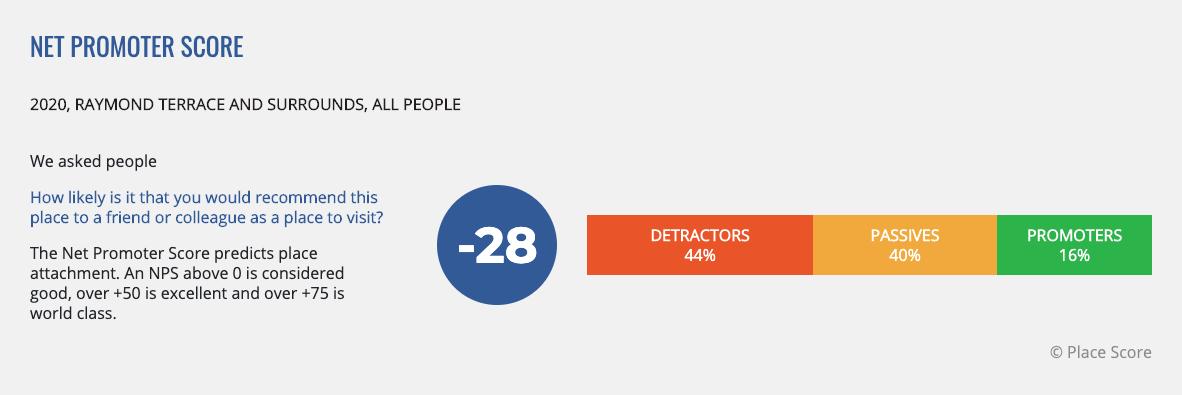
Area with the lowest liveability score2 Salt Ash and Surrounds (49/100)

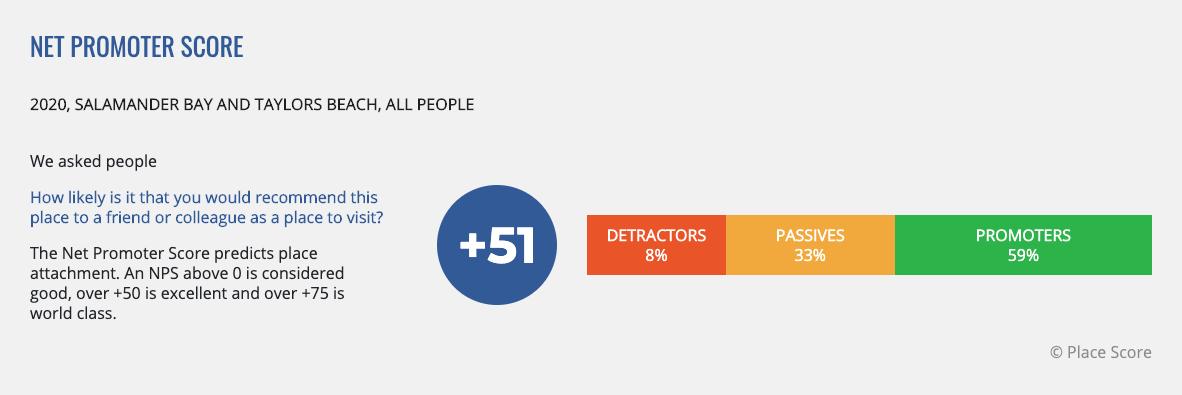
+33
Port Stephens’ worst performing attribute3 Local employment opportunities (within easy commute)
Interestingly, for people aged 15-44, the worst performing attribute is ‘Things to do in the evening’.
community members.
The Port Stephens community highly values the sense of personal safety, unique landscapes, views, natural features, and locally operated and owned businesses currently offered by their neighbourhoods. Ensure your actions either celebrate or, at the very least, do not negatively
There are currently two main barriers to a more liveable Port Stephens, accessibility and sustainability. The connection to nature offered by the area needs to be protected and maintained by both council and residents. The local centres and their cherished businesses need to be made accessible via active and public transport – think more and higher quality public spaces.
Place Score further analysed the data to provide priority levels across nine different themes, all of which can be found on your liveability platform:
Theme Protect High priority Medium priority
#1 Environmental Sustainability* 1 2 2
#2 Economy 3 0 1
#3 Management and Safety* 1 2 1
#4 Character* 1 1 1
#5 Movement 0 2 0
#6 Open Space 0 1 2
#7 Housing and Development 0 1 0
#8 Community (Connection) 0 0 1
#9 Social Facilities and Services 0 0 1
The following section summarises key insights from your Liveability Platform including:
• Port Stephens LGA top 15 Care Factors

• Neighbourhood Liveability
• Neighbourhood Liveability Breakdown
• LGA Strengths and Priorities
• Strengths And Priorities By Theme
• Open Space
• Economy
• Movement
• Housing and Development
• Social Facilities and Services
• Community Connection
• Community ideas for change


66 /100
‘ Elements of the natural environment (natural features, views, vegetation, topography, water, wildlife etc.)’ is Port Stephens #1 Care Factor
The best way to improve liveability across Port Stephens is to invest in
‘ Walking/jogging/bike paths that connect housing to communal amenity (shops, parks etc.)’.

Port Stephens’ neighbourhoods received an average liveability score of 66/100.
Fingal Bay received the highest liveability score (75/100).
Salt Ash and Surrounds received the lowest liveability score (49/100).

Movement, and more specifically active transport, is amongst the most common theme in the Port Stephens community ideas for change

The Port Stephens community ideal neighbourhood stands out from other places by its unique natural environment.
It features locally owned and operated businesses that provide the community with their daily needs.
It also offers shared community amenities, like the local shops within walking or cycling distance.
Finally, it has well maintained and managed public domain; footpaths, parks, roads and other public assets.
The Care Factor survey asks respondents to select what is most important to them in each of five Place Dimensions. The Place Dimensions and associated Place Attributes reveal what attracts and attaches people to a neighbourhood, as well as the barriers to entry or connection.
The LGA top 15 Care Factors are ranked based on how many people selected each attribute as being important to them in the 'ideal neighbourhood’. You can use this data to help define projects in the planning stages.

On average, Port Stephens’ neighbourhoods scored a 66/100, which is one point under Place Score’s National Benchmark Average of 67/100.
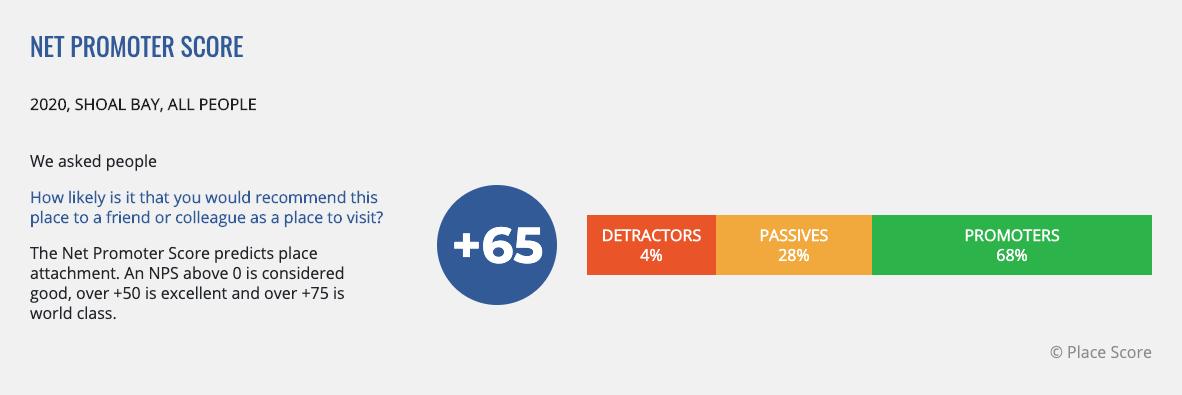
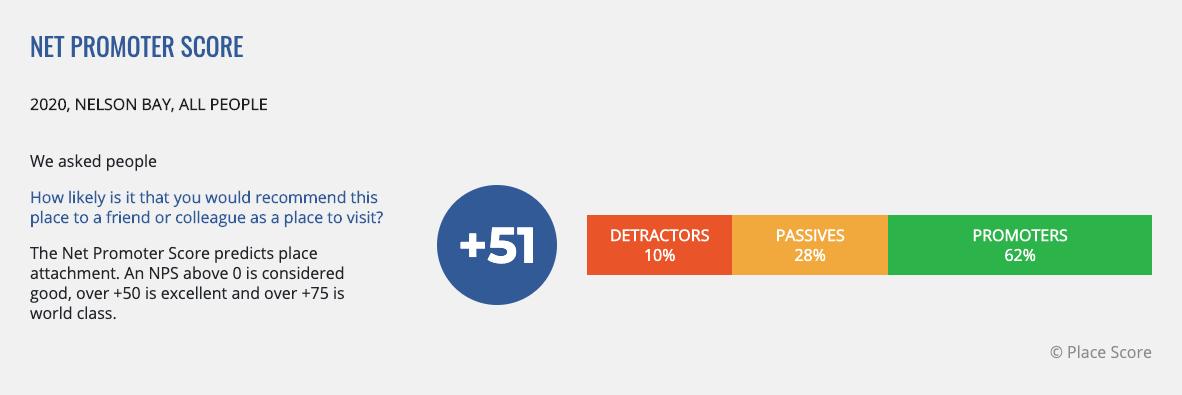
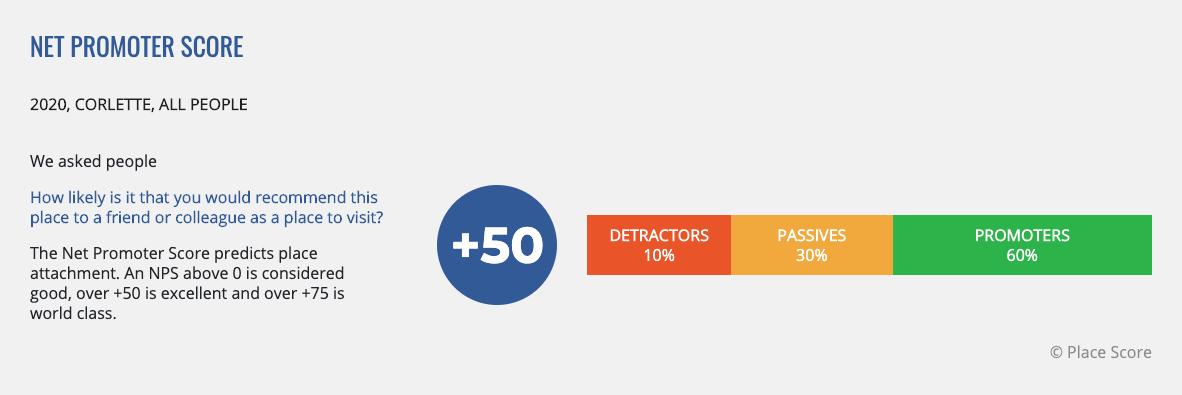
Overall, neighbourhoods located Peninsula received higher scores with Fingal Bay (75/100), Corlette and Shoal Bay (73/100) identified as the areas with the highest level of liveability.
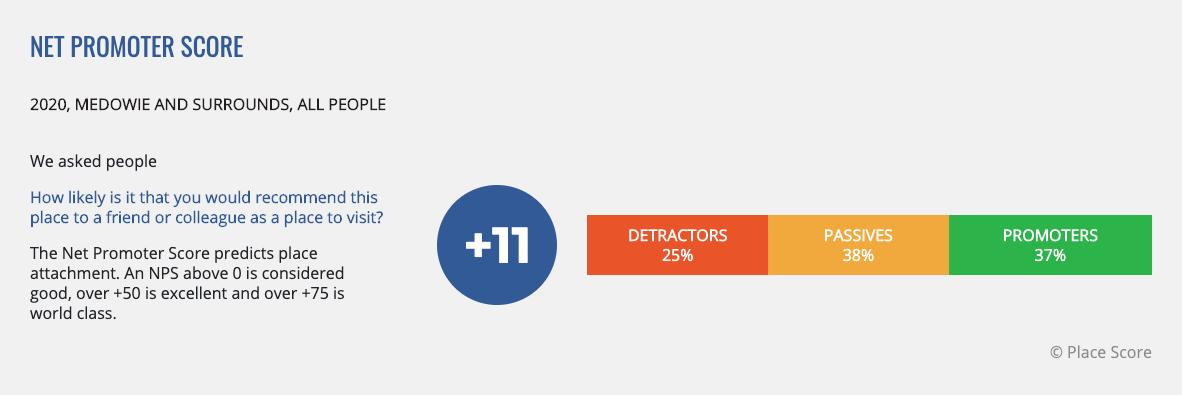
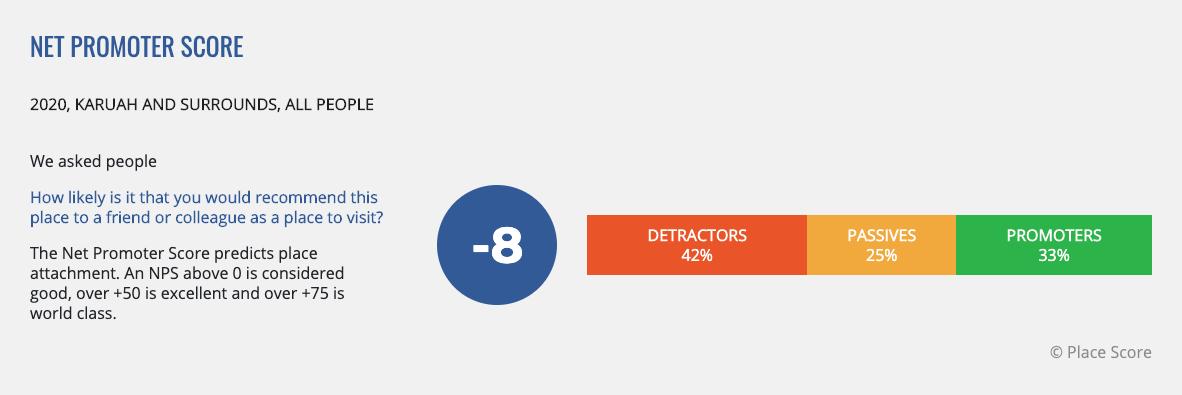
The western and more rural areas did not score as well, with Salt Ash and Surrounds (49/100), Karuah and Surrounds (52/100) and the Rural West (58/100) receiving the lowest PX Scores across the LGA.
impacting their 'lived place experience', resulting in a PX Score that captures neighbourhood liveability. We can compare how our community rated the liveability of their current neighbourhoods. We can use this data to identify areas performing better or worse that the LGA average.

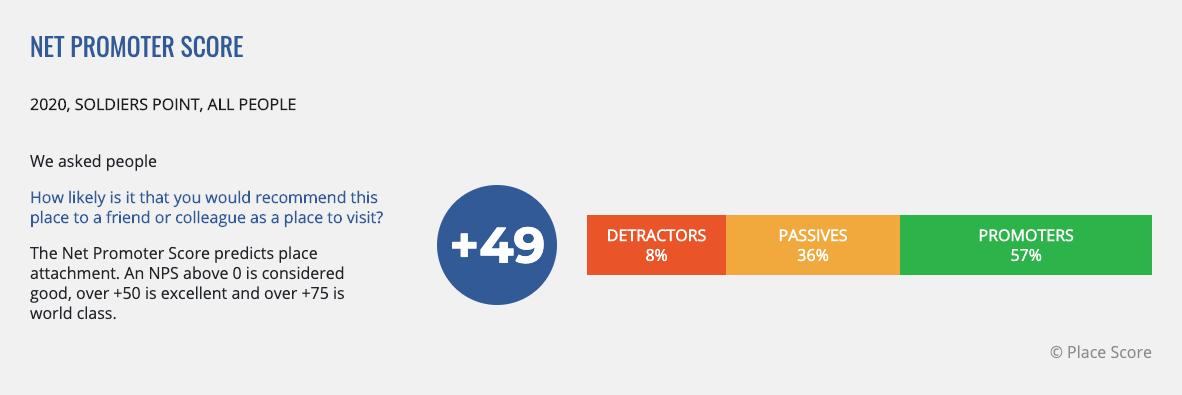
‘Ratepayers’ in Fingal Bay, Salamander Bay and Taylor’s Beach are saying they are experiencing the most liveable neighbourhoods (78/100).
In general, ratepayers rated their neighbourhood higher than residents, and significantly higher than workers (72, 66 and 61/100 respectively).
On average, women experience a lower level of neighbourhood liveability than men. This is most pronounced in Salamander Bay and Taylors Beach, and Raymond Terrace and Surrounds.
Respondents over 64 years old are the age group experiencing the highest level of liveability. Interestingly, this goes against trends observed by Place Score in other LGAs across Australia, where older residents tend to be more dissatisfied with their neighbourhoods.
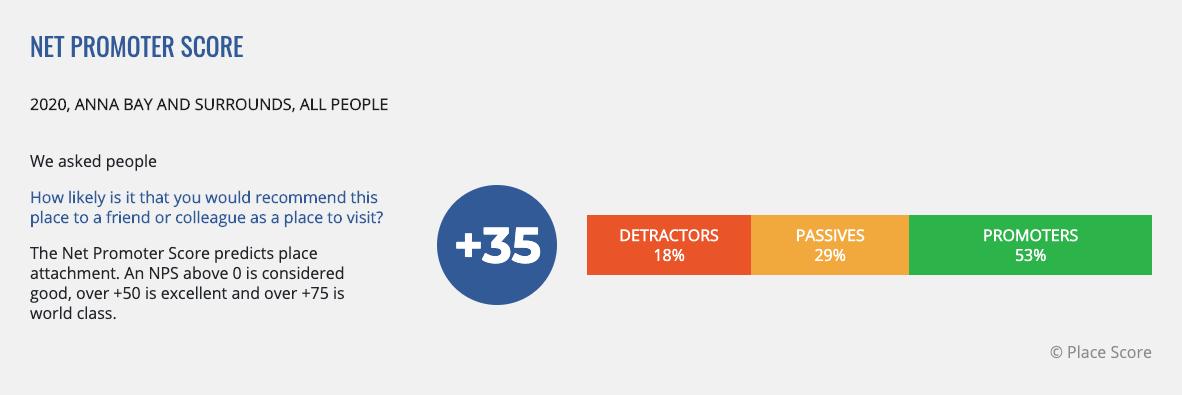
Conversely, respondents aged 25 - 44 have some of the lowest levels of neighbourhood liveability. The difference in scores is most significant in the coastal areas of Shoal Bay ( - 8%), Nelson Bay (- 7%) and Anna Bay and Surrounds ( - 8%).


The social characteristics of a neighbourhood , and how inviting it feels to a range of people regardless of age, income , gender, ethnicity or interests.
How well a neighbourhood is managed, maintained and improved. It considers care, pride, personal and financial investment in the area.
Activities, events and inviting spaces to spend time in a neighbourhood that might lead to a smile or a new friend.
Each neighbourhood’s PX Score is based on the performance of five Place Dimension s . Each of the dimension is comprised of ten difference place attributes. The following tables summarise the average score of each Place Dimension at the LGA level, as well as the best and worst performers. Anna Bay and surrounds PORT STEPHENS LGA
Physical, social, cultural or economic aspects of an area that make a neighbourhood interesting , special or unique.
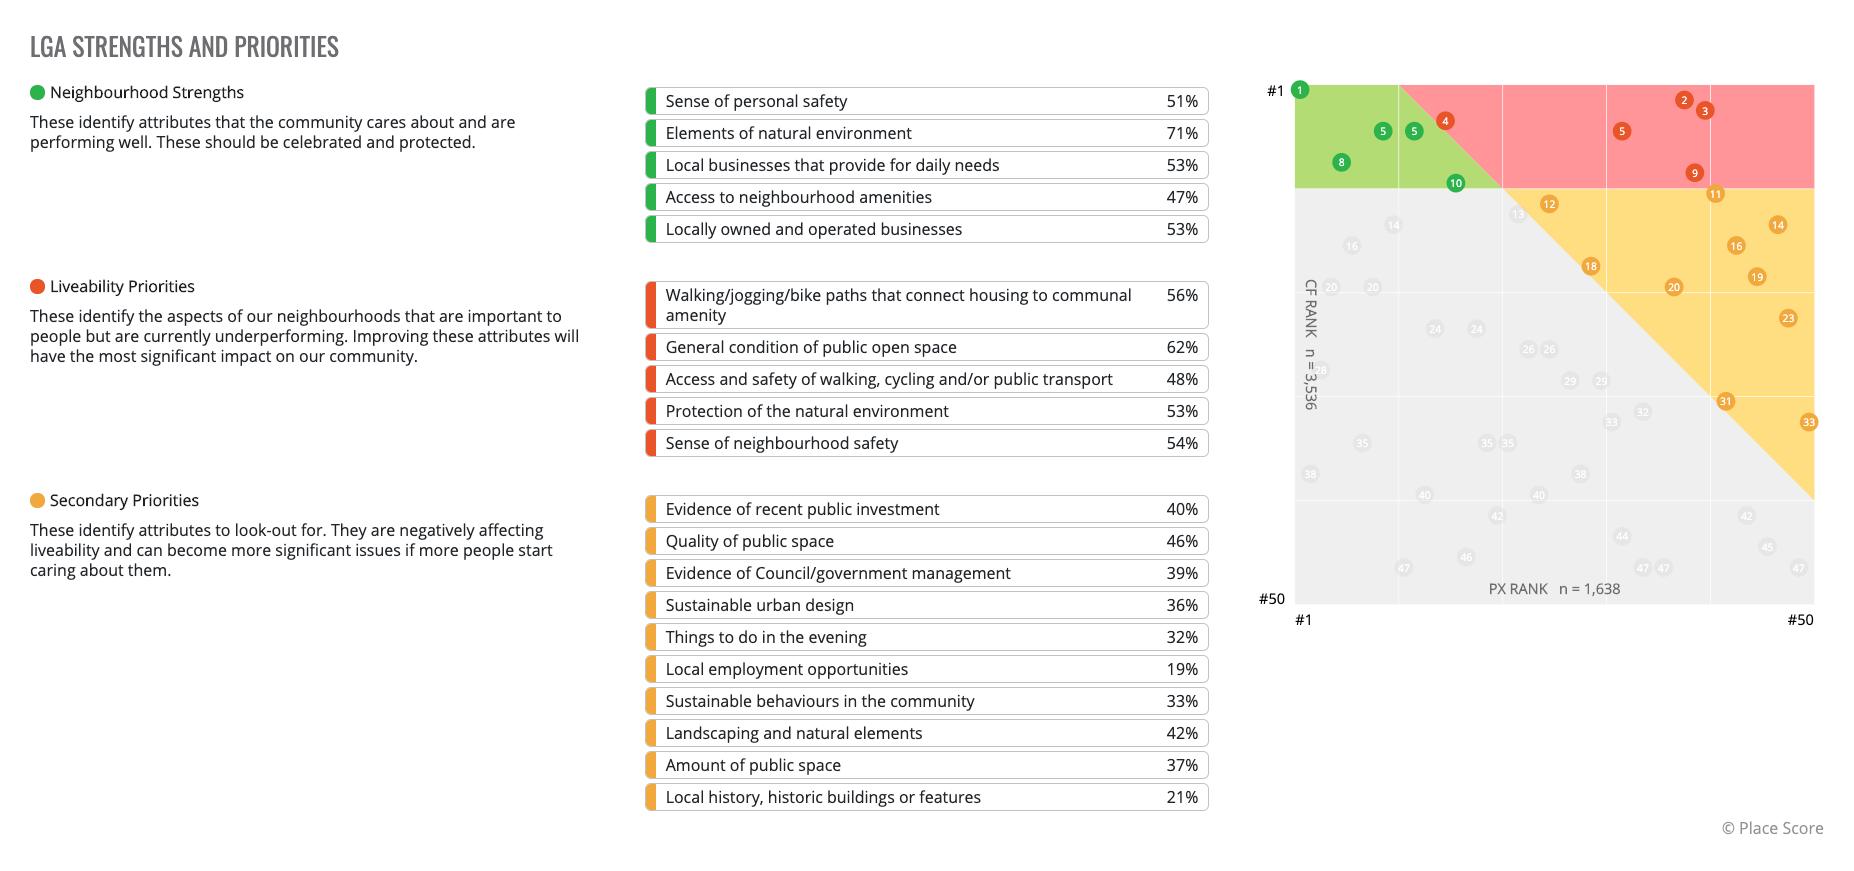
These identify attributes that the community cares about and are performing well. These should be celebrated and protected.
These identify the aspects of our neighbourhoods that are important to people but are currently underperforming. Improving these attributes will have the most significant impact on our community.
These identify attributes to look - out for. They are negatively affecting liveability and can become more significant issues if more people start caring about them.
The following section highlights what you should retain and protect as well as the level of investment needed to improve different aspects of liveability.
The core principle is that you should invest in improving attributes with a high Care Factor ranking and a low PX Score as, once improved, they will have the most significant impact on liveability.
The next pages include insights on:
• Open Space
• Economy
• Movement
• Housing and Development
• Social facilities and services
• Community Connection
Additional themes, location and demographicspecific priorities are available on your Liveability Platform.
This table identifies how to read the different level of priority presented in the following pages.
Protect These attributes currently contribute the most to the liveability of your neighbourhoods.
These attributes have a high Care Factor Ranking (valued by the most people in your community) and have a high PX Score (performing well)
Investment priority
High Investing in these attributes will contribute the most to improve the liveability of your neighbourhoods.
These attributes have a high Care Factor Ranking (valued by the most people in your community) and have low PX Score (NOT performing well)
Medium Investing in these attributes will contribute to improve the liveability of your neighbourhoods.
These attributes are generally in the top half of the Care Factor rankings and have a low PX Score (NOT performing well)
Low Investing in these attributes will slightly contribute to improve the liveability of your neighbourhoods.
These attributes are generally in the bottom half of the Care Factor Ranking (selected by the least number of people in your community) and have a low PX Score (NOT performing well)
No No additional investment is needed for these attributes as they are currently over-performing.
These attributes have a low Care Factor Ranking (selected by the least number people in your community) and have a high PX Score (performing well)
CF Rank /50 PX Score /10
Rank 1 - 15 ≥ 7
CF Rank /50 PX Score /10
Rank 1 - 15 <7
Rank 16 - 30 <7
Rank 31 - 50 <7
Rank 16 - 50 ≥ 7
Consider investing in the ‘ Quality of public spaces (footpaths, verges, parks etc.)’ in every precinct but Corlette and Fingal Bay.
Increasing the ‘ Amount of public space (footpaths, verges, parks etc.)’ would highly improve the liveability of Anna Bay and Surrounds, Karuah and Surrounds, Medowie and Surrounds and Shoal Bay.
Although the it is not identified as a high priority area, Raymond Terrace and Surrounds would benefit from investment in any open space attribute
Colours on map represent how a theme is performing in each location based on: Retain and protect (One or more protect attribute and no medium or high priority), No (all attributes for the location are a no), Low priority (No high or protect priority and one or less medium priority), Medium (One high or more than one medium priority), High (More than one high priority).

Local businesses and ownership, and neighbourhood amenities are highly valued and performing well it most precincts.
Investing in ‘ Things to do in the evening (bars, dining, cinema, live music etc.)’ is a medium investment priority overall but a high priority for those aged 15 - 44.
Local employment opportunities (within easy commute)’ is performing poorly across Port Stephens. However, its low Care Factor means it is only a medium investment in a few of the surveyed areas.

Colours on map represent how a theme is performing in each location based on: Retain and protect (One or more protect attribute and no medium or high priority), No (all attributes for the location are a no), Low priority (No high or protect priority and one or less medium priority), Medium (One high or more than one medium priority), High (More than one high priority).
There is no additional movement- related investment required in Corlette, Fingal Bay and Nelson Bay.
Every other surveyed area would benefit from investment in active and public transport infrastructure and connections between housing and communal amenities.
Ease of driving and parking ’ is overperforming in every area but Salt Ash and Surrounds and Shoal Bay, meaning there is potential to reduce the public domain allocated to cars in favour of other modal options or more places for people.

Colours on map represent how a theme is performing in each location based on: Retain and protect (One or more protect attribute and no medium or high priority), No (all attributes for the location are a no), Low priority (No high or protect priority and one or less medium priority), Medium (One high or more than one medium priority), High (More than one high priority).
Housing - related attributes are performing well overall. However, the range of housing types and sizes and prices and tenures could be improved in Karuah, Raymond Terrace, Salt Ash and surrounding areas.
Investing in ‘ Quality of buildings (design and construction of homes, shops, schools etc.)’ is a medium investment priority in Nelson Bay and Fern Bay and Surrounds.
Evidence of recent private investment (renovations, landscaping, painting etc.)’ is not highly valued but could be improved in most precincts.

Colours on map represent how a theme is performing in each location based on: Retain and protect (One or more protect attribute and no medium or high priority), No (all attributes for the location are a no), Low priority (No high or protect priority and one or less medium priority), Medium (One high or more than one medium priority), High (More than one high priority).
Access to shared community and commercial assets (library, bike/car share, sport facilities/gym etc.) ’ is a medium investment priority in multiple surveyed areas. It is also a high investment priority for women over 64 in Fern Bay and Fingal Bay.
Investing in ‘ Child services (child care, early learning, after school care, medical) is a high investment priority for women aged 25 - 44 in Karuah and Surrounds.

Local education options (from elementary to adult education) is a high investment priority for men aged 25 - 44 in Medowie and Surrounds.
Colours on map represent how a theme is performing in each location based on: Retain and protect (One or more protect attribute and no medium or high priority), No (all attributes for the location are a no), Low priority (No high or protect priority and one or less medium priority), Medium (One high or more than one medium priority), High (More than one high priority).
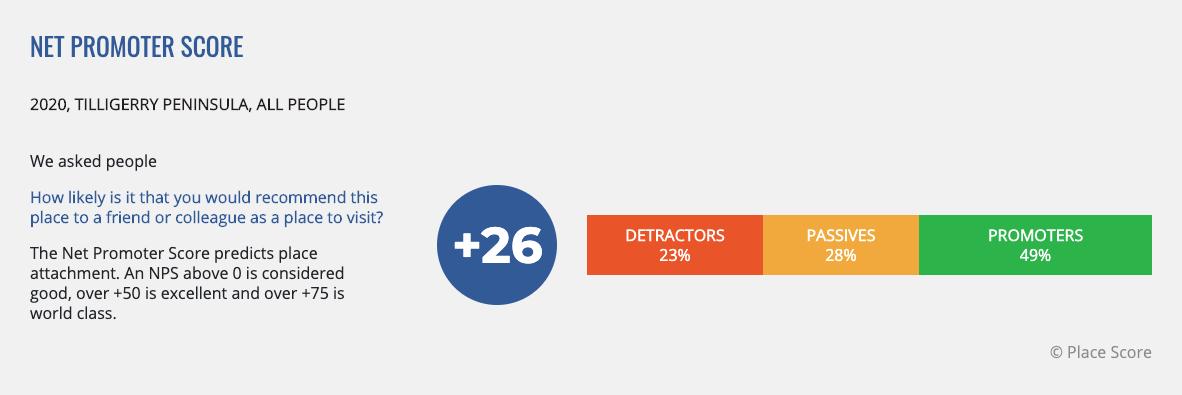
Investing is ‘ Evidence of community activity (volunteering, gardening, art, community - organised events etc.)’ is a high priority for the Rural West and a medium priority for the Tilligerry Peninsula, Shoal Bay, Salt Ash, Raymond Terrace, Karuah and their surrounding areas.
Salt Ash , Raymond Terrace and their surrounds would benefit the most from investment in community development.
Colours on map represent how a theme is performing in each location based on: Retain and protect (One or more protect attribute and no medium or high priority), No (all attributes for the location are a no), Low priority (No high or protect priority and one or less medium priority), Medium (One high or more than one medium priority), High (More than one high priority).

Most community ideas for change relate to improving movement, management and safety and open space.
The most common theme amongst community ideas was improving active transport and connectivity within Port Stephens. Preliminary review indicates that nearly 30% of ideas related to walkability compared to only 10% for private vehicle infrastructure.

The second most common theme was management and safety, with nearly 15% of ideas relating to maintenance and more than 10% relating to an increase in the sense of safety.
Most ideas within the open space theme related to improving green and leisure - oriented spaces.
“Care for our footpaths...mowing and cleaning gutters every 2 months in summer and 3 in winter. More trees and scrubs in the main street.” –
Female, 65+, Karuah and surrounds
“More bike paths that make it safe to move around the foreshore and natural environments - safe place to recreate away from cars.” –
Female, 45-64, Nelson Bay


Place Score asked the community: ‘ What's your big or small idea to improve your neighbourhood?’ and ‘What's missing in your neighbourhood that would make it better for you?’
answers were collected and classified under nine different themes. An idea can be classified in more than one theme (e.g. someone may share an idea that relates to movement and economy).
You can use this data to help define projects at the local level and for different groups in our neighbourhoods.
To learn more about how Place Score’s additional classification of community ideas for change services, get in touch with amulya@placescore.org