Opportunities and Consequences of KUSUM in Rajasthan
Dr.
Dr.
Dr.
December 2020
PRINCETON SCHOOL OF PUBLIC AND INTERNATIONAL AFFAIRS
ORKSHOP REPORT
UTHORS Elie Amkraut • Emily Chen • Rohit Gupta • Alex Hydrean • Meghana Mungikar Malini Nambiar • Tyler Patrick • Sujata Rajpurohit • Bryan Thomson • Ryan Warsing
A
W
FALL 2020 A
ADVISORS
Joe Lane
Eric Larson
Greig
Chris
PREFACE
This report is the final product of a 2020 Policy Workshop sponsored by the Princeton School of Public and International Affairs (SPIA) as part of its Master in Public Affairs degree program. It results from the work of eight MPA students and two PhD candidates under the supervision of Dr. Joe Lane, Dr. Eric Larson, and Dr. Chris Greig. A draft report was presented to Dr. Arvind Mayaram, Economic Advisor to Chief Minister, Government of Rajasthan, on 19 December 2020 via video conference.
All authors participated in discussions, debate, and preparation of this report. The report presented here does not reflect the views of Princeton University, any individual instructor, any individual student, or any person interviewed by this workshop.
ACKNOWLEDGEMENTS
The authors would like to thank the following individuals and organizations for their contributions:
Mr. MS Acharya Retired Dean, College of Horticulture and Forestry, Jhalawar
Mr. Parmanand Agarwal Director, Rural Technology Center, Jhalawar
Ms. Shalu Agarwal Programme Lead, Council on Energy, Environment, and Water
Mr. Kuldeep Arora Director, Indian Institute of Rural Development, Jhalawar
Mr. Ted Borer Energy Plant Director, Princeton University
Dr. Bryan Bruns Independent Consultant
Dr. Rohit Chandra Visiting Fellow, Centre for Policy Research
Dr. Ali Daraeepour Postdoctoral Research Associate, Princeton University
Dr. Neha Durga Researcher, International Water Management Institute
Mr. Mohinder Gulati Former Chief Operating Officer, Sustainable Energy for All (UN) and former Advisor (Energy), World Bank
Mr. Anil Gupta Managing Director, Rajasthan Renewable Energy Corporation, Ltd.
Mr. A K Gupta Managing Director, Jaipur Electricity Distribution Company
Mr. Himanshu Khurana Director (Technical), Rajasthan Electricity Regulatory Commission
Dr. Jesse Jenkins Assistant Professor, Princeton University
Ms. Ann Josey Senior Research Associate, Prayas Energy Group
Mr. Ashwin Gambhir Fellow, Prayas Energy Group
Dr. Avinash Kishore Research Fellow, International Food Policy Research Institute
Dr. Mahesh Patankar Senior Advisor and Consultant, Regulatory Assistance Project
Ms. Pratiti Priyadarshani Senior Programme Manager, Foundation for Ecological Security
Mr. Anas Rahman Programme Associate, Council on Energy, Environment, and Water
Dr. Jessica Seddon Global Lead, Air Quality, World Resources Institute
Mr. Shilp Verma Researcher, International Water Management Institute
Dr. Gautam Yadama Dean, Boston College School of Social Work Shakti Pumps, Ltd.
2
TABLE OF CONTENTS

3
I. EXECUTIVE SUMMARY ...................................................................................................................6 II. INTRODUCTION ............................................................................................................................. 12 PURPOSE OF THIS REPORT 12 KUSUM OVERVIEW ................................................................................................................................................. 12 KUSUM RATIONALE AND OBJECTIVES 13 OTHER STRATEGIC GOALS 16 CURRENT PROGRESS 16 ROADMAP OF REPORT .............................................................................................................................................. 17 III. CONTEXT .......................................................................................................................................... 18 FARMERS 18 WATER 19 DISCOMS ..................................................................................................................................................................... 21 POLITICAL ECONOMY 23 IV. ECONOMIC CASH FLOW ANALYSIS .......................................................................................... 24 KUSUM A.................................................................................................................................................................. 24 KUSUM C 29 SUMMARY COMPARISON: KUSUM A AND C 35 V. WATER IMPLICATIONS ................................................................................................................. 37 VI. ROLLOUT FEASIBILITY ................................................................................................................ 40 SUPPLY OF CAPITAL 40 SUPPLY OF PV HARDWARE ...................................................................................................................................... 41 SUPPLY OF PV SUPPORT SERVICES 44 WASTE MANAGEMENT 46 VII. SECONDARY EFFECTS............................................................................................................ 47 EMPLOYMENT............................................................................................................................................................ 47 EQUITY 48 VIII. CONCLUSIONS AND RECOMMENDATIONS.................................................................... 51 IX. APPENDICES..................................................................................................................................... 55 APPENDIX A: PV SIZING 55 APPENDIX B: DISCOUNTED CASH FLOW ANALYSIS METHODOLOGY 59 APPENDIX C: SENSITIVITIES AND PRIMARY UNCERTAINTIES FOR RENEWABLE POWER GENERATORS .................... 67 APPENDIX D: PREVIOUS SOLARIZATION PROGRAMS, THEIR SUCCESSES AND CHALLENGES...................................... 70 APPENDIX E: LEGAL REGIME GOVERNING GROUNDWATER IN RAJASTHAN 73 APPENDIX F: PREVIOUS DISTRIBUTION SECTOR REFORM EFFORTS 74 X. ENDNOTES ....................................................................................................................................... 75
LIST OF TABLES
LIST OF FIGURES
4
Table 1: Discounted Cash Flow Analysis Results normalized to 1 MW solar PV capacity 27 Table 2: Discounted Cash Flow Analysis Results for Discom Savings under KUSUM A Pilot.........27 Table 3: Discounted Cash Flow Analysis Results for Farmers and Developers 31 Table 4: Discounted Cash Flow Analysis Results for Discom Savings under KUSUM C Pilot .........33 Table 5: Discounted Cash Flow Analysis Results for GoR Savings under KUSUM C Pumps Pilot .34 Table 6: Solar Plant Job and Employment Creation 47 Table 7: Capacity Utilization Factors Across Jaipur, Jodhpur, and Ajmer Discoms............................56 Table 8: Summary Table of KUSUM A Tenders 59 Table 9: KUSUM C Agricultural Load and Cost by Discom................................................................60 Table 10: Summary of Primary Analysis Results .....................................................................................65 Table 11: Analysis for KUSUM A – Less Grid Electricity Displaced 65 Table 12: Analysis for KUSUM C – Solar Pumps, Savings from Excess Solar Generation Sold .......65 Table 13: GoR Costs and Savings for KUSUM C – Solar Pumps 66 Table 14: Government Schemes to Improve Distribution Network.....................................................74
Figure 1: Cereal Production in Rajasthan and India................................................................................18 Figure 2: Status of Groundwater Blocks in Rajasthan 20 Figure 3: Rajasthan Distributed Sector Costs, Revenue Gap, and Losses.............................................22 Figure 4: PV Generated and Purchased Under KUSUM A. ..................................................................25 Figure 5: Feeeder Size per Substation Across Discoms. 26 Figure 6: KUSUM C Net Metering Scenarios With a 5 HP Pump in Jaipur Discom..........................30 Figure 7: Total Cumulative Investment Capital Mobilized Over Time, KUSUM A 40 Figure 8: Cumulative Potential Domestic Solar Cell Installed in India 43 Figure 9: Potential Cumulative Installed KUSUM Capacity in Rajasthan.............................................44 Figure 10: PV Generated and Purchased Under KUSUM A across all Discoms 57 Figure 11: KUSUM C Net Metering Scenarios With a 5 HP Pump in Jaipur Discom.......................58 Figure 12: Potential Change in NPV of 1 MW PV Feeder under KUSUM A .....................................67 Figure 13: Required Tariff Feeder for Given Cost of PV Modules (NPV = 0) ...................................68 Figure 14: Potential Change in NPV of 1 MW PV Net Metered Pumps for Given Uncertainties.....69
GLOSSARY
ACS AVERAGE COST OF SUPPLY
AMC ANNUAL MAINTENANCE AGREEMENT
ARR AVERAGE REVENUE REALIZED
BJP BHARATIYA JANATA PARTY
CAPEX CAPITAL COST
CFA CENTRAL FINANCIAL ASSISTANCE
CUF CAPACITY UTILIZATION FACTOR
DCR DOMESTIC CONTENT REQUIREMENT
DISCOM DISTRIBUTION COMPANY
EPC ENGINEERING, PROCUREMENT, CONSTRUCTION
FIT FEED-IN TARIFF
GOI GOVERNMENT OF INDIA
GOR GOVERNMENT OF RAJASTHAN
GSDP GROSS STATE DOMESTIC PRODUCT
GW GIGAWATT
HP HORSEPOWER
KUSUM KISAN URJA SURAKSHA EVEM UTTHAN MAHABHIYAN
KW-H KILOWATT-HOUR
MKABSY MUKHYAMANTRI KISAN AAY BODHOTRI SOLAR YOJANA
MNRE MINISTRY OF RENEWABLE ENERGY
MW MEGAWATT
NPV NET PRESENT VALUE
PBI PERFORMANCE BASED INCENTIVE
PPA POWER PURCHASE AGREEMENT
PV PHOTOVOLTAIC
RERC RAJASTHAN ELECTRICITY REGULATORY COMMISSION
RESCO RENEWABLE ENERGY SERVICE COMPANY
RRECL RAJASTHAN RENEWABLE ENERGY CORPORATION LTD.
RPG RENEWABLE POWER GENERATOR
RPO RENEWABLE PURCHASE OBLIGATION
SNA STATE NODAL AGENCY
T&D TRANSMISSION AND DISTRIBUTION
UDAY UJWAL ASSURANCE YOJANA
WUA WATER USER ASSOCIATION
5
I. EXECUTIVE SUMMARY
Long after the dire health and economic crises associated with the current Covid-19 Pandemic have been overcome, the State of Rajasthan will continue to battle enduring challenges of poverty, poor electricity supply, and water scarcity. These challenges are especially strong for rural populations, and may intensify with global climate change.
Well-intentioned initiatives have sought to confront these challenges, most recently the Government of India’s Kisan Urja Suraksha evem Utthan Mahabhiyan (KUSUM) scheme. Launched 8 March 2019, KUSUM is an ambitious attempt to encourage the solarization of agricultural electricity supply, so as to improve electricity supply to farmers, increase farmer income, relieve state and Discom financial burdens, and better manage groundwater resources.

This report provides an independent assessment of the relative costs and benefits of both solar feeders and grid-connected solar pumps, two agricultural solarization models that KUSUM offers to communities connected to the power grid. Specifically, this report assesses the ability of each model to achieve the desired goals of stakeholders in Rajasthan, offering recommendations to increase benefits, reduce implementation barriers, and mitigate unintended consequences.
This report concludes that although KUSUM has great potential to deliver these benefits, particularly through the use of solar feeders, neither model neither model appears likely to be able to fully deliver on all of these benefits Critically, neither is sure to improve Rajasthan’s groundwater depletion problem. Despite these caveats, Rajasthan is well-positioned to meet solarization targets and is generally encouraged to embrace the KUSUM scheme, making changes where needed to ensure financial viability, prioritize equity, and minimize harmful side-effects on the social and physical environment.
CONTEXT
Through solarization of groundwater pumps and substation-level feeder power plants, KUSUM aims to give farmers ample, reliable electricity for irrigation. The scheme has two grid-connected models:
• KUSUM A: Installation of 10,000 MW of decentralized, ground-mounted, grid-connected solar power plants with individual plant sizes up to 2 MW
• KUSUM C: Solarization of 15 lakh grid-connected agriculture pumps, originally intended to connect each individual pump to its own power supply. Recently, KUSUM guidelines have been changed to allow this target to be met by connecting multiple pumps to a single power supply, i.e., by creating solar feeders.
KUSUM has many potential virtues. Solar electricity can be generated at low cost and supplying farmers through exclusive channels enables them to more efficiently irrigate their crops, boosting their
6
productivity and, thus, their income. Net-metered solar pumps also allow farmers to sell surplus power to the grid a potentially sizable source of secondary income.
Farmers who generate their own low-cost power lessen the need for agricultural electricity subsidies a driver of high Discom debts and regular state bailouts of the distribution sector. KUSUM intends to help close Discoms’ revenue gaps, helping them on the path to long-term financial health.
Lastly, the grid-connected solar pump model intends to help conserve groundwater, or at least to do no harm. With farmers receiving electricity for free, or nearly so, there is little incentive to prevent them from aggressively pumping, threatening sensitive water supplies. Rather than costs, solar pumps offer revenue to farmers who economize their power use, and as such, their groundwater pumping.
The state of Rajasthan has been an eager first adopter of the KUSUM scheme. Rajasthan was the first state to tender KUSUM A feeders and quickly surpassed targets set by the central government State government interest in the rollout of grid-connected solar pumps has also been robust, with the state gathering farmers’ consent for participation and subsequently tendering over 60,000 horsepower of solar pumps (roughly 90 MW). This report also notes that:
• Rajasthan is an especially dry and sunny state ideal conditions for solar PV.
• Rajasthan is highly dependent on farming. 75 percent of its citizens live in rural areas, and over 60 percent earn income from agriculture.1 Agriculture accounts for 30 percent of the state’s total GDP.2 Improving farmers’ electricity access and raising their incomes are therefore major concerns
• Rajasthan’s Discoms are highly indebted. The distribution sector’s debts essentially tripled from 2010-2015, eliciting state bailouts. Today, 75 percent of Rajasthan’s energy budget goes toward Discom subsidies.3 KUSUM’s potential to reduce this strain is, thus, very appealing.
• Rajasthan’s water table is critically threatened. Agriculture consumes about 86 percent of water resources, and over-pumping has led to water scarcity.4 Rajasthan’s annual groundwater extraction is 140 percent its annual recharge.5
REPORT METHODOLOGY
This report evaluates (1) the core rationale for solar feeders and grid-connected pumps, and how that rationale is reflected in the scheme’s current design, (2) barriers to the scheme’s future rollout, and (3) the scheme’s potential co-benefits and negative consequences.
The research team organized along these lines and applied a variety of analytical frameworks to assess KUSUM from the ground-up, using Rajasthan as the venue of observation. The team used standard discounted cashflow analyses to compare KUSUM’s possible benefits for farmers, developers, and Discoms in order to judge whether current tariffs and financial incentives motivate participation in

7
the scheme. Rollout was assumed to hinge mostly on the indigenous capacity of key industrial supply chains, given the central government’s requirement that all KUSUM components be domestically manufactured. A supply chain analysis was thus used to locate weak links that might prevent Rajasthan from meeting its solarization goals.

Data from these analyses was largely publicly available using government resources. Throughout the project, the research team consulted Indian stakeholders via video-conference, including the Rajasthan Renewable Energy Corporation; NGOs, such as Prayas Energy Group and the World Bank (whose scholarship and differences of opinion informed much of this project’s scope); and solar experts from both India and the Princeton University campus. Stakeholders’ willingness to engage the research team in spite of difficulties imposed by the ongoing Covid-19 Pandemic attests to the profound interest in agricultural solarization, the KUSUM scheme, and its potential ramifications in Rajasthan.
ANALYTICAL FINDINGS
Despite KUSUM’s anticipated benefits and the success of initial pilots, progress in Rajasthan has stalled. Solar feeders have yet to be implemented in ways that markedly increase farmer income or conserve groundwater, and risk-averse banks are not lending sufficient capital to developers. Solar pumps, meanwhile, have not caught on with farmers hesitant to self-finance participation costs, even when subsidized. The research team’s analyses have identified shortcomings in KUSUM’s design that limit the scheme from delivering on the full spectrum of possible benefits:
• Solar feeders are more likely to attract private capital than solarized pumps. As it stands, our analysis suggests that only the solar feeders’ tariff structure will sufficiently incentivize private developer investment.
• Solar feeders have greater potential to raise farmer income than solar pumps. Analysis finds that current solar pump feed-in-tariffs are too low to benefit farmers selling power back to the grid. Unless tariffs or subsidies for solar pumps are increased, solar feeders can offer farmers greater income through land leases to feeder developers.
• Anticipated Discom savings are similar with solar feeders and pumps, but the benefits of deploying solar pumps are more uncertain. Cashflow analyses in this report reveal that with solar pumps, Discoms’ savings erode as farmers sell more electricity to the grid. Further, tariffs cannot be raised to benefit farmers, or to incentivize decreased groundwater pumping, without reducing Discom savings.
• Solar pumps are slightly likelier to reduce state subsidies than solar feeders. Accounting for initial capital subsidies, solar pumps will likely yield modest net savings for the Government of Rajasthan over 25 years, compared to solar feeders, where relief hinges on tariff correction (and, thus, is more uncertain).
8
• Both solar feeders and pumps pose unknown threats to groundwater. Low feed-in-tariffs mean farmers may prefer to sell excess water rather than surplus electricity when using solar pumps, which would therefore fail to prevent water overextraction. Solar feeders have no price signal in KUSUM guidelines, although they do offer flexibility to implement concurrent water conservation policies.
Regardless of any advantages one solarization model might have over another, the KUSUM scheme may need to come to terms with some implementation realities:
• Domestic content requirements are unlikely to constrain Rajasthan from meeting its solar targets. Even in conservative scenarios, Rajasthan’s share of India’s likely PV industrial supply should be sufficient to meet its distributed power target of 4 gigawatts (GW) by 2025. However, current domestic content requirements for solar cell components may impede the meeting of national solar targets.

• Financial and technical capacity limitations inhibit farmers from becoming renewable power generators. Although KUSUM guidelines indicate a preference that solar feeders be developed and operated by farmers and farmer cooperatives, farmers generally lack financial and technical capabilities to do so Beyond leasing land to feeder developers, farmers who do not own feeders cannot earn secondary income from feeder-level generation.
• KUSUM will leave Rajasthan a substantial waste problem. Solar PV produces substantial waste in the form of spent modules. India has no disposal strategy for module waste that will be generated by KUSUM.
Long-term management of the KUSUM scheme must also account for unintended consequences:
• Both solar feeders and solar pumps might exacerbate equity issues. Grid-connected and land-holding farmers, the likeliest beneficiaries of KUSUM, are commonly wealthier and come from higher castes Unequal access to the scheme might deepen social cleavages, particularly if water resources are not appropriately managed.
• KUSUM may seriously alter Rajasthan’s energy politics. Parties vying for farmers’ vote bank have historically used subsidies as bargaining chips. By proposing to reduce or eliminate these, KUSUM disposes of this source of leverage and becomes itself a political rallying point. How parties come to organize around KUSUM is yet unknown, and its effect on groundwater resources could create new political currents more difficult to navigate
RECOMMENDATIONS
In order to deliver the KUSUM scheme’s full suite of benefits for stakeholders in Rajasthan, including farmers, Discoms, and the state government, this report advises the following:
9
• Explore legal, regulatory, and policy mechanisms that would position solarization to incentivize groundwater conservation. Rajasthan should explore direct benefit transfers to reward farmers who conserve water, especially in areas served by feeders. Other co-measures should include accessible training in crop selection and communal water management Alternatively, legal reforms might be pursued to impose costs on the overuse of groundwater, or costs and benefits might be imposed simultaneously.
• Raise the upper limit on solar feeder installation capacity. The current 2 MW maximum does not allow solar feeders to meet the full agricultural demand in most cases. Based on the distribution of connected agricultural demand in Rajasthan, only 60 percent of the loads served by a substation are below 2 MW based on Rajasthan’s sizing criteria. Increasing the upper limit could enable Rajasthan and Discoms to maximize cost savings from the scheme, by supplying a greater share of agricultural load with lower cost power.
• Focus implementation on solar feeders, which seem to offer more benefits for farmers and developers; less risk for Discoms and GoR. Rajasthan could also explore higher state subsidies to make solar pumps viable for both farmers and Discoms Analysis in this report suggests the solar pump model will not be viable for farmers unless the tariff is increased to ₹9.91/kWh, which is higher than Discoms’ already unsustainable average cost of supply. While a higher feed-in tariff may raise farmer incomes and mitigate water risk by increasing benefits for conservation, Discoms would lose money on the scheme. However, given the dire status of groundwater exploitation, Rajasthan might consider whether subsidies to cover this higher feed-in tariff are a sacrifice worth making
• Develop an initial, small-scale rollout of the KUSUM scheme to mitigate water-related risks and collect empirical data on the scheme’s effects on groundwater extraction. It is unclear how electricity offered by solar feeders and solar pumps will change farmers’ water usage. To avoid possibly dire consequences of further groundwater depletion, KUSUM should be scaled as methodically as the need for rapid solarization will allow, and policies like drought premiums should be explored to control irrigation at sensitive times. If able, Rajasthan should track groundwater extraction with direct pumping measurements where the scheme is being implemented. This small-scale rollout can also be used to track other key uncertainties such as impacts on farmer incomes and Discom finances.
• Implement KUSUM in ways that affirm the inclusion of marginalized groups. KUSUM does not, as designed, include specific provisions to ensure small and marginalized farmers including those with pumps outside the sizing guidelines, or no pumps at all can access its benefits To ensure all farmers share in the opportunities afforded by this ostensibly universal scheme, feeders in population centers with high proportions of marginalized groups should be prioritized going forward, and educational barriers to entry reduced
10
GENERAL CONCLUSIONS

The KUSUM scheme has enormous potential to deliver benefits to Rajasthan. At present, however, the scheme design does not deliver benefits to the fullest extent possible. While both solar feeders and solar pumps can connect farmers with reliable electricity, this analysis indicates that solar feeders are more viable than solar pumps from a benefit-cost standpoint, and thus have greater potential to raise farmer incomes and welfare writ large. As now regulated under KUSUM, solar pumps are not viable financially, and thus fail to deliver desired benefits. Discoms do benefit from both solarization models, but benefits from solar feeders appear more reliable. Critically, neither model’s effects on groundwater are well-understood and rollout should thus proceed with caution.
Implementation will pose a challenge for Rajasthan, but not an insurmountable one industrial supply and support services are generally available. Of greater concern are the unintended consequences that rollout might elicit, including political and equity outcomes and other potential negative externalities, such as waste accumulation, political disputes, and the worsening of socioeconomic divides. Policies should tackle these problems and others more fundamental to the KUSUM scheme; namely, that solar feeders lack mechanisms to conserve electricity and water, and that guidelines for solar pumps are not well-calibrated to do the same. Focusing on obstacles and opportunities identified in this report should reinforce KUSUM, amplifying its beneficial effects on national development and climate change, and ameliorating its potentially negative impacts
11
II. INTRODUCTION
PURPOSE OF THIS REPORT
This report assesses the prospects of various models of solarizing agricultural electricity in the state of Rajasthan a state that embodies India’s national solar mission but is challenged by problems that solarization might help to solve.
The Kisan Urja Suraksha evem Utthan Mahabhiyan (KUSUM) scheme seeks to offer choice between several competing models of solarization, providing regulatory and developmental support for both substation-level solar feeders and individual solar pumps. Both models have emerged from pilots having impressed both the government and prominent NGOs, and today both are being rolled out on a national level. It is currently unclear which model provides greater benefits and, as such, deserves greater investment.
Having facilitated a successful feeder pilot in Maharashtra state, Prayas Energy Group concludes that feeders are “an excellent alternate supply option,” and in subsequent reports has endorsed feeders for their scalability and financial viability relative to solar pumps.6 7 Meanwhile, researchers from the World Bank suggest that farmers who self-generate electricity could gain a valuable secondary income stream with grid-connected solar pumps, as farmers who generate surplus electricity can then sell it to distribution companies (Discoms). Hence, this mechanism encourages farmers to economize their power use and, thus, their groundwater pumping.8 When farmers are strictly consumers of free or lowcost electricity supplied by solar feeders, pump proponents would argue there is no incentive to conserve.
These reports from Prayas and the World Bank are by no means alone in vouching for one model of KUSUM over its alternatives they are merely representative of the prevailing arguments being made. This report provides an independent assessment of the relative costs and benefits of both solar feeders and grid-connected solar pumps. Specifically, this report assesses the ability of each model to achieve the desired goals of stakeholders in Rajasthan, offering recommendations to increase benefits, reduce implementation barriers, and mitigate unintended consequences.
KUSUM OVERVIEW
Launched 8 March 2019, KUSUM seeks to increase farmer and Discom welfare and conserve groundwater resources. The scheme supports installation of solar photovoltaics (PV) in agricultural areas. Its specific goals are to (1) minimize transmission and distribution (T&D) losses, (2) raise farmer income by enabling them to lease land for solar installations and/or sell solar power to Discoms, and (3) reduce agricultural subsidies. The national scheme has three components:9
12
• KUSUM A: Installation of 10,000 megawatts (MW) of decentralized, ground-mounted, gridconnected solar power plants with individual plant sizes up to 2 MW
o In Rajasthan, the electricity ceiling tariff has been set at ₹3.14/kWh.10 However, lower costs can be achieved through a competitive bidding process.
o The Central government provides Discoms with a performance-based incentive (PBI) equal to ₹0.40/kWh/year or ₹6.6 lakh/MW/year of capacity installed (whichever is less) for five years from the Commercial Operation Date. For GoI to disburse the PBI to the Discoms, solar feeders must be operational such that actual generation can be metered and reported to GoI as an indicator of system performance.
• KUSUM B: Installation of 20 lakh standalone (off-grid) solar agriculture pumps
o For solar pumps with capacities lower than 7.5 HP, Central Financial Assistance (CFA) subsidizes 30 percent of the capital cost, states subsidize 30 percent, and farmers fund the balance with 10 percent due upfront
• KUSUM C: Solarization of 15 lakh grid-connected agriculture pumps, which may be solarized at the pump-level or the feeder-level
o For pump-level solarization, for pumps with capacities under 7.5 HP, CFA subsidizes 30 percent of the solar cost, states subsidize 30 percent, and farmers pay the balance with 10 percent due upfront In Rajasthan, farmers can sell solar electricity at a fixed tariff of ₹3.44/kWh11
o For feeder-level solarization under KUSUM C, CFA subsidizes 30 percent of the solar cost. This option has two implementation models: the Capital Expenditure (CAPEX) model and the Renewable Energy Service Company (RESCO) model. With CAPEX, the Discom directly develops the solar feeder using an Engineering Procurement and Construction (EPC) contractor. With RESCO, a private developer would develop the solar feeder, and the Discom would purchase solar generation through a 25-year PPA. In Rajasthan, the ceiling tariff for the feeder-level KUSUM C has yet to be determined as of December 2020.
In this report, all references to “KUSUM” refer hereafter to components A and C, and all references to “solar pumps” refer hereafter only to grid-connected solar pumps. KUSUM B pumps are out-of-scope for this report due to their inherent lack of grid-connectivity.
KUSUM RATIONALE AND OBJECTIVES
KUSUM seeks to provide farmers with distributed, grid-connected solar electricity. The logic behind these strategies is as follows:
13
• Solarization. Solar electricity is low-cost and plentiful in the daytime when farming is done.
• Distribution. Unlike centralized schemes, wherein electricity is transmitted to end-users from large, often faraway generation facilities, KUSUM offers distributed generation much closer to communities where it is consumed. Doing so minimizes transmission and distribution losses, lowers prices, and improves reliability. Distributed generation does, however, complicate grid management and administration of many spread-out assets.
• Grid-connectivity. Decades of electrification initiatives have connected most Indian villages to the electricity grid in some form, rendering standalone (off-grid) pumps less attractive than options which allow self-generating customers to sell surplus power to the grid.12
• Clustering. To draw on economies of scale and reduce transaction costs, electricity generation can occur in “clusters,” where appropriate.
KUSUM has several higher-level objectives beyond its explicit numerical targets:
Goal 1: Improve Electricity Supply to Farmers
KUSUM seeks to improve electricity access and, consequently, farm productivity. Discoms prioritize paying customers over agricultural users, whose connections are often unmetered and who often do not pay tariffs. The result, inevitably, is poor agricultural supply.13 KUSUM seeks to address availability and reliability issues by providing farmers with exclusive, distributed solar electricity, allowing for better irrigation of crops and, thus, greater productivity. Many farmers pump at all possible hours and would likely pump more if they could.14 Greater electricity allows greater pumping, directing more water to underirrigated crops and higher-value crops that are more water-intensive.
KUSUM seeks to provide electricity during daytime hours. Scarce access to daytime electricity forces farmers to irrigate during off-peak, nighttime hours. Many farmers use auto-switches to automatically run pumps whenever electricity is available.15 Increasing the dependability of daytime electricity is intended to incentivize more attentive, efficient pumping, which could increase production per water used. Additionally, farmers who irrigate at night risk run-ins with snakes and other nocturnal hazards. Nighttime electric shock incidents are also common; electrocutions in rural India have increased 5-6 percent annually over the past few decades.16
Goal 2: Raise Farmer Income
Solar feeders give farmers opportunities to generate income through leases. Although MNRE prefers that farmers themselves develop and operate solar feeders under KUSUM A, putting barren and uncultivatable land to income-generating use, farmers can also increase their income by leasing land to private developers.17 Unlike income made selling electricity to the grid, which entails some variability due to weather, generation plant performance, theft, and other risks, leasing income is fixed, or nearly so. 18 By leasing land for solar feeders, farmers lock in stable incomes over many years.19 Leases for
14
Delhi’s recent Mukhyamantri Kisan Aay Bodhotri Solar Yojana (MKABSY) scheme, for instance, paid ₹8,333/acre/month for the first year, increasing at 6 percent per annum for each year thereafter.20
Solar pumps give farmers the chance to grow their income by selling electricity to the grid. A scheme in Dhundi, which set a feed-in-tariff (FiT) of ₹7.13/kWh to farmers for electricity sold to the grid, returned ₹3.71 lakh in net cash income for the six-member cooperative of participating farmers.21
Goal 3: Relieve State and Discom Burdens
KUSUM seeks to relieve Discom debts. Chronic revenue shortfalls have led to enormous Discom debt in many states Moreover, states are supposed to reimburse Discoms for agriculture subsidies, but regularly fail to do so on time. As such, Discom debts have in many places swelled to unsustainable levels. Absent revenue and subsidy reimbursements, many Discoms have resorted to taking highinterest, short-term loans to cover operating expenses and power procurement. Subsidies have been difficult to change or repeal, given the influence of farmers’ vote bank on state and central governments.
KUSUM seeks to help reduce Discoms’ power purchase costs and, by virtue of distributed electricity generation, reduce transmission and distribution losses as well. Beyond lowering Discoms’ direct costs and average cost of supply (ACS), KUSUM could help decrease revenue gaps and the amount of cross subsidy necessitated by agricultural electricity tariffs set by State Electricity Regulatory Commissions. Doing so would create positive feedback and improve Discoms’ financial viability, allowing them to set cost-competitive tariffs and reduce industrial customers’ migration to captive power.
KUSUM seeks to help stop the bailout spiral. Because Discoms’ loans come from public banks, their health is of significant public concern. States have bailed out the distribution sector on numerous occasions. Each time, participating states22 have assumed substantial portions of Discoms’ outstanding debt. This unsustainable cycle will likely continue without serious structural reform.
Goal 4: Alleviate Stress on Groundwater Resources
Solarization of agricultural electricity might reduce groundwater use as farmers shift from night to daytime irrigation. For safety reasons, farmers prefer not to venture into fields at night, and thus often utilize ‘auto switches’ that run pumps whenever electricity is available. Reliable, daytime power reduces the need for auto switches and, thus might discourage overextraction of groundwater.
Solar pumps might reduce groundwater extraction by compensating farmers who sell solargenerated electricity to the grid. Farmers can sell surplus power to the Discom, earning a FiT for each unit sold. In theory, farmers would refrain from pumping if the marginal benefit is lower than the marginal benefit of selling electricity that is, when the marginal benefit of pumping is lower than the FiT. The World Bank estimates that at a FiT of ₹3.69/kWh, this will indeed be the case for most crops grown in Rajasthan.23 Furthermore, compared to variable agriculture production and markets, selling power to the grid could assure farmers a relatively stable income. Risk-averse farmers may
15
therefore be more willing to substitute electricity sales for water pumping than the Bank’s calculations suggest.
OTHER STRATEGIC GOALS
KUSUM seeks to contribute to state and national solar goals. Rajasthan aims to install 30 GW of solar capacity by 2025 an ambitious target that can only be met with the mass-development of distributed solar.24 Rajasthan’s Renewable Purchase Obligation (RPO) also requires Discoms to source 21 percent of their total electricity from renewables by FY 2023-24, and 10.5 percent from solar, specifically.25 Nationally, India has oriented policies around a 175 gigawatt (GW) renewable energy target, including 100 GW of solar.26 Rajasthan’s solar development could be non-trivial progress toward these goals and other commitments made under the Paris Climate Agreement.27
KUSUM seeks to bolster the “Make in India” initiative to boost domestic manufacturing. KUSUM requires all solar cells, modules, and balance of systems to be domestically manufactured.28 At the moment, however, almost 80 percent of India’s solar value chain relies on imports (mostly from China), and domestic cell and module manufacturing amount to roughly 3 GW and 11 GW per year, respectively.29 The national government hopes to increase manufacturing capacity by inducing demand for domestic PV materials.
CURRENT PROGRESS
Solar feeders have been well-received in Rajasthan. In January 2020, the Rajasthan Electricity Regulatory Commission (RERC) fixed a price ceiling of ₹3.14/kWh for solar feeder generation, with Discoms able to discover lower prices through competitive bidding. Prices are reflected in 25-year power purchase agreements (PPA).30 Shortlisted solar feeder applications now total 815.5 MW in capacity, and the state generation company, Rajasthan Urja Vikas Nigam Ltd., recently lobbied to raise Rajasthan’s feeder allocation from 325 to 725 MW in the ongoing pilot.31 Tenders awarded for solar feeders sum to 722 MW, or 2.7 percent of Rajasthan's electricity capacity. Plans are in place to increase this total to 2,600 MW (or 9.2 percent of capacity) over the next three years.32,33
Unfortunately, however, feeder generation has yet to satisfy two of KUSUM’s objectives: increasing farmers’ incomes and incentivizing water conservation. To fill in these gaps, the Government of India (GoI) has encouraged state governments to benchmark farmers’ electricity consumption based on their average power requirement and incentivize farmers if consumption is less than this benchmark. However, these directions lack specificity and the methodology for calculating benchmark power consumption is relatively vague. Hence, it is currently unknown whether these recommendations will have the desired effects on the state governments.
Solar pumps could increase farmers’ income. Under KUSUM C, RERC fixed a ₹3.44/kWh tariff at which Discoms would purchase surplus power from grid-connected, solar pumps.34 Under KUSUM
16
C, Rajasthan has received sufficient solar pump applications to meet first-year targets (about 12,500 farmers),35 and Discoms have released tenders identifying 60,008 horsepower (HP) of sanctioned load covering nearly 230 substations where 100 percent of connected farmers have provided consent, or 90 MW in capacity (assuming the PV system is sized at 1.5 times the pump capacity, as permitted by KUSUM C guidelines).36
However, despite this evidently strong interest, farmers hesitate to self-finance contributions toward solar pump projects. Private developers also struggle to secure necessary financing, as banks are as yet unprepared to accept the risk involved. The central government has recently allowed clustered, feederstyle generation under KUSUM C, with its more attractive CFA.37 The hope is that Discoms will build distributed feeders through this path, either directly or via a RESCO partner.
ROADMAP OF REPORT
The first portion of the report provides background on the key players involved in KUSUM, what is at stake for water access, and the political context in which decisions are being made. It proceeds to an economic analysis and comparison of both the feeder and grid-connected pump modalities, a deeper discussion of the schemes’ effect on water resources, and an exploration of potential obstacles to, and best paths for, a successful rollout. Lastly, it considers secondary effects on employment and equity outcomes, and concludes with policy recommendations.

17
III.
CONTEXT FARMERS
Rajasthan’s agricultural output is among the highest in India, and its people rely on agriculture for their livelihoods. In terms of total production, Rajasthan is first among Indian states in millet and mustard, second in groundnuts, third in pulses and soybeans, and fifth in wheat.38 It also boasts India’s second-largest herd of livestock. In terms of income, agriculture comprised 25 percent of Rajasthan’s Gross State Domestic Product (GSDP) in FY 2019-20. No fewer than 5.4 million households some 60 percent of the state’s population are engaged in farming and depend on the sector for their livelihoods. Of these, approximately 50 percent are classified as ‘small’ or ‘marginal’ farmers, meaning they own less than two hectares of land.39 Rajasthan’s agricultural sector is thus a crucial check against poverty and food insecurity.
Rajasthan owes its agricultural success to decades of expanded groundwater irrigation infrastructure (Figure 1). After India achieved its independence in 1942, GoI and Government of Rajasthan (GoR) promoted rapid construction of the state’s groundwater irrigation infrastructure through government programs.40 These efforts, combined with a lack of alternative irrigation sources in Rajasthan and the advent of the Green Revolution, increased massively the amount of groundwater drawn for agriculture. Today, agriculture soaks up 83 percent of Rajasthan’s water resources, and 73 percent of the state’s irrigated land depends on groundwater. Rajasthan’s farmers have capitalized on increased access to groundwater by expanding cropping area, growing irrigated dry season crops such as wheat and oilseeds, and growing high-value horticultural crops.41 In 2018, farmers planted 2.8 million hectares of wheat and 4.11 million hectares of oilseeds, 99.6 percent and 64 percent of which were irrigated, respectively.42 In arid western Rajasthan, area irrigated by wells increased from 136,000 hectares in 1951, to 651,000 hectares in 1981, to 1.56 million hectares in 2005. Groundwater became a major driver of changes in land use, as even rocky and gravelly wastelands were transformed into irrigated croplands.43
Foodgrain Production ('000 metric tons)
Increased groundwater-sourced irrigation has been a primary driver of increases in agricultural output in Rajasthan over the past six decades 44 According to the Ministry of Agriculture, gross irrigated area increased from 1.7 million hectares in 1957 to 9.7 million hectares in 2014. In the same time frame, foodgrain production increased from 4.9 million to 20.8 million metric tons. 73 percent of irrigated land in Rajasthan uses groundwater
18
Figure 1: Foodgrain Production in Rajasthan
0 5000 10000 15000 1957 1961 1965 1969 1973 1977 1981 1985 1989 1993 1997 2001 2005 2009 2013 Gross Irrigated
0 10000 20000 30000 1957 1961 1965 1969 1973 1977 1981 1985 1989 1993 1997 2001 2005 2009 2013
Area ('000 hectares)
In Rajasthan, farmers’ power supply is unreliable, limited, and provided at inconvenient hours of the day, affecting their ability to irrigate as desired. GoR’s goal is for farmers to receive at least six hours of electricity every day, but erratic supply, load shedding, and blackouts mean they often receive less.45,46 Official figures may also underestimate the impact of outages on agricultural users by omitting unofficial blackouts: In 2017, unofficial load shedding was so severe that farmers served by the Jaipur Discom could not pump long enough to keep crops alive.47 Unpredictability of supply may cause challenges for farmers with electrified irrigation pumps who would like to control the timing and quantities of irrigation. Furthermore, the electricity that is supplied to farmers often comes during the nighttime, causing inconvenience to farmers who would prefer to irrigate in the daytime.
WATER

Upkeep to the legal regime has not kept pace with expansion of groundwater. Under Indian common law, landowners may draw as much water as they desire from beneath their land, even if they deplete the water resources of their neighbors by doing so. 48 This rule, called the rule of ‘absolute dominion,’ originates in English common law and entered the Indian legal system during the colonial era.49 While the Indian Constitution vests states with the power to legislate over this background rule, to date GoR has not exercised this power.
Though GoR has not addressed this fundamental legal barrier to sustainable groundwater management, policies have been passed to attempt to conserve water, most notably the 2010 State Water Policy. The policy ‘discourages’ “[t]he current ethos of uncontrolled groundwater extraction as an ‘individual right,’ favoring an “ethos of community responsibility for the long-term sustainability of the aquifer as a community resource,”50 but absent legal reform proper, this admonition is not binding on landowners. Indeed, the policy specifically states that the “extraction of groundwater will be… regulated through appropriate legal framework,”51 language that seems intentionally vague.52 In the absence of overriding legislation, the ‘appropriate legal framework’ must be interpreted as the aforementioned common law rule of absolute dominion.
No legal mechanism exists in Rajasthan for communal management of common groundwater resources. Water User Associations have been formed successfully in some areas to manage surface water resources, but this model has had mixed results and has not been applied to groundwater. In 2016, GoR launched the Mukhya Mantri Jal Swavlamban Abhiyan program with the goal of resolving Rajasthan’s water scarcity problem. This program has included participatory water budgeting exercises in rural areas,53 which could be an important step toward communal management of groundwater. However, the results of those exercises have not yet been widely implemented.54
Absent legal barriers, unchecked irrigation has led to overexploitation and severe depletion of Rajasthan’s groundwater resources. Farmers perceive groundwater as a private resource and have an incentive to draw as much as possible without regard for the effect on overall supply.55 Groundwater development, defined as the ratio of annual groundwater draft to recharge, increased
19
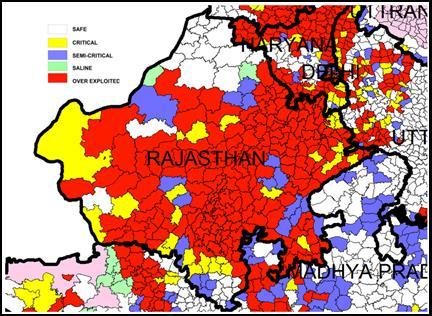
from 36 percent in 1984 to 137 percent in 2011 as Rajasthan’s population grew and farmers drew more water for irrigation.56 74 percent of Rajasthan’s water blocks57 are categorized as overexploited,58 which implies more water is being extracted than recharged, and the Ministry of Water Resources observes that Rajasthan’s water level has dropped between one and three meters annually 59 Equally troubling, eight percent of Rajasthan’s wells have gone dry60 and the continued spread of technologies such as borewells and more powerful pumps threatens to make the problem even worse 61
Electrified irrigation pumps and subsidized electricity have exacerbated the groundwater crisis. As a result of significant subsidization, farmers in Rajasthan pay only ₹0.9/kWh to power their electric irrigation pumps.64 These low rates have almost certainly increased agricultural production and rural incomes in Rajasthan, as they have across much of India.65 However, most experts believe these subsidized tariffs have also led to over-extraction of groundwater in India’s western states.66 At their low, subsidized marginal cost of pumping water, farmers do not have incentive to conserve water, despite declining marginal benefits from successive rounds of irrigation. 67 Especially in the arid west of the state, with its relatively lower water table and more frequent droughts, the proliferation of electrified tubewells, which can extract water from greater depths, has enabled farmers to extract more water than was previously possible.68
The quantity and size of electric pumps in Rajasthan are both increasing, enabling farmers to draw even more groundwater. The number of electrified pumps in Rajasthan rose from seven lakh in 2003
04 to 11 lakh in 2012
13, an increase of 57 percent. Over the same period, electricity consumption from pumps grew 329 percent, from 4,274 GWh to 18,325 GWh. 69 Since the number
20
Figure 2: Status of Groundwater Blocks in Rajasthan 74 percent of Rajasthan’s groundwater blocks are classified as overexploited.62 The aquifer on which it sits is considered to be the most depleted major aquifer in the world.63
–
–
of hours of electricity supplied to farmers remained fairly constant over that period, these numbers indicate increases in both the number and size of pumps. With these pumps, farmers can draw more water from greater depths.
Rajasthan’s groundwater crisis is already hurting farmer livelihoods. In western Rajasthan, areas that previously transitioned from rainfed to groundwater-irrigated agriculture are now transitioning back to rainfed agriculture as their wells have dried up, with major economic and livelihood consequences. Aside from the obvious downsides of returning to a reliance on scant and unpredictable rainfall for livelihoods, this pattern also leads to increased erosion and soil depletion because traditional soil-conserving agricultural techniques were abandoned in the initial switch from rainfed to irrigated agriculture.70 Increased water scarcity limits types of crops farmers can grow, control over timing of irrigation, and control over quantity of water applied; in one survey in southern Rajasthan, 73 percent of farmers listed water scarcity as the main constraint to their agricultural productivity.71 Economic analysis of water scarcity in other parts of India suggests that the drying up of wells results in long-term declines in farmer incomes and wealth.72
Marginalized groups are disproportionately affected by increasing groundwater scarcity. As water tables fall, costs of extracting water increase because more expensive technology is required for extraction. Wealthier farmers are more likely to be able to afford increased well construction costs and are thus less impacted than poorer farmers. This increases monopoly power of wealthier pump owners in groundwater exchanges, which means water buyers might pay exorbitant prices or lose water access. 73 Groundwater is also a buffer against frequent droughts in Rajasthan, which can cause scarcity of food and drinking water for marginalized groups. During one drought in 2016, 13,500 villages did not have access to drinking water and relied on tankers supplied by the government. Water scarcity has also been linked to malnutrition and distress migration in rural Rajasthan.74
DISCOMS
Discoms are being squeezed by high cost of supply, distribution losses, and insufficient revenue recovery.
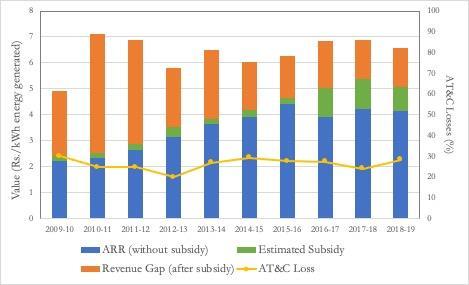
Figure 3 As shown in
Figure 3, both average revenue (ARR) without subsidies (shown in blue), and average cost of supply (ACS – the total height of the stacked bar) have increased over the past decade. Taken together, the ARR, the estimated subsidy (which includes the GoR tariff subsidy and revenue grants under UDAY – shown in green), and the remaining Discom revenue gap (shown in orange) total the ACS The revenue gap has shrunk over the past few years since the most recent Discom bailout in 2015. Nevertheless, persistently high costs and revenue shortfalls prior to (and even after) subsidies remain high, creating an unsustainable pattern.
21
While Discoms throughout India are mired in debt, electricity provision in Rajasthan is complicated by physical realities like an arid climate and relatively low population density. Low density makes for increased distributional losses and higher grid maintenance costs. In addition, the state’s lack of conventional, low-cost electricity resources such as coal and hydroelectric power has led to higher prices locked in through long-term power purchase agreements.75
Agricultural electricity burdens are higher in farming states like Rajasthan, where tariffs are low and government- and cross-subsidies are high. Low tariffs are cross-subsidized by higher tariff consumers, such as industrial or commercial users, and by government subsidies. Agricultural electricity revenue at the nominal tariff is 26 percent less than the estimated cost of supply, while the rate for nondomestic consumers is about +35 percent.76 Cross-subsidization incites high-tariff consumers to flee to lower cost options, like self-generation or power exchange markets, which also widens revenue gaps and requires higher cross-subsidization for remaining consumers.77 Measures that reduce the need for cross-subsidization and direct subsidies improve the sector’s sustainability.
In Rajasthan, farmers consume over 40 percent of all electricity, and GoR subsidizes about 85 percent of the nominal tariff for metered agricultural consumers.78 GoR’s energy spending was 8.3 percent of its 2020-2021 budget and 12.2 percent of the previous year’s actual spending. For 2020-21, over 75 percent of GoR’s energy budget is reserved for power tariff subsidies.79
Revenue shortfalls lead to chronic debt to the public banking sector, and a cycle of bailouts have strained state finances without significantly improving Discom finances. The most recent bailout, approved in November 2015, was the Ujwal Discom Assurance Yojana (UDAY) scheme. 80 The state assumed 75 percent of its Discoms’ debt from 2015-2017, and utilities underwent efficiency improvements to lower aggregate technical and commercial losses and narrow the gap between ACS
22
Figure 3: Rajasthan Distributed Sector Costs, Revenue Gap, and Losses
The Rajasthan distribution sector average cost of supply and aggregate technical and commercial (AT&C) losses are shown for fiscal years 2009-10 through 2018-19. Average cost of supply is broken into regulated revenue, estimated subsidy, and remaining revenue gap.
and ARR.81 UDAY and large agricultural electricity subsidies have together caused Rajasthan to direct an average of 10 percent of its annual expenditure toward energy subsidies and grants. Discom debt restructuring under UDAY comprises 50-60 percent of the state’s total interest payments, significantly straining the fiscal health of GoR.82 In addition to assuming Discoms’ debt, Rajasthan has also provided grants to improve Discoms’ performance and finances, with funds allocated to increase the capacity of nearly 1,500 substations and support distribution and siting for distributed generation. 83 Most recently, in 2019-2020, GoR provided a ₹14,722 crore grant to Discoms to bolster their finances.84 These bailouts have been preceded by and paired with other distribution sector reforms, which are described in Appendix F.

POLITICAL ECONOMY
Rajasthan’s politicians advance the irrigation and water access interests of their bases, often at the expense of other groups.85 In Rajasthan, much like the rest of India, farmers are a focal point of electoral politics.86 Agricultural livelihoods are at the forefront a small farmer in Rajasthan earns approximately ₹42,000 per year, while a large farmer earns a somewhat larger ₹55,000.87 The shared pressures of low incomes and a large population base unite the farm sector on issues like loan waivers and electricity subsidies that affect all livelihoods equally. There is no such unity on issues of irrigation, however, which pit farmers requiring access to a scarce resource against one another. For those without access to water historically disadvantaged groups, those in tribal areas, or those belonging to lower castes it can be challenging to argue for and obtain greater access to water. For this rival resource, one’s group’s gain comes at another’s loss.
Irrigation issues have been and will remain a perennial subject of electioneering.88 Rajasthan has switched party control multiple times, such that neither the Bharatiya Janata Party (BJP) nor the Congress Party has the political capital to alienate farmers. As such, neither are likely to impose tariffs, reduce subsidies, or price water, as elected officials understand that access to water is a critical matter of lives and livelihoods in communities that have historically been denied access to irrigation
Rajasthan has had a long and fraught history with vote bank politics. Political leaders across states and elections have long proffered loan waivers and power subsidies to lock in the large farming vote bank. In one example, when contesting the Delhi elections in 2019 the Congress Party promised an electricity subsidy should it win. Similarly, in Rajasthan’s 2020 election, the incumbent chief minister announced a further 2300 crore electricity subsidy for farmers contingent on his reelection. Politicians do not always follow-through on election promises: as of June 2020, farmers in Rajasthan reported they still had not received electricity subsidies promised by the government in power in 2018.89 Access to, quality of, and subsidies for electricity have figured prominently in politicians’ electoral promises in recent years. Consequently, these issues have come to shape the electricity priorities of the states and central government alike.90
23
IV. ECONOMIC CASH FLOW ANALYSIS
Farmers’ and developers’ motivation to solarize will depend largely on expected financial returns. At a minimum, the method of solarization must meet their cost of capital (interest on debt and acceptable return on equity) in order to be considered viable. The following section details the estimated solar generation expected from solar feeders and solar pumps, and the financial value offered to the solar project developers and farmers who would need to invest in solarization. In all cases, value was determined via discounted cashflow analysis that considered capital and operating costs, revenues, and cost savings. Additionally, to evaluate solar pumps’ and solar feeders’ potential to relieve state and Discom financial burdens, the value of each to Discoms and GoR was also determined via discounted cashflow analysis.
KUSUM A Generation and Sizing
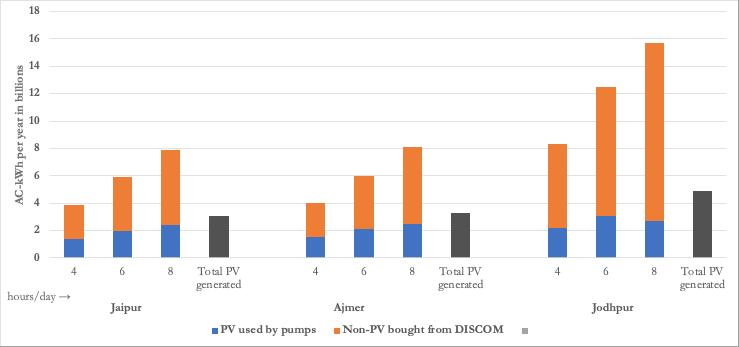
Based on modeling by the research team, as currently scoped in the scheme’s guidelines, KUSUM A generates less than half the energy needed for irrigation. The amount of solar generation that is used to meet agricultural load is important, given that the benefits of KUSUM rely, in part, on the co-location of solar generation and agricultural load leading to reduced transmission and distribution losses. Based on the KUSUM A array sizes tendered for pump use, Figure 4 shows the solar electricity generated as well as the residual grid electricity that farmers need to power their pumps for a range of four, six, and eight midday hours. Across all Discoms, even the four-hour irrigation scenarios show that KUSUM A generation (blue bars) meets less than half of pump electricity demand, indicating that under the scheme as currently specified there is relatively low solarization of agricultural load. The grey bars in Figure 4 show the total PV generated in each of the Discoms, which imply that not all PV that is generated goes to pumps given the difference between the blue bars (PV used by pumps) and the grey bar. This may be an artefact partially of the assumed mid-day operating hours for the pumps.

24
For
Determining the plant size required to meet more of the agricultural demand would require an understanding of how agricultural load is distributed throughout the day, which varies with farmer behavior and preferences. Even in the model presented above there are some hours of the day when the feeders are generating more energy than pumps use and were farmers to change irrigation patterns accordingly use of feeder energy could increase. The modeling also highlights the need to better understand how farmers will use their pumps if agricultural feeders are solarized. This will require collecting data on farmer behavior. Determining the appropriate array size to meet that load would require knowledge of daily and annual electricity needed for adequate irrigation, as well as estimates for future consumption to ensure sizing is appropriate for farmer needs. This could then be analyzed to see how much solar generation potential exists to be captured at those times and what size array would be needed to do it. Absent that data no judgement can be made of optimal plant size. For a full account of PV sizing and generation methodology, please see Appendix A.
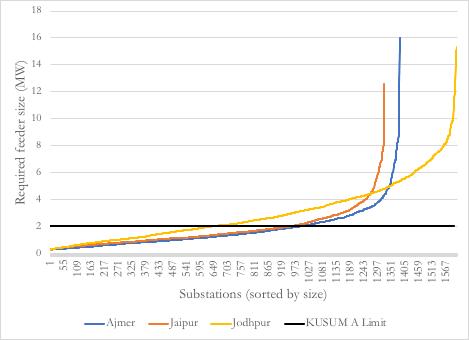
In Rajasthan, the Discoms currently use an approximation method for sizing load, where maximum load is assumed to be 70 percent of connected load. Figure 5 plots the feeder sizes of all substations within each Discom, based on Rajasthan’s sizing criteria of 70 percent of the connected load. Based on this sizing criteria, only 60 percent of the feeder systems are appropriately sized for the load, and the remaining loads would be undersized due to the 2 MW constraint. For example, increasing the capacity limit for feeders under KUSUM A to 4.5 MW would enable solar panel sizing for 90 percent of the loads.
25
Figure 4: PV Generated and Purchased Under KUSUM A for four/six/eight hour a day scenarios for each Discom
each Discom, this calculation assumes an installed PV capacity equal to the sum of PV capacity allowed at each substation and an installed agricultural load equal to the sum of agricultural loads at each substation, both as enumerated in the KUSUM A tender document for the Discom. See Appendix A for additional details.
Annexures91,92,93
Financial Outlook for Farmers
Landowning farmers whose property is located near substations stand to benefit from leasing land for solar feeder projects. Early reports from Discoms indicate strong developer interest in leasing land from farmers under KUSUM A. That said, anecdotal evidence from a past solar initiative (see: SKY Initiative, Appendix D) suggests that developers may prefer to invest in larger-scale projects or urban, rooftop generation projects rather than conduct business in remote, rural areas. It may be that farmers in more well-connected areas will be able to lease out land while those in remote areas will not have the opportunity to provide land for leasing. Developers may also attempt to negotiate contracts at very low lease rates to the detriment of farmers. By fixing a schedule of attractive leasing rates to implement program-wide, a different solar initiative (see: Delhi initiative, Appendix D) avoided such concerns. GoR could consider adopting a similar mechanism to protect farmers interested in leasing land for KUSUM A.
Financial Outlook for Developers
For Developers, KUSUM A is likely profitable at the current tariff rate, though that is sensitive to risks to the cost of capital and supply chain constraints. For KUSUM A, Rajasthan’s existing ₹3.14/kWh tariff elicits a slightly negative net present value (NPV) under our assumptions, as shown in Table 1. However, due to substantial uncertainties in costs that have a large impact on the NPV results, the current KUSUM A tariff likely allows developers to achieve close to their required rate of return. The NPV of solar feeders is most sensitive to: (i) the capital cost of solar modules, (ii) the
26
Figure 5: Feeeder Size per Substation Across Discoms
The feeder size (using the Rajasthan design criteria of 70 percent of total connected agricultural load) is plotted for all substations in each of the three state Discoms This shows that the 2 MW only enables appropriate sizing for 60 percent of substations Sources: RRECL Request for Selection (RfS) for KUSUM A
operational and maintenance cost of solar modules, (iii) the cost of land where solar modules are sited, and (iv) panels’ capacity utilization factor (a full sensitivity analysis is provided in Appendix C).
Feeder Under KUSUM A (No Subsidy)
NPV with a tariff of ₹3.14/kWh: -₹0.19 crore NPV of 0 achieved with a tariff of: ₹3.27/kWh
The viability of the scheme may depend on GoR’s willingness to adjust tariff ceilings as needed to allow developers to place profitable bids based on potential changes to cost of capital and capital costs. First, the cost of capital is sensitive to the project risk profiles. If the project risk increases or the banking sector becomes constrained, developers’ cost of equity and/or debt may rise above current best estimates, requiring a higher tariff to maintain profitability. A full capital cost sensitivity analysis is provided in Appendix C. KUSUM’s domestic manufacturing requirements may also increase the cost of panels. In the event of severe supply chain constrictions, a flexible tariff cap could help developers continue to bid on feeder projects that would otherwise have been unprofitable at the ₹3.14/kWh ceiling. In order to deter potential abuse of a flexible cap by developers, regulators could ensure that the price rises only if certain unfavorable economic conditions exist and the existing tariff is failing to entice developers to bid at or below the current rate.
Financial Outlook for Discoms
For Discoms, KUSUM A leads to significant savings at the ceiling tariff across all pumping scenarios modeled, but total NPV savings are sensitive to the cost of supplying agricultural electricity. Discom savings under KUSUM A derive from a lower-than-average power purchase cost, as well as co-location of the generation and agricultural load that eliminates transmission losses and minimizes distribution losses. Discom savings, shown in Table 2, are estimated for the ceiling tariff and may be higher if competitive bids result in a lower tariff. The benefit-cost ratio compares Discom savings to subsidy costs for KUSUM A and is very high, as only a small PBI from GoI for the first five years of operation is provided for KUSUM A.
NPV per pump savings are estimated based on assumption of 8 hours of pumping per day, or 2,424 hours per year. NPV Discom Savings and NPV Subsidy Payment are estimated for the deployment of 725 MW under the KUSUM A pilot. Benefit-cost ratio is the ratio of the Discoms’ estimated net savings to the estimated cost of the scheme (through subsidies) to government. For detailed calculation assumptions and methodologies, please refer to Appendix B.
27
Table 1: Discounted Cash Flow Analysis Results using central estimates for cost and performance, normalized to 1 MW solar PV capacity
Feeder under KUSUM
Savings Per Unit Discom Savings for First Year ₹ 1.49/kWh NPV Per Pump Discom Savings ₹ 194,060 NPV Discom Savings ₹ 2,505 crore Benefit-cost Ratio 15.15
Table 2: Discounted Cash Flow Analysis Results for Discom Savings under KUSUM A Pilot
A
An important sensitivity to the estimated Discom savings is the current cost of serving agricultural load in Rajasthan. This analysis uses the average power purchase cost, transmission and distribution losses across all three Rajasthan Discoms to estimate current cost of electricity, but costs of serving agricultural load may be lower. Current agricultural electricity use is often restricted to late night hours when the cost of supplying power is likely cheaper, because the system demand is low such that the highest cost generators are less likely to be operating If electricity displaced from the grid is less expensive than the average estimate, savings under KUSUM A would be lower than estimated. The minimum average grid electricity power purchase cost for which the Discom would realize savings under KUSUM A is ₹2.63/kWh. This means that even if the current power purchase cost is less than the KUSUM A ceiling tariff, KUSUM A may still provide savings due to its colocation with load.
An additional uncertainty is whether and how Discoms will restrict electricity availability under KUSUM A. As noted earlier, the PV system capacities identified in Discom tenders for KUSUM A are generally sized for 70 percent of the corresponding substation-specific agricultural load except as limited by the feeder capacity limit, such that the identified KUSUM A capacities may not provide sufficient electricity for agricultural pumping needs. Therefore, farmers may still require grid electricity to meet a portion of agricultural pumping load. To consider the Discom savings when electricity access may be restricted, a comparison of Discom savings under 4, 6, and 8 hours of available electricity is presented in Appendix B.
The third uncertainty is whether Discoms can use the excess solar generation to serve other load. Because the solar feeders are generally undersized in Rajasthan (as limited by the 2 MW limit), the default assumption for the solar feeder savings estimates shown in Table 2 is that excess generation is minimized, and the relatively small amount of excess generation is likely able to be utilized locally. However, if the Discom is unable to use the excess generation, the Discom savings would only derive from displacing grid electricity for agricultural load, and would be lower, as shown in Appendix B.
Financial Outlook for the Government of Rajasthan
Under KUSUM A, GoR is likely to continue paying the subsidy for agricultural electricity users, and any reduction in the subsidy burden is highly uncertain and dependent on agricultural tariffs being decreased. While KUSUM A would decrease the cost of serving agricultural load due to the lower cost of solar energy, RERC may be unwilling to reduce agricultural tariffs, and instead distribute the Discom savings in supply costs by reducing the cross-subsidy of agricultural electricity charged to industrial and commercial customers. In the long term, GoR is likely to benefit from increased revenues from retention of these reliably paying customers, but if savings from agricultural subsidies are simply redistributed to industrial and commercial customers, it is unclear whether GoR will face a reduced subsidy burden in the short run.
While there may not be direct reduction in subsidy burden under KUSUM A, GoR benefits from the certainty and significant amount of Discom savings, as better Discom finances can help relive the systemic strain on state finances the Discoms currently present.
28
KUSUM C
Solar Generation and Sizing
For KUSUM C, the MNRE has proposed three primary modalities that have very different cost structures: pump-level solarization without net metering, pump-level solarization with net metering, and feeder level solarization (analogous to KUSUM A, but with a 30 percent upfront subsidy). Given that the KUSUM C feeder-level solarization is only recently announced, the ceiling tariff under this scheme remains to be determined. While the developer and Discom will depend on the choice of ceiling tariff, the costs and benefits are analyzed for the new feeder-level scheme to show the potential break-even tariff, as well as the maximum potential Discom savings.
Guidelines for pump-level KUSUM C projects permit installations of capacity up to twice that of the connected pump, though recent analysis from the World Bank uses a more conservative 1.5 scale to account for the financial constraints of farmers unable to purchase higher-capacity pumps, even using government subsidies. This analysis assesses scales of 1, 1.5, and 2 times the pump load to consider a range of financial capabilities.
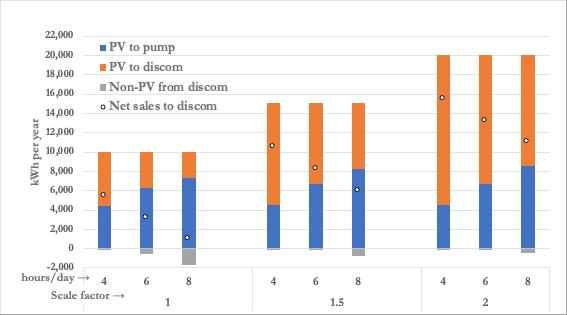
Under pump-level solarization, KUSUM C permits farmers to sell excess electricity to the Discom. Figure 6 shows the portion of PV electricity used to run pumps for four, six, and eight midday hours per day relative to the portion sold back to the Discom under three different generation scenarios. The generation profiles and consumption associated with each of the four, six, and eight-hour scenarios are estimated with methodologies explained in Appendix A. When pumps are run for fewer hours, a higher portion of electricity can be sold back to the Discom. Unlike KUSUM A, a very high portion of the pumping load is supplied by PV, with and without net metering.
29
Financial Outlook for Farmers
The financial analysis assumes that farmers are positioned to take advantage of KUSUM C pumplevel solarization and that developers are positioned to take advantage of KUSUM C feeder-level solarization. Whether KUSUM C solar pumps will raise farmers’ incomes depends primarily on the amount of capital subsidization for the scheme, since farmers may be unwilling or unable to afford to finance the total project capital cost.
Farmers are not likely to benefit from pump-level modalities of KUSUM C at the current level of capital subsidy and expected FiT, though there are large uncertainties. As shown in Table 3, KUSUM C requires either additional capital subsidies to reduce the initial investment or higherthan-proposed tariffs in order to return a positive NPV, for both pump-level solarization options. The discounted cash flow analysis for KUSUM C with net metering indicates that farmers will require a 74 percent subsidy to break even on the project, assuming a reasonable market FiT of ₹3.44/kWh. Alternatively, a FiT of ₹9.91/kWh will also tip the NPV positive. While these findings demonstrate that farmers could benefit from KUSUM C, the project currently features only a 60 percent subsidy and is unlikely to offer FiTs anywhere near ₹10/kWh. KUSUM C without net metering is even less financially viable, as the generation analysis shows that a lower share of electricity would be sold back to the Discom (see Appendix A for the full solar generation analysis). If the net-metering revenue stream is excluded, an additional subsidy of approx. ₹3.16/kWh would be required in order for the solar pump to be financially viable for farmers.
30
Figure 6: KUSUM C Net Metering Scenarios With a 5 HP Pump in Jaipur Discom For four-hour scenarios across Discoms, a higher portion of electricity is sold back to the Discom vs. the six and eight hour scenarios. Results look similar across other Discoms as well. See Appendix A for additional details.
Moreover, note that, unlike solar feeders, pump-level solarization under KUSUM C presents further costs to farmers in the form of learning about, maintaining, and securing the solar panels. Premature depreciation or panel theft may end any increases in income long before the PPA term expires.
Under the KUSUM C feeder scheme, farmers will likely benefit similarly to the KUSUM A scheme. The primary benefit to all farmers would be increased access and reliability of electricity. In addition, landowning farmers will also be able to benefit from leasing their land for the feeder-level solar panel, which may significantly increase their incomes, as was suggested for KUSUM A in Section IV.A.
The primary factors contributing to uncertainty around the NPV of solar pumps under KUSUM C are: (i) the capital cost of pumps, (ii) the price of avoided electricity purchases, and (iii) the ratio of installed PV capacity to pump power. For example, a 50 percent increase in capital cost would require an additional subsidy of ₹6.45 crore/MW. The level of variability in these factors results in greater overall uncertainty for solar pump projects than for solar feeder projects. A full sensitivity analysis is provided in Appendix C.
Financial Outlook for Developers
For developers, feeder-level KUSUM C is likely more profitable than solar pumps, principally due to greater economies of scale from larger solar feeder systems compared to smaller solar pump systems. Assuming that Rajasthan’s KUSUM A ₹3.14/kWh tariff is relevant for feeder-level KUSUM C, developers could expect a slightly positive NPV, as shown in Table 3. Compared to the other two KUSUM C modalities, a much lower tariff of around ₹2.72/kWh is required to meet the assumed cost of capital. This lower breakeven tariff should be considered in setting the ceiling tariff for feeder-level KUSUM C.
Solar Pumps Under KUSUM C (No Net Metering)
NPV with a tariff of ₹3.44/kWh: -₹5.73 crore
Capital Subsidy Required for NPV = 0
81%
NPV of 0 achieved with a FiT of: ₹13.07/kWh
Solar Pumps Under KUSUM C (Net Metering)
NPV with a tariff of ₹3.44/kWh: -₹10.60 crore
Capital Subsidy Required for NPV = 0
NPV of 0 achieved with a FiT of:
74%
₹9.91/kWh
Feeder Under KUSUM C (30% CAPEX Subsidy, or ₹2.52 crore/MW CAPEX)
NPV with a tariff of ₹3.14/kWh: ₹0.85 crore
NPV of 0 achieved with a tariff of: ₹2.72/kWh
The Net Present Value (NPV) of Feeders and Pumps under KUSUM A and C, given best estimate assumptions for the cost of inputs. Results are for 6 hours of pumping and are normalized for 1 MW solar PV capacity. For detailed calculation assumptions and methodologies, please refer to Appendix B.
31
Table 3: Discounted Cash Flow Analysis Results for Farmers and Developers
Financial Outlook for Discoms
For Discoms, pump-level solarization under KUSUM C leads to significant savings assuming 8 hours of pumping per day, but savings are highly sensitive to the hours of pumping and level of feed-in tariff. Under pump-level KUSUM C, Discoms are no longer the primary electricity supplier for farmers with solarized grid-connected pumps and must purchase excess PV generation that farmers sell to the grid for ₹3.44/kWh. As shown in Table 4, the benefit-cost ratios for both modalities of pump-level KUSUM C are substantially lower than those shown earlier for KUSUM A, due to the 60 percent total capital subsidy required from GoR and GoI.
KUSUM C feeders also likely result in significant Discom savings, contingent on the ceiling tariff yet to be determined by RERC. Potential savings to Discoms are analyzed based on the lower breakeven cost that the 30 percent capital cost subsidy from GoI enables. As shown in Table 4, at a breakeven cost of ₹2.72/kWh, the Discom savings are ₹217,303 per pump for 8 hours of pumping, which is twelve percent higher than the comparable Discom savings in KUSUM A shown in Table 2. Compared to KUSUM A, the KUSUM C feeders are likely less cost-effective overall, because the maximum additional Discom savings do not offset the additional costs to GoI for the 30 percent capital subsidy.
Additionally, for KUSUM C feeders, savings to Discoms also depend on the implementation model. The CAPEX model likely allows the Discoms to maximize their savings compared to the RESCO model. When the Discom takes on the risks of developing solar feeders under the CAPEX model, they directly benefit from the capital cost subsidy. On the other hand, in the RESCO model, the developers will receive the capital subsidy, and it is unclear how much of the savings would be passed on to Discoms. The maximum savings shown in Table 4 are more likely to be representative of the CAPEX model, as the RESCO model would likely have a ceiling tariff above the breakeven cost to allow the developer to make a profit.
32
Table 4: Discounted Cash Flow Analysis Results for Discom Savings under KUSUM C Pilot
NPV per pump savings are estimated based on assumption of 8 hours of pumping per day, or 2,424 hours per year. NPV Discom Savings, NPV Subsidy Payment, and the Benefit-cost Ratio (ratio of the Discoms’ estimated net savings to the estimated cost of the scheme to government) are estimated for the deployment of grid connected pumps for all 60,008 HP of load identified in the KUSUM C Tenders. For detailed calculation assumptions and methodologies, please refer to Appendix B.
Two major sensitivities for pump-level KUSUM C include the hours per day of pumping and the cost of supply replaced by solar generation. Estimates of agricultural electricity consumption and pumping in Rajasthan are not available at high spatial resolution. As such, this analysis makes simplifying assumptions regarding hours of pumping for four, six, and eight hours per day. The solar pumps analysis shows that when a farmer runs a pump for 4 hours per day or 6 hour per day as compared to 8 hour/day, the farmer’s return on investment for solar pumps is higher. However, with lower farmer electricity consumption, the Discoms’ savings under KUSUM C significantly decrease; savings per pump drop by more than 60 percent when the average hours of pumping are 6 hours/day and are negative when the average hours of pumping are 4 hours/day. Higher returns might incentivize farmers to achieve lower levels of pumping, which would aid in conserving water but conflict with the aim of reducing Discoms’ financial burden.
Additionally, as with KUSUM A, the KUSUM C savings also depend on the cost of supply replaced by solar generation. The minimum power purchase cost of grid supply replaced by solar generation for which the Discom would realize savings under KUSUM C is ₹1.79/kWh with no net metering and ₹1.98/kWh with net metering, assuming 8 hours of pumping.
Discoms could benefit from greater savings if excess solar power can be used to meet non-agricultural demand at lower cost than current grid electricity. Because PV systems for pump-level KUSUM C are oversized and would produce significant excess generation, it is uncertain whether the excess solar generation can be used to serve non-agricultural load. Supplying non-agricultural load with excess solar power generation depends on the amount of load aligned with hours of solar generation and
33
Solar Pumps
KUSUM
Metering) Per Unit Savings for First Year ₹2.79/kWh NPV Per Pump Savings ₹241,608 NPV Discom Savings ₹308 crore Benefit-cost Ratio 1.00 Solar Pumps
KUSUM
Metering) Per Unit Savings for First Year ₹2.32/kWh NPV Per Pump Savings ₹208,884 NPV Discom Savings ₹266 crore Benefit-cost Ratio 0.88 Solar Feeders Under KUSUM C Maximum Per Unit Savings for First Year ₹1.91/kWh Maximum NPV Per Pump Savings ₹217,303 Maximum Benefit-cost Ratio 3.69
Under
C (No Net
Under
C (Net
how closely the load is located to the solar plant, among other factors. If excess solar generation can be utilized to meet non-agricultural demand, displacing a larger quantity of higher cost grid electricity, the expected Discom savings per pump for KUSUM C pumps could be at least doubled, as shown in Appendix B.
Financial Outlook for the Government of Rajasthan
For GoR, KUSUM C solar pumps could result in modest savings, but uncertainties are substantial. Under the solar pumps model for KUSUM C, GoR savings result from no longer needing to provide an agricultural tariff subsidy (equal to ₹4.65/kWh) for each unit of avoided grid electricity use. As such, net savings reflect the avoided tariff subsidies, offset by the 30 percent capital subsidy provided by GoR to farmers. As shown in Table 5, GoR’s savings from solar pumps are only slightly higher than the cost of providing the 30 percent upfront subsidy. Net savings under KUSUM C are approximately ₹47,000 per pump with no net metering and ₹13,600 per pump with net metering, assuming 8 hours of daily pumping Furthermore, the electricity subsidy savings are very sensitive to the amount of hours of current consumption; if farmers currently pump 6 hours or less per day, GoR savings from avoided tariff subsidization is less than the upfront capital cost subsidy.
For solar feeders under KUSUM C, any change to GoR’s agricultural tariff subsidy burden is highly uncertain, and any potential savings for GoR would be modulated by the RERC tariff setting process. Thus, the authors of this study chose not to speculate on such savings in this analysis. While there may not be direct reduction in subsidy burden from the KUSUM C feeder scheme, GoR benefits from the certainty and significant amount of Discom savings across levels of pumping consumption, as better Discom finances can help relieve the systemic strain on state finances the Discoms currently present.
NPV per pump savings and Benefit-cost Ratio are estimated based on assumption of 8 hours of pumping per day, or 2,424 hours per year. For detailed calculation assumptions and methodologies, please refer to Appendix B.
34
Solar Pumps Under KUSUM C Per Unit Savings for First Year (Avoided Tariff Subsidy) ₹4.65/kWh NPV Per Pump Subsidy Cost (30% CAPEX Subsidy) ₹294,505 Solar Pumps Under KUSUM C (No Net Metering) NPV Per Pump Subsidy Savings ₹341,774 Benefit-cost Ratio 1.16 Solar Pumps Under KUSUM C (Net Metering) NPV Per Pump Subsidy Savings ₹308,140 Benefit-cost Ratio 1.05
Table 5: Discounted Cash Flow Analysis Results for GoR Savings under KUSUM C Pumps Pilot
SUMMARY COMPARISON: KUSUM A AND C
Based on the current policy design, farmers appear more likely to benefit from solar feeders than solar pumps. The current KUSUM C solar pumps feed-in tariff of ₹3.44/kWh is not sufficient to mobilize investment from farmers, given farmer’s current cost of electricity For solar feeders, certain farmers could gain income from leasing land, as has been suggested for KUSUM A.
The current ceiling tariff for KUSUM A feeders is likely high enough to incentivize investment from developers. Of the two solar feeder options, KUSUM C requires a lower breakeven tariff (₹2.72/kWh) than KUSUM A (₹3.27/kWh), which should be considered in setting the ceiling tariff for KUSUM C.
Discoms’ savings from KUSUM A and C are similar, with slightly higher potential savings under KUSUM C. However, the risks associated with KUSUM C are much higher, as Discom savings significantly decline and can even become negative if farmers were to sell back higher proportions of solar generation by reducing their daily hours of pumping, compared to more stable savings across pumping levels in KUSUM A. Discoms may have slightly higher savings under KUSUM C feeders than KUSUM A, and the KUSUM C feeder CAPEX model is likely to offer more savings in the long run than the RESCO model
For GoR, solar feeders may not have an impact on the agricultural tariff subsidy burden, as savings would depend on tariff adjustment by RERC. On the other hand, solar pumps can result in slight benefits for GoR if current consumption represents 8 hours of daily pumping or more but may pose a net cost if current consumption is 6 hours or lower.
In conclusion, solar feeders pose lower risks to the financially burdened Discoms and GoR, while being cost-effective for developers and offering a passive income source to certain farmers through land leases.
Potential Tensions with Electricity Sector Grid Management and Fixed Costs
Though KUSUM appears to pose myriad benefits for the Discoms and GoR, there are also potential sources of tension Discoms have noted concerns around the grid integration of renewables. KUSUM guidelines require that Renewable Power Generators (RPGs) under KUSUM A are assigned “must run” status, meaning generation cannot be curtailed for any reason other than grid security. Though Discoms are required to specify a grid security issue when curtailing “must run” resources, they have at times curtailed “must run” generators in deference to thermal generators with fixed costs to meet. In states with high renewable penetration - where intermittency complicates grid management and grid-balancing, demand, and renewable generation forecasting are not always sufficient - Discoms have curtailed high levels of variable renewable energy.94 The deployment of distributed solar plants under KUSUM may further increase the challenge of grid management, as managing many distributed resources can be more challenging than few, large capacity plants.
Excess generated PV electricity will not necessarily result in cost savings for Discoms considering the Discom’s fixed costs and grid costs. Under typical terms of local PPAs between Discoms and thermal
35
generators, Discoms must pay high fixed costs to generators even if capacity utilization is low.95 Thus, Discoms have a financial disincentive to dramatically step up renewable energy capacity. However, the aggregate impact of KUSUM solar capacity on thermal capacity utilization and grid stability is small compared to other currently planned solar PV capacity expansion, whether from utility-scale projects or self-generation from larger consumers.
36
V. WATER IMPLICATIONS
Solarizing the agricultural power supply may endanger Rajasthan’s groundwater resources by increasing farmers’ ability to draw water at a near-zero marginal cost. Solar-powered electricity schemes endeavor to supply farmers with a reliable supply of daytime electricity, which will likely bring benefits to agriculture. However, farmers may use newly-generated solar power to pump even more groundwater than they could before. Prior experience with off-grid solar pumps in Rajasthan suggest that farmers respond to increased electricity supply by increasing cropping intensity or growing more water-intensive crops.96 This does not necessarily mean solarization will worsen the groundwater crisis, but it remains a possibility.
Solar-powered irrigation may both (1) cause farmers who already own pumps to draw more water and (2) incentivize farmers without pumps to acquire one. Considering the extreme levels of groundwater overexploitation in Rajasthan, policies should not ignore the risk posed by solarization to groundwater resources.
There is insufficient evidence to rule out the possibility that solarization will exacerbate groundwater overextraction. The only data to suggest how farmers may respond to the incentives that grid-connected solarization offers are from small pilot studies in other Indian states. These studies have not shown that solarization results in water conservation, and in general have not measured water extraction results adequately. Furthermore, their results may not be relevant for KUSUM implementation in Rajasthan due to differences in scope of interventions, implementation details, and local factors such as agricultural practices and water scarcity.
Absent empirical evidence, predictions of farmer responses to solarization often rely on economic analysis.97 This ignores that farmers may have non-economic reasons for selling water, such as familial ties or religious or moral values, or that their economic motivations may be difficult to predict. For example, researchers at the World Bank calculate that farmers of most crops grown in Rajasthan would have an economic incentive to sell electricity to the grid if provided with a reasonable FiT 98 Such analysis doesn’t typically account for the possibility that farmers switch to growing higher value but more water-intensive crops.
Coupling solarization with irrigation efficiency improvements is unlikely to reduce groundwater extraction. A common misconception is that increasing water efficiency necessarily conserves water; however, examples from across India (and other parts of the world) suggest the opposite is often true. For example, a previous off-grid solar pump scheme in Rajasthan required farmers to own drip irrigation systems to be eligible. Though this was found to increase the productivity of per unit water use, total use did not decrease.99 Technologies and practices that improve the effectiveness of irrigation application (e.g. by applying water at optimal times and locations in plant root zones) can lead to higher-yielding plants, boosting profitability but not necessarily reducing the overall water application.100
37
There is insufficient empirical evidence to judge whether a change from nighttime to daytime irrigation would affect groundwater extraction. First, daytime irrigation will increase water losses through evapotranspiration, particularly in Rajasthan’s hot, arid climate. As such, daytime is generally considered the worst time to irrigate from a water conservation standpoint.101 Second, the argument that farmers will irrigate less during the daytime relies on the assumption that farmers are currently overirrigating and would be motivated to eliminate that excess by pumping less Available evidence suggests the opposite may be true that farmers will apply more water if given the opportunity. This is because the value from increased crop production, or from selling water to neighbors, likely outweighs the costs of pumping water in most cases.102
The FiT mechanism for grid-connected solar pumps in Rajasthan may be too low to prevent over-extraction of groundwater, and the mechanism itself may be too inflexible to achieve groundwater conservation goals. The best evidence for farmer behavior in response to the FiT comes from the Dhundi cooperative study in Gujarat. Farmers were offered a tariff over ₹7/kWh and in response chose to sell a large proportion of electricity back to the grid. However, the study did not provide evidence that farmers used less water in total. In fact, it seems possible that overall water use actually increased as farmers found it profitable to sell water to their neighbors.103
Rajasthan’s proposed FiT (₹3.44/kWh) is considerably lower than what was offered in Dhundi.104 With the FiT too low, participating farmers could choose to grow more water-intensive crops or sell water to their neighbors rather than inject solar generated power to the grid. Such a result would likely exacerbate groundwater overextraction.
Furthermore, the FiT required to incentivize water conservation might vary substantially across regions within the state, and over the course of a PPA term. This is because crop prices vary significantly across different crop types and over time, impacting the opportunity cost of pumping water over the term of the agreement In contrast, FiTs are more likely to be held stable over long periods, potentially even over the life of the solarization PPA. Even if a fixed FiT is sufficient to conserve water today, it may be insufficient to prevent future water overextraction.
Rajasthan’s groundwater crisis necessitates careful consideration and mitigation of the risks posed by solarization. Rajasthan’s agriculture relies on groundwater, and Rajasthan’s groundwater supply is among the most depleted in the world.105 Water scarcity already impacts livelihoods and farmers’ welfare.106 The risk of exacerbating these effects cannot be ignored.
GoR should consider legal, regulatory options for pairing solarized irrigation systems with price signals and/or benefit transfers that motivate groundwater conservation. Metering and consumption-based pricing of electricity have long been proposed as a solution to over-extraction and have been implemented in West Bengal and Gujarat, where 85 percent of agricultural connections are now metered.107 These policies can conserve water by eliminating farmers’ access to near-zero marginal cost electricity and increasing the marginal cost of water extraction. A study in northern Gujarat found
38
that pump owners with metered connections used 30 percent less water per unit of area than owners with flat rate tariff connections.108
Another possible policy is to provide direct benefit tariffs to farmers. In this scheme, farmers are offered a direct payment to conserve electricity. In a recent study in Punjab, farmers were given a fixed amount of free electricity, but were offered a payment of ₹4 per kWh tariff to conserve electricity and thus to limit groundwater extraction. Preliminary results show groundwater savings in the range of 12 to 30 percent.109
GoR could also consider implementing water conservation training for farmers in conjunction with solarization. The Foundation for Ecological Security, an NGO, has had success working with rural communities in southeastern Rajasthan on communal crop selection and groundwater management.110
A “drought premium,” or temporary increase in FiT triggered by draught, can be utilized to incentivize water conservation for solar pump owners in times of extreme scarcity. This policy could disincentivize farmers from irrigating during particularly critical times and shelter them from the full blow drought would otherwise deal to their incomes.111 However, this mechanism is essentially a temporary adjustment of the FiT, and regulators may thus have difficulty calculating the appropriate rates in a given place or time.
Given unknown and potentially severe risks to Rajasthan’s groundwater, policymakers should prioritize solarization schemes that provide future flexibility to implement concurrent water conservation policies and regulations. For example, solar feeders could provide more flexibility than solar pumps to implement water metering and pro rata tariffs, since consumers are not also the owners of generation equipment. Direct benefit transfers and farmer training may be equally viable under either scheme, but other policies such as electricity rationing may also be difficult to implement if farmers own their own grid-connected pumps. GoR should ensure its chosen solarization technology does not interfere with its strategy for managing groundwater - whether that strategy is direct benefit transfers, pro rata tariffs, farmer training, or something else.
39
VI. ROLLOUT FEASIBILITY
Having established the major advantages and disadvantages that solar feeders might have over solar pumps, and vice versa, it is critical also to know whether either model for solarization can actually be implemented. In Rajasthan, the most obvious barriers to implementation are potential bottlenecks in the supply chain; namely, the supply of capital, hardware, and support services. Waste management is not currently reflected in the KUSUM guidelines, or anywhere in India’s central planning. Though not an immediate threat to rollout, waste management is a critical element of the infrastructure life-cycle that should not be forgotten.
SUPPLY OF CAPITAL
Implications: Scaling Up Solar Feeders
The discounted cashflow analysis presented in this section estimates total capital investment capital that must be mobilized for full penetration of Rajasthan’s solar feeder capacity. “Full penetration” is defined as the 6,121 MW of identified capacity if solar feeders are limited to a maximum size of 2 MW (as identified by RREC and noted in KUSUM A tender documents). Figure 7 illustrates the investment capital mobilized over time to reach 6,121 MW of solar capacity by 2030, 2040, and 2050, respectively. Overall, the longer the rollout, the lower the required capital investment in real terms. This is largely due to the assumption of falling module and panel costs over time and discounting of expenditures that can be delayed. While based on historic trends, these cost reductions are not guaranteed. Rollout by 2040 of the 6,121 MW capacity would require ₹15,642 of developer capital.
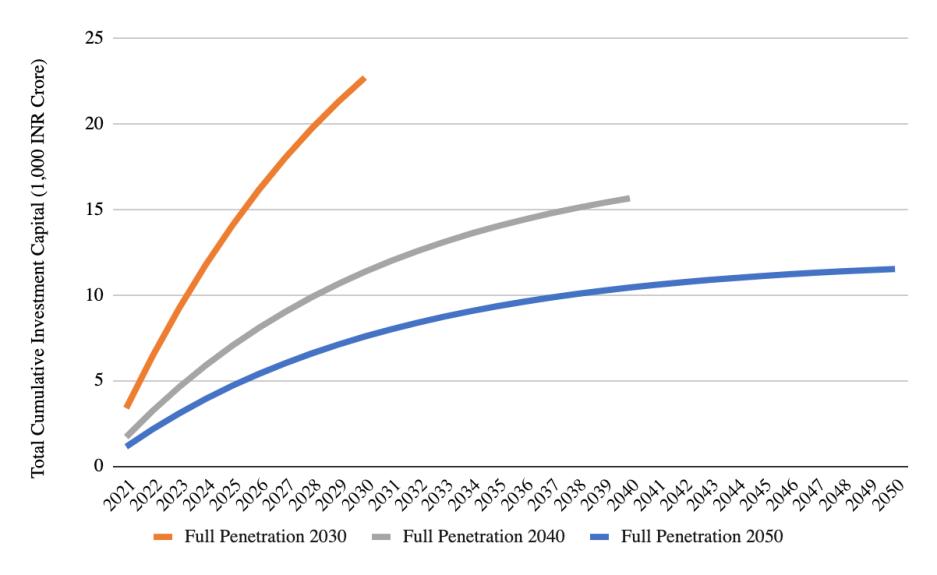
40
Figure 7: Total Cumulative Investment Capital Mobilized Over Time, KUSUM A (6,121 MW) (2020 ₹ crore) The scale-up analysis for solar feeders under KUSUM A demonstrates the impact of different scale-up paces on the total investment capital to developers. Quicker timetables substantially increase the total real expense to developers.
If full penetration of 6,121 MW were achieved via net-metered pump solarization by 2040, the total cost of the 60 percent subsidy Governments of India and Rajasthan are committed to provide would be about ₹13,767 crore. This implies a total capital cost for the project of ₹22,945 crore, much higher than the ₹15,642 crore provided under KUSUM A.
SUPPLY OF PV HARDWARE
Because of the domestic content requirement (DCR) for all solar cells, solar modules, and balance of systems used in KUSUM projects, short supply of any of these component or holdups at any point along the supply chain could constrain Rajasthan’s ability to achieve its KUSUM targets. Supply chain challenges may be especially pronounced if KUSUM accelerates quickly and Rajasthan is forced to compete with other states for access to indigenously manufactured components. This analysis considers how changes in supply chain capacity growth or prioritization of KUSUM in Rajasthan could impact GoR achieving its KUSUM targets.
Growth Scenarios
Given India’s currently limited manufacturing capacity of solar cells and solar modules (3 and 11 GW per year, respectively) these components pose a potential source of supply-chain constraints on the way to meeting KUSUM targets. To evaluate that risk, low, medium, and high growth scenarios for domestic solar cell manufacturing capacity were analyzed:
• Low Growth: 5 percent annual growth
• Medium Growth: 2 GW annual growth
• High Growth: 5 GW annual growth
The 5 percent growth scenario was used as the low-growth scenario because it achieves significantly less manufacturing growth than is expected based on over 10 GW of existing and upcoming solar cell manufacturing contracts in India while setting a useful baseline for comparing other, more ambitious scenarios.112,113,114 The 2 GW/y and 5 GW/y growth scenarios denoted as medium and high-growth respectively, are based on these existing and upcoming manufacturing contracts, as well as reports from MNRE and other authorities assessing growth potential in the domestic solar manufacturing sector. 115,116 Of particular importance for Rajasthan was also an August 2020 announcement by ReNew Power of their intent to set up 2 GW of solar cell and module manufacturing in Rajasthan which would be the first solar cell manufacturing plant in the state.117 Additionally, in November 2020, GoI approved a financing package that included over ₹45 billion for investment over five years to support the domestic development of high-efficiency PV modules, further indicating GoI’s priority for expanding its domestic PV manufacturing capacity 118
41
Access Assumptions
There are deep uncertainties regarding how much access to domestic manufacturing capacity Rajasthan will have and of that capacity, how much they will allocate toward KUSUM projects. Thus, wide bands of uncertainty are used to identify how sensitive GoR’s ability to implement KUSUM projects is to their access to domestic manufacturing constraints.
• Assumption 1: 30 percent (+20/-10 percent) of Indian-wide domestic manufacturing capacity will be accessible to Rajasthan Because schemes like KUSUM are implemented at the State level, and States like Rajasthan have set their own independent solar power targets, it is likely that state boundaries will play a role in how much access GoR has to India’s overall domestic solar cell manufacturing capacity. According to MNRE, Rajasthan accounted for approximately 30 percent of all newly installed solar power capacity across India in the last 2.5 years.119 Rajasthan’s overall solar power target (30 GW) is also 30 percent of the national target (100 GW). Lastly, as discussed earlier, there is a current proposal to build the first-ever solar cell manufacturing plant in Rajasthan with 2 GW of manufacturing capacity.120 Thus, this analysis assumes Rajasthan will have access to roughly 30 percent (+20/-10 percent) of Indian-wide domestic manufacturing capacity.121
• Assumption 2: 70 percent (+/- 20 percent) of the domestic solar cell capacity Rajasthan has access to will be directed toward KUSUM projects. There are currently three Indian-wide solar programs with a DCR for PV cells, of which KUSUM’s 30.8 GW target comprises 70 percent of their combined target 122,123,124 Because Indian-manufactured solar cells are typically more expensive than imported solar cells, it is unlikely that projects with DCRs for solar cells will have to compete for these products with other projects without DCRs, since these other projects can utilize less-expensive imported solar cells.125,126
Based on these assumptions and their associated sensitivity bounds, every GW of increased Indian solar manufacturing capacity would supply Rajasthan with 100 MW of new KUSUM projects in lowaccess scenarios, 210 MW in medium-access scenarios, and 450 MW in high-access scenarios
Results
Domestic content requirements may constrain India’s ability to achieve its KUSUM targets. To consider the impact of DCR on KUSUM projects across all of India, the three growth scenarios were analyzed in conjunction with how much GoI might prioritize KUSUM projects compared to other DCR PV projects (Assumption 2 above). Figure 8 displays the cumulative potential domestic solar cell manufacturing in India over time and shows that Indian domestic solar cell manufacturing could be a constraint for GoI to achieve its 30.8 GW KUSUM target by the end of 2022. Of the growth scenarios considered, even the high growth scenario with a high priority of KUSUM projects fails to achieve sufficient capacity to meet India’s KUSUM targets. Despite the possible constraint on GoI achieving its KUSUM goals, however, GoR’s targets could be more achievable
42
8: Cumulative Potential Domestic Solar Cell Installed in India
This graph displays the potential cumulative quantity of domestically manufactured solar cells in India over time. The scenarios vary based on two uncertainties: domestic manufacturing capacity growth rate for solar cells, displayed as low (5 percent growth), medium (2GW/year), and high (5GW/year) growth rates varying in color; and how much India’s will prioritize utilizing this domestic output for KUSUM projects vs. other DCR projects, displayed as low (50 percent, medium (70 percent), and high (90 percent) priority varying in line type. India’s KUSUM target of 30.8 GW by the end of 2022 are shown in black dashed lines. All scenarios start at the current annual domestic manufacturing capacity for solar cells of 3 GW and grow assuming all manufacturing capacity is fully utilized year over year. The figure demonstrates that even a high growth scenario that highly prioritizes KUSUM projects may fail to achieve India’s KUSUM target by the end of 2022.
Domestic content requirements should not constrain Rajasthan’s ability to achieve KUSUM targets. Figure 9 displays the cumulative potential installed KUSUM capacity in Rajasthan over time. This figure suggests two findings: First, that lower domestic manufacturing growth and constrained access to that domestic output delay Rajasthan from reaching its 4 GW DG target; and Second, despite delays, only in the low-growth with low-manufacturing access scenario does Rajasthan fail to install 4 GW by 2025. Acknowledging the uncertainties involved in Figure 9, so long as India grows domestic PV manufacturing by a modest rate of at least 2 GW annually, or Rajasthan receives access to at least 210 MW of every 1 GW of India’s PV manufacturing capacity that the state utilizes for KUSUM projects, the industrial supply chain is not likely to constrain implementation of KUSUM in Rajasthan. Even considering the most ambitious timeframe for reaching a full penetration of 6,121 MW by 2030, as discussed in the previous section, the industrial supply chain is not likely to be a serious constraint.
43
Figure
0 5 10 15 20 25 30 35 40 45 50 2021 2022 2023 2024 2025 2026 2027 2028 2029 2030 P o t e n t i a l I n s t a l l e d C a p a c i t y i n I n d i a ( G W ) Low Growth, Expected Priority Medium Growth, Expected Priority High Growth, Expected Priority Low Growth, Low Priority Medium Growth, Low Priority High Growth, Low Priority Low Growth, High Priority Medium Growth, High Priority High Growth, HIgh Priority High Growth Medium Growth Low Growth
Figure 9: Potential Cumulative Installed KUSUM Capacity in Rajasthan
This graph displays scenarios for the potential cumulative installed capacity of KUSUM projects in Rajasthan over time. The scenarios vary based on two uncertainties: domestic manufacturing capacity growth rate for solar cells, displayed as low, medium and high growth rates varying in color; and Rajasthan’s access to India’s domestic manufacturing capacity that the state utilizes for KUSUM projects, displayed as low, medium, and high access varying in line type. Rajasthan’s DG target of 4 GW by the end of 2025 are shown in black dashed lines. The graph demonstrates that only with low-growth and low-manufacturing access may Rajasthan be constrained to reach its 4 GW DG target by the end of 2025.
SUPPLY OF PV SUPPORT SERVICES
Beyond PV hardware, rapid PV deployment relies on routine labor and technical skill that all levels of government would do well to cultivate. That said, this report finds no evidence that a lack of support services would badly constrain Rajasthan’s prospects for solarization of irrigation pumping.
Solar feeders can demand very much, or very little of farmers. If Rajasthan wants only to provide farmers cheaper, more reliable electricity and water, solar feeders do so without explicitly demanding any development input from farmers.127 Excluding farmers places the burden of design, construction, operation, and management with specialized actors; namely, Discoms and private developers. Where feeders are owned by farmers or by farmer cooperatives, service challenges increase dramatically, as untrained farmers must double as developers, business planners, and construction foremen. Though this model gives farmers maximum ownership over power generation, without support from NGOs, it is rarely entertained.
44
0 1 2 3 4 5 6 7 8 9 10 2021 2022 2023 2024 2025 2026 2027 2028 2029 2030 P o t e n t i a l C u m u l a t i v e I n s t a l l e d K U S U M C a p a c i t y i n R a j a s t h a n ( G W ) Low Growth, Low Access Low Growth, Medium Access Low Growth, High Acess Medium Growth, Low Access Medium Growth, Medium Access Medium Growth, High Access High Growth, LowAccess High Growth, Medium Access High Growth, High Access High Growth Medium Growth Low Growth
Solar pump purchases offer farmers comprehensive coverage. If Rajasthan insists on preserving farmers’ ability to sell electricity to the grid, grid-connected, solar pumps provide this capability and, fortunately for farmers, can be installed under KUSUM with extensive support from the implementing agency. Following installation, maintenance needs are met for a limited time by warranties and annual maintenance contracts (AMCs):
Annual Maintenance Contracts (AMCs) cover pump operators’ short-term service needs.
Vendors bidding under KUSUM C must have AMCs for at least five years, establishing service centers and customer helplines in all client communities. 128 Staff must speak local languages and respond to calls quickly: In Rajasthan, vendors must rectify breakdowns within three days of a complaint.129 This rapid-response service enables Discoms in Rajasthan to ensure an 18 percent capacity utilization factor (CUF) for all solar pumps, compensating users for any shortfall at a rate of ₹7.00/kWh.130
Comprehensive maintenance coverage reduces risk and uncertainty for farmers at least during their first five years with solar pumps However, with PV systems intended to last several decades, farmers must eventually maintain systems themselves. As such, MNRE requires vendors to train locals in longterm upkeep.131 Publicly available RFPs mention this requirement only in passing, however, directing contractors to “provide training to the locals” without further specifics.132
Warranties cover pump operators’ medium-term service needs.
Vendors like Adani normally warranty panels against assembly defects for ten years and performance deficiencies for twenty-five years.133 Inverters, likely the most maintenance-prone components of PV systems, are usually warrantied for five years.134 However, warranties are only as good as the vendors that offer them. If a manufacturer becomes insolvent, uninsured warranties cease to exist, leaving buyers to inherit all performance risk.
If MNRE expects farmers to develop, own, and operate solar feeders, accessible training must be offered to hone requisite skills As a State Nodal Agency (SNA), Rajasthan Renewable Energy Corporation Ltd. (RRECL) is required to assist farmers with “project development activities including formulation of DPR, PPA/EPC contracts, getting funds from financial institutions, etc.”135 RRECL trainings apparently target vendors, however, and as such neglect farmers’ gaps in business planning, system design, etc.136 SNAs do coordinate with the National Institute for Solar Energy to administer “Suryamitra” trainings in both maintenance and entrepreneurship. Rajasthan has nineteen Suryamitra centers and plans to graduate 2500 technicians over five years.137, 138 While its syllabus is quite thorough, the Suryamitra program is unfortunately ill-suited to farmers. First, Suryamitra is a 600-hour residential program which, though free, would take farmers from fields for inordinate lengths of time. Second, eligibility is restricted to Indian Technical Institute graduates and diploma-holders,139 a condition most farmers aren’t likely to meet.
Augmenting government trainings are institutions like Amity University, Jaipur, which charges ₹3 lakh for a master’s degree in Solar and Alternative Energy 140 These programs are also out of reach for most
45
farmers, but are nonetheless necessary to equip the small, but essential pool of engineers and specialists who must (among other tasks) engineer solar feeders. At the other end of the spectrum are nonprofits like the widely respected NGO Barefoot College, whose headquarters in Tilonia, Rajasthan has already been solarized by program graduates.141 These “Solar Mamas” women and girls often sidelined from development schemes might well be employed to install and maintain Rajasthan’s fleet of solar PV, just as Barefoot College might be recruited to train locals in entrepreneurship, financial planning, and other “soft” skills required to develop feeder installations.
Although farmers will not need training in most routine tasks, GoR should train them in water management and crop selection. With both solar feeders or solar pumps, many jobs require little to no training, such as panel cleaning. Feeder installations might be dusted or hosed every month or so, with greater or fewer cleanings as local conditions demand. Spot-checks using infrared cameras can occur as infrequently as once or twice-annually, with only rare tasks (circuit breaker maintenance, transformer refilling, etc.) potentially requiring outside assistance.142 Where assistance is not provided under warranties or annual maintenance agreements, it would not be hard for several installations (or many farmers with solar pumps) to share in the hiring of one itinerant technician.
The GoR should instead ensure that training efforts are focused on areas where farmers are currently underprepared, including communal water management and selection of water-sensitive crops. Even simple information-sharing interventions have proven effective at conserving water in other parts of India, and initiatives like the Foundation for Ecological Security’s Water Commons Project provide templates for how more advanced trainings might be organized.143, 144
WASTE MANAGEMENT
India currently has no central plan for PV disposal and recycling, but with 100 GW of solar ostensibly on the way (and over 30 GW from KUSUM alone), time is running out to make one. The Energy and Resources Institute (TERI) estimates over 100,000 tons of PV waste will accumulate over just the next two years, much of it toxic, and much of it carcinogenic.145 Disposing and recycling this waste requires a suite of services not yet incorporated into the supply chain, including panel disassembly, combustion, and etching (the process whereby recyclable glass and metals are recovered).
Rajasthan stands to bear the brunt of this waste issue, given its high prospects for solar development, and should thus encourage investment in a national waste program. The central government ought to embrace this challenge, as an abundance of recycled components would make it easier to satisfy DCRs in solarization schemes currently limited by scarce domestic supply. TERI identifies silicon, cobalt, germanium, and lithium as only the most critical minerals that might be recovered 146
46
VII. SECONDARY EFFECTS
EMPLOYMENT
A 2014 survey from the Natural Resources Defense Council (NRDC) found that solar plants the size of those proposed in Rajasthan (about 1 MW) generated the following direct employment:147
To determine actual solar job market numbers, NRDC and the Council on Energy, Environment, and Water (CEEW) developed a questionnaire for solar PV power plants. (Source: NRDC 2014).
These results suggest that for every megawatt of solar capacity installed, 82 jobs (Column A) equal to about thirteen full-time positions (Column D) will be needed for Business Development, Design and Pre-Construction, and Construction and Commissioning. Further, ten jobs (Column E) equal to about 3.5 permanent, full-time positions (Column F) will be needed for Operations and Maintenance every year post-installation. As Rajasthan has plans to install 4 GW of distributed power by 2025, one should expect 52,000 short-term FTE jobs (which would all disappear after 2025) and 14,000 permanent FTE jobs/year thereafter if targets are met. About 80,000 short-term FTE jobs and 21,500 permanent FTE jobs/year would be expected in a full penetration scenario of 6,121 MW. Most permanent jobs would be unskilled (groundskeepers, line tenders, etc.), offering gainful employment opportunities to women and youth who would otherwise be excluded from the labor force 148
Because farmers are the owner-operators of their own solar pumps, the solar pump model should not generate the same level of employment as the solar feeder model, which would demand more in terms of engineering, construction, and long-term operations.
47
Short-Term Phase A: Median Jobs Required B: Median Duration/Job C: Med. Person Days/MW D: Median FTE/MW Business Development (Skilled) 5 75 days 99 0.38 Design/Pre-Const. (Skilled) 7 90 days 142 0.55 Const./Commissioning (Skilled) 20 120 days 980 3.77 Const./Commissioning (Unskilled) 50 100 days 2,200 8.46 Long-Term Phase E: Median Employees/Yr. F: Median FTE/MW/Yr. Operations/Maint. (Skilled) 3 1.20 Operations/Maint. (Unskilled) 7 2.31
Table 6: Solar Plant Job and Employment Creation
NRDC’s questionnaire did not concern jobs created from manufacturing and other solar applications, both of which might be considerable in Rajasthan: ReNew Power’s 2,000 MW manufacturing facility should, per the company’s press release, create roughly 2,000 jobs.149 Other indirect jobs would likely come with solarization, including meter readers and a variety of business service positions. However, should solarization have detrimental effects on the water supply, indirect job losses in the agriculture sector might counteract some of these gains. An robust and comprehensive of solarization’s total employment potential must include this caveat.
EQUITY
Because KUSUM targets farmers, it inherently serves some of Indian’s most vulnerable people. Yet even with this goal, it is possible that KUSUM could exacerbate inequalities in agricultural areas rather than relieving them. As a state where the majority of the population depends on agriculture for their livelihoods, this is especially vital to consider in the context of Rajasthan. For solar feeders, the main risk to equity is unequal water usage, while for solar pumps the initial barriers to entry (land ownership, capital to invest in pumps of qualifying size, and awareness of the scheme) pose obstacles marginalized groups may not be able to overcome.
Disadvantaged Groups and Access to KUSUM
While previous sections of this report discussed various risks and benefits to farmers participating in KUSUM, this section focuses on farmers who are likely to be excluded from the program entirely. They fall into several categories:
• Those who do not own land. Out of the 40 million agricultural workers in Rajasthan, about 40 percent are landless.150 In recent years the portion of landless farm workers has grown across India as small farmers faced with shrinking livelihoods are forced to sell their land.151 Landless farmers cannot benefit from land lease-related income, and as they tend to be more financially distressed than larger farmers, are less likely to be able to invest in solar pumps. As discussed, if the FiT is set high enough that participating farmers will sell back to the grid and barely participate in the informal water exchanges, landless farmers who depend on these water markets will stand to lose water access. However if water usage is well-managed the increased irrigation and more productive farms brought about through solarization could lead to more employment for landless workers.
• Those who do not own pumps. Small and marginal farmers, who constitute almost 60 percent of Rajasthan’s total land area, rarely own electric pumps.152 They irrigate either by purchasing water from their neighbors or by renting diesel pumps. These farmers are concentrated on the lower end of both the income scale and caste hierarchy and tend to have smaller landholdings. They may not stand to benefit from KUSUM and may interact with the scheme only indirectly, through its impacts on informal trading, and prices paid for that water.153
48
If the FiT is set too high for grid-connected pumps, KUSUM may drive up water prices and reduce water access for those without pumps This is because farmers may reap greater profits from selling electricity to the grid rather than selling water to neighbors. Though only a small proportion of farmers are eligible for KUSUM, a much larger proportion will experience a change in welfare through the scheme’s effects on water.
• Those with pumps higher than 7.5 HP Among farmers in Rajasthan who own electric pumps or other forms of tubewell or surface lifting water devices, most own devices over 7.5 HP. Other states’ experience suggests group pump ownership offers beneficial opportunities for farmers by coordinating purchases of 70-80 HP pumps, with strength scaled up in accordance with the depth of the local water table. A joint ownership arrangement would allow these farmers to buy pumps and access groundwater previously unreachable to them independently However, under current KUSUM guidelines, small farmers participating in these informal groups may be left out because of the program's upper limit on pump capacity.
• Those who don’t know about solar pump programs. While research on farmer awareness of solar schemes is still being conducted, a 2018 study in Uttar Pradesh showed that just two percent of farmers were aware of government programs to support solar pumps.154 KUSUM might well be advertised to the public, but, male and female literacy rates in Rajasthan hover around 80 percent and 52 percent, respectively 155 Building awareness through demonstration pumps will thus be critical to reach a broader audience. Those who see a solar pump in action and come away with a favorable impression are twice as likely to adopt the technology, which could significantly improve take-up 156
• Historically marginalized groups. Tribal communities, which comprise a sizeable 13.5 percent of Rajasthan’s population, struggle to access groundwater for irrigation and have historically been left out of government schemes.157 158 Targeting access for Scheduled Castes (SC), Scheduled Tribes (ST), and Other Backward Castes (OBC), while implementing KUSUM might be difficult to do in a universal scheme like KUSUM rather than a demographic or income-based one. In light of this, unequal distribution of landholdings and wealth in Rajasthan mean that these marginalized groups are unlikely to benefit from KUSUM due to the points outlined above, unless GoR targets inclusion of these groups.
In summary, those with lowest socioeconomic status, caste, and educational attainment are the least likely to benefit from KUSUM. Despite still being at the mercy of informal water exchanges, several changes could help address these issues for farmers without land or pumps:
• Prioritize and market to disadvantaged communities. To ensure the scheme has the most inclusive reach possible in Rajasthan, KUSUM’s rollout should prioritize the solarization of feeders serving predominantly marginalized farmers and conduct awareness-building outreach to the same. This prioritization should be done in consideration with other important factors such as financial feasibility and water conservation.
49
• Rethink restrictive limits on pump size. The national government could consider revising program guidelines to allow pumps smaller than 3 HP and pumps larger than 7.5 HP that are operated by groups of small farmers.
Water Access
In the short-term, solarization could provide marginalized groups with increased access to irrigation water in areas with established informal water-trading. Greater daytime electricity increases water supply, which could enable pump owners to maintain their current usage while selling surplus water, increasing the amount available to marginal farmers to buy for irrigation. This might lower water costs and increase benefits to water buyers.
However, if solarization increases local groundwater extraction, the ensuing water scarcity will be worst for the most marginalized. Those with larger pumps, or the ability to purchase them, may weather scarcity better because they will be able to access water even as resources dwindle. As a result of that, the market power of those farmers within informal groundwater exchanges will grow as the number of water buyers increases, meaning buyers may face the choice of paying exorbitant prices or losing access to water, and poorer farmers would see the sharpest declines in their production.159 Because groundwater access is a buffer against frequent droughts in Rajasthan, those without reliable access will be more susceptible to short-term natural climate variability (e.g. failed monsoons), as well as long-term climate change. This renders them more vulnerable to food and drinking water shortages and is linked to malnutrition and distress migration in rural Rajasthan.160 Adequate groundwater management as a part of solarization is therefore critical to avoid exacerbating inequality in agricultural communities
50
VIII. CONCLUSIONS AND RECOMMENDATIONS
LOGIC OF SOLAR FEEDERS, PUMPS
This report set out to assess the costs and benefits of solarized irrigation for stakeholders in Rajasthan; namely, farmers, Discoms, and state government. It sought to explore the nexus between the supply of electricity and pumping of scarce groundwater. It focused on the Government of India’s KUSUM agricultural solarization scheme to assess whether solar feeders (as modeled by KUSUM A and C) or solar pumps (as modeled by KUSUM C) meet KUSUM objectives: reliable power supply to farmers, increased farmer incomes, relieved state and Discom financial burdens, or groundwater conservation Judgements were made, where possible, as to which path generated the most benefits and, thus, was more attractive for future investment.
This report concludes that, under the current design of solarization schemes in Rajasthan:
• Solar feeders are more likely to attract private capital than solarized pumps. As it stands, the ceiling tariff for solar feeders is likely high enough to invite private developer investment. The break-even tariff is lower for KUSUM C feeders than KUSUM A feeders.
• Solar feeders have greater potential to raise farmer income than solar pumps. Analysis finds that current solar pump feed-in-tariffs are too low to benefit farmers selling power back to the power grid. Unless tariffs or subsidies for solar pumps are raised, solar feeders will offer farmers greater income through land leases to feeder developers.
• Anticipated Discom savings are similar with solar feeders and pumps, but pumps’ benefits are more uncertain. Cashflow analyses in this report reveal that with solar pumps, Discoms’ savings erode as farmers sell more electricity to the grid. Furthermore, tariffs cannot be raised to benefit farmers without depleting Discom savings.
• Solar pumps are slightly more likely to reduce state subsidies than solar feeders. Accounting for initial capital subsidies, solar pumps will likely yield modest net savings for the Government of Rajasthan over 25 years, compared to solar feeders, where relief hinges on tariff correction (and, thus, is more uncertain).
Taken together, these points tend to favor solar feeders over solar pumps. Benefit-cost analysis shows that while state coffers benefit slightly more from solar pumps than solar feeders, whose state benefits depend on tariff rates, farmers likely benefit more financially from solar feeders (via leasing incomes) than solar pumps that is to say, under the current subsidy regime outlined in the KUSUM guidelines and current feed-in-tariffs offered by RERC, solar pumps are a less viable model for agricultural solarization in Rajasthan.
51
Herein lies a conflict: Tariffs are too low for farmers to benefit from solar pumps, yet raising tariffs erodes Discom savings. Given that Rajasthan’s Discom debt has recently tripled and the distribution sector poses an increasing risk to state banks, rescuing Discoms is as crucial a task as improving farmer welfare. Thus, the cost of higher feed-in-tariffs would likely need to be borne by the state, not Discoms. Whether Rajasthan pursues these subsidies depends on which KUSUM objectives it prioritizes, and whether it feels solar pumps are a viable model of achieving them.
Less clear is the outlook for groundwater. Backers of solar feeders and solar pumps both contend that their preferred model will not accelerate depletion of India’s falling groundwater table and in some cases, may even reverse the trend. Despite the hopes many have that solarization will help to resolve Rajasthan’s groundwater problem, there is insufficient evidence to suggest either scheme will achieve this goal. Furthermore, there is some evidence to imply solarization could increase pumping and make the problem worse. Given these potentially negative impacts on water and rural livelihoods, Rajasthan should proceed cautiously with implementing KUSUM.
BARRIERS TO ROLLOUT
Assuming either solar feeders or solar pumps could become economically viable, this report sought to to find where, if anywhere, bottlenecks would prevent rollout from happening. Acknowledging the uncertainties involved, sensitivity analyses performed as part of a broader supply chain analysis imply that despite domestic content requirements requiring domestic production of all solar components, Rajasthan should be able to meet its goal of 4 GW distributed power by 2025.
However, significant resource barriers exist to prevent the KUSUM scheme from being implemented exactly as intended in its founding guidelines. For instance, the guidelines prefer that solar feeders be developed and operated by farmers, an extremely difficult task for people who typically have neither the skill nor experience to, say, organize cooperatives, formulate business plans, oversee construction, or delegate the necessary tasks to keep a plant running for decades. These deterrents, not to mention farmers’ general lack of collateral, should be attended to with training programs and dedicated support services if GoI is serious about retaining this modality Support services should additionally provide communal water management training and crop selection exercises for farmers regardless of whether they develop solar feeders. Failure to address critical skills gaps will inevitably hinder KUSUM’s implementation in Rajasthan.
One vital service not reflected in the KUSUM guidelines is waste management. With massive amounts of PV waste certain to result from KUSUM, and with so much of it hazardous to human health, wastes should be controlled and potentially recycled to help manufacture panels in the future. Doing so might even relieve pressure on manufacturers to meet domestic content requirements, since recycling could displace the need for raw materials that are currently accessible only from foreign markets. As a likely candidate for continued solar development, Rajasthan should develop internal protocols for waste management and encourage a broader, national strategy for the same.
52
SECONDARY EFFECTS
Rajasthan rests on a sensitive environmental, social, and political balance that threatens to be disrupted if the implementation of KUSUM produces unintended and detrimental consequences. The most immediate concern for many farmers is whether KUSUM is even accessible to them. Grid-connected, landholding farmers are the likeliest to benefit from KUSUM immediately, and these farmers normally have more wealth and come from higher social castes. Rewarding already-advantaged farmers visà-vis their marginalized peers and neighbors might serve to deepen social divides.
Politically, both major parties in Rajasthan have often used the protection and provision of agriculture subsidies as rallying cries and vehicles for influence, respectively. KUSUM pump solarization proposes to substantially reduce subsidies, which would no longer be needed given farmer self-generation built into the scheme. What happens when this leverage source is no more? Will political leaders be inclined to attack or defend KUSUM based on its performance? While these consequences are, of course, not certain, KUSUM might disrupt Rajasthan’s existing political order.
RECOMMENDATIONS
With these risks and opportunities in mind, this report recommends the following:
• Explore legal, regulatory, and policy mechanisms that would position solarization to incentivize groundwater conservation. Rajasthan should explore direct benefit transfers to reward farmers who conserve water, especially in areas served by feeders. Supplementing this program ought to be accessible trainings in crop selection and communal water management. Alternatively, legal reforms might be pursued to impose costs on the overuse of groundwater, or costs and benefits might be imposed simultaneously. Options to incentivize water conservation could also include consumption-based pricing of electricity in the case of solar feeders and increased feed-in tariffs for solar pumps.
• Focus implementation on solar feeders, which seem to offer more benefits for farmers and developers; less risk for Discoms and GoR. Rajasthan could also explore higher state subsidies to make solar pumps viable for both farmers and Discoms. Analysis in this report suggests the solar pump model will not be viable for farmers unless the tariff is increased to ₹9.91/kWh, which is higher than Discoms’ already unsustainable average cost of supply. While a higher feed-in tariff may raise farmer incomes and mitigate water risk by increasing benefits for conservation, Discoms would lose money on the scheme.
• Raise the upper limit on solar feeder installation capacity. The current 2 MW maximum does not allow solar feeders to meet the full agricultural demand in most cases. Based on the distribution of connected agricultural demand in Rajasthan, only 60 percent of the substation loads are below 2 MW based on Rajasthan’s sizing criteria. Increasing the upper limit could
53
enable Rajasthan and its Discoms to maximize cost savings from the scheme, by supplying a greater share of agricultural load with lower cost power.
• Develop an initial, small-scale rollout of the KUSUM scheme to collect empirical data on the scheme’s impacts on groundwater extraction for the purpose of evaluating and mitigating water-related risks. It is unclear how electricity offered by solar feeders and solar pumps will change farmers’ water usage. To avoid possibly dire consequences of groundwater depletion, KUSUM should be scaled up as methodically as the need for rapid solarization will allow, and policies like drought premiums should be explored to control irrigation at sensitive times. If able, Rajasthan should track groundwater usage with direct pumping measurements where the scheme is being deployed. This small-scale rollout can also be used to measure other key uncertainties, such as impacts on farmer incomes and Discom finances.
• Deploy KUSUM in ways that affirm the inclusion of marginalized groups. The current KUSUM scheme design does not include specific provisions to ensure small and marginalized farmers can access its benefits. Groups of concern include those with pumps outside the sizing guidelines, or no pumps at all. To ensure all farmers share in the opportunities afforded by this ostensibly universal scheme, feeders in areas with high proportions of marginalized groups should be prioritized going forward, and educational barriers to entry reduced.
By making proposed changes and avoiding identified mistakes, KUSUM can be an asset to Rajasthan’s economic development and India’s ambition to reduce CO2 emissions from the energy sector KUSUM’s potential to benefit farmers, Discoms, and state finances is evident, and is especially strong for solar feeders. Regardless of whether Rajasthan pursues solar feeders over solar pumps, all future investment must understand the societal implications of mass solarization, especially as they concern marginalized groups, political order, and Rajasthan’s uniquely tenuous environmental state. It is worth underscoring that this report does not show decisively that either solarization model advanced by KUSUM will reduce groundwater extraction, despite claims that it will. Expected economic benefits would be short-lived if scarce water was totally consumed, and as such, Rajasthan must proceed cautiously, take regular stock of its progress and make changes as needed. Balancing KUSUM’s grand ambitions with long-term sustainability will be critical for the scheme’s continued progress in Rajasthan.
54
IX. APPENDICES
APPENDIX A: PV SIZING
To assess how much capacity is required to enable solarization of agri-feeders and grid-connected pumps, as well as the energy subsequently generated for use and sale, this report uses data on locationspecific agricultural loads and estimates of local solar generation potential to determine the average capacity utilization factor (CUF) of PV systems under local conditions and the yearly energy available for use/sale under both KUSUM A and KUSUM C. Results of this analysis are used to inform:
1) A financial analysis of costs and benefits to farmers and developers participating in KUSUM
2) An assessment of KUSUM’s financial impact on Discoms with irrigation pumping loads
3) Estimates of the currently specified KUSUM scheme’s technical potential to meet statewide irrigation electricity needs
Data and Methodology
Agricultural Loads
Data on agricultural loads at substations across the state were taken from the Jaipur, Ajmer, and Jodhpur Discoms tender documents for KUSUM A. The comparable documents for KUSUM C provide the state’s estimates of the number of agricultural pumps of a given size that could be solarized within each Discom under the scheme.
PV Systems
Estimates of hourly solar generation and resulting capacity factors for fixed array solar installations during typical meteorological year across the state relied on calculations using the National Renewable Energy Laboratory’s PVWatts tool.161
• Feeders: PVWatts assumes 14.8 percent losses due to soiling, shading, light-induced degradation, wiring, and age to account for local conditions of use. in addition, the analysis for solarized feeders assumes 10 percent losses from moving the electricity from panel to substation.162
• Solar Pumps: Only PVWatts-derived 14.8 percent losses were included in these calculations, as proximity of the PV array to the pump under this scheme reduces distribution losses.
55
Pump Use
Estimates of actual hourly demand for electricity at the individual pump or feeder-wide level depend on farmer behavior and are likely quite variable. Due to lack of this data, this analysis studies a range of possibilities by assuming:
● For the scenario of solar pumps without net-metering, the pumps run whenever PV supply is at least 50 percent of what the pump needs
● For all other scenarios, the pumps run for four, six, or eight hours a day (centered around midday) at full load
● Pump use is not needed during monsoon months of July and August
Based on the agricultural load data, PVWatts analysis, and with the assumptions above, the PV sizing and generation scenarios were built in MS Excel for feeders and pumps (Link).
Results: Capacity utilization factor
Sampling across sixteen sites showed that the variation in CUFs across the three Discom regions was not larger than 3 percent (Table 7: Capacity Utilization Factors Across Jaipur, Jodhpur, and Ajmer Discoms) KUSUM A arrays yielded a CUF of roughly 21 percent based on power delivered to the substation. KUSUM C pumps yielded a CUF of approximately 23 percent.
The difference between solar feeder and pump CUFs result from the fact that electricity for solar pumps is generated at point of use and does not need to account for system losses in transmission from the local substation, as feeders do. Both CUFs are slightly higher than the 20 percent figure reported by the RREC and attest to robust generation potential within the region.
56
Parameter Discom Substation CUF (%) KUSUM A feeders Jaipur Hamidpur 20 KUSUM A feeders Jodhpur Bagora 21 KUSUM A feeders Ajmer Karkari 21 KUSUM C pumps Jaipur Jhalawar - 2 23 KUSUM C pumps Ajmer Banswara (III) 23
Table 7: Capacity Utilization Factors Across Jaipur, Jodhpur, and Ajmer Discoms
Results: KUSUM A Generation Potential
The current sizing guidelines for KUSUM constrain the size of the array to between 0.5 MW and 2 MW. Based on the KUSUM A array sizes tendered for pump use, Figure 10 shows the solar electricity generated as well as the residual grid electricity that farmers need to power their pumps for a range of four, six, and eight midday hours. Across all Discoms, even the four-hour irrigation scenarios show that KUSUM A generation (blue bars) meets less than half of pump electricity demand, indicating that under the scheme as currently specified there is relatively low solarization of agricultural load.
Figure
For each Discom, this calculation assumes an installed PV capacity equal to the sum of PV capacity allowed across substations and an installed peak agricultural load equal to the sum of peak agricultural loads across substations, both as enumerated in the KUSUM A tender document for each Discom163,164,165. For Jaipur, Ajmer, and Jodhpur, respectively, the sum of allowed PV capacities are 1.730, 1.761, and 2.631 million kWAC. The sum of installed peak agricultural loads are 4.419 million hp (3.292 million kWAC), 4.510 million hp (3.360 kWAC), and 9.311 million hp (6.937 million kWAC.)
Results: Net-Metered KUSUM C Generation Potential
KUSUM C with net-metering permits farmers to sell excess electricity to the Discom. Figure 11 shows the portion of PV electricity used to run pumps for four, six, and eight hours per day relative to the portion sold back to the Discom under three different generation scenarios: with PV array size (in kWAC) equal to 1, 1.5, and 2.0 times the installed pump capacity (in hp).
Guidelines for KUSUM C permit installations of capacity up to twice that of the connected pump, though recent analysis from the World Bank uses a more conservative 1.5 scale to account for the
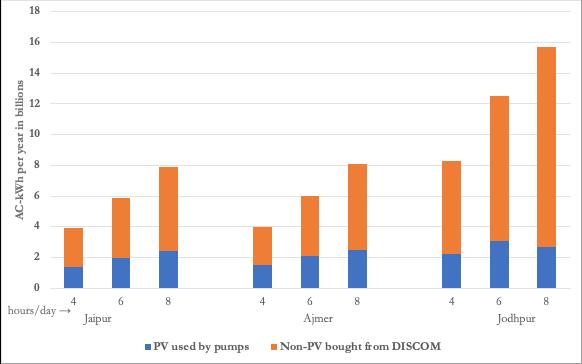
57
10: PV Generated and Purchased Under KUSUM A across each Discom for 4/6/8 midday hours each
financial constraints of farmers unable to purchase higher-capacity pumps, even using government subsidies. This analysis uses scales of 1, 1.5, and 2 to consider a range of financial capabilities
Figure 11 illustrates that for four-hour scenarios across Discoms, a higher portion of electricity is sold back to the Discom than with six or eight hours/day of pumping Figure 11 contrasts with Figure 10 in that a very high portion of the pumping load in the former is supplied by PV. Moreover, for KUSUM C pumps without net-metering, the only electricity available to pump is PV, so the entire pump load is met by PV. Changes to the KUSUM A feeder size limitations would therefore be needed to achieve the same level of solar PV input to the state’s agricultural electricity balance.
For four-hour scenarios across Discoms, a higher portion of electricity is sold back to the Discom vs. the six and eight hour scenarios. Results look similar across other Discoms as well. KUSUM C guidelines stipulate that the allowable installed PV capacity in kWAC is up to 2 times the installed pump capacity in hP. Correspondingly, the installed PV capacity assumed for each of the three scale factor cases in this diagram are 5, 7.5, and 10 kWAC, respectively.
58
Figure 11: KUSUM C Net Metering Scenarios With a 5 HP Pump in Jaipur Discom
APPENDIX B: DISCOUNTED CASH FLOW ANALYSIS METHODOLOGY
Net present value (NPV) is used to calculate the present value of cash flow over multiple years, by discounting future cash flows Project specific discounted cashflow models were built in MS Excel for Feeders and for Solar Pumps (Link).
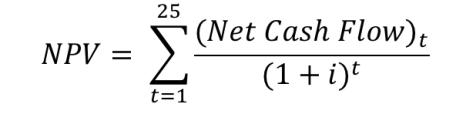
For Discoms, the discount rate is assumed to be 10 percent. For developers the discount rate was assumed to be 10.2%, and for farmers the discount rate is assumed to be 12.5 percent In the latter two cases the discount rate was based on WACC (weighted average cost of capital) (Appendix C). The lifetime of the solar photovoltaic (PV) system is assumed to be 25 years. The NPV formula is shown below, where �� is the discount rate.
KUSUM A and C Tender Documents
Under the KUSUM scheme, each of the Discoms in Rajasthan have released tenders for KUSUM A and C. In the KUSUM A tenders, the Discoms list all available substations to which agricultural load (HP) is connected, identify solar capacity (MW) for KUSUM A as 70 percent of the agricultural load, and state the available transformer capacity at the substation (MVA). All specified capacity values are between 0.5-2 MW, consistent with the KUSUM A design constraints. A summary table of the identified sites in KUSUM A are shown in Table 8.
Sources: RRECL Request for Selection (RfS) for KUSUM A Annexures166,167,168
Expected Deployment of KUSUM A
Based on the interest in bids under KUSUM A, the RRECL has increased the pilot deployment target until 2023 from the centrally allocated 325 MW to 725 MW.169 In addition, RRECL recently
59
Discom Number of Identified 33 kV Substations Total Agricultural Load at Identified Substations Total KUSUM Agricultural Solar Capacity (Identified by Discoms) # HP MW Jaipur 1,324 4,419,046 1,730 Ajmer 1,384 4,510,170 1,761 Jodhpur 1,611 9,311,013 2,631 Total 4,319 18,240,229 6,121
Table 8: Summary Table of KUSUM A Tenders
announced that the State Budget for 2019-2020 had set the target for KUSUM A at 2,600 MW by 2023, and tenders will be forthcoming.170 This is compared to the total solar capacity of 6,121 MW as identified in the KUSUM A tenders.
Expected Deployment of KUSUM C
In the KUSUM C tenders, the Discoms identify lots where grid-connected pumps can be solarized. As shown in Table 9, the identified lots include 60,008 HP of grid-connected agricultural load. In terms of MW, this load amounts to 44.7 MW. For each lot, the Discom tenders identify the number of the grid-connected pumps by size (3 HP, 5 HP, and 7.5 HP) and the total estimated cost for solarizing the lot.
In Rajasthan, all grid-connected electric pumps within a lot must be solarized, for farmers in that lot to be eligible for KUSUM C. As such, the 44.7 MW of agricultural load identified in the tenders are interpreted to reflect the expected KUSUM C deployment under the pilot scheme.
Pump Assumptions and Sensitivities
For both KUSUM A and C, the assumed average pump size is 5.0 HP, which is comparable to the weighted average pump size in the tenders for KUSUM C of 4.7 HP. To account for uncertainty in both the amount of daily pumping and hours of daily electricity availability, savings are estimated based on 4, 6, or 8 hours as the average daily hours of pumping. The annual hours of pumping per year are estimated assuming average daily operation, except for 62 monsoon days per year when it is assumed that pumping does not occur (for example, 8 average daily hours of pumping corresponds to 2,424 annual hours of pump consumption). The pump size and hours of pumping are used to calculate the electricity consumption per pump per year, as well as how many pumps would be able to be supported by the electricity generation. The current annual electricity consumption per pump per year is estimated by multiplying the average pump size (kW) by the assumed number of hours of pumping per year and assuming, in the absence of context-specific data on pump use characteristics, that the pumps run at their rated capacity during each hour of operation. For KUSUM A, the number of pumps supported is calculated by dividing the annual generation with the annual electricity
60
Discom Number of Identified 11 kV Substations Number of Pumps Total Agricultural Load at Identified Substations 3 HP 5 HP 7.5 HP # # # # HP Jaipur 119 270 4,057 2,040 36,395 Ajmer 92 4,616 1,093 165 20,551 Jodhpur 17 4 280 220 3,062 Total 228 4890 5,430 2,425 60,008
Table 9: KUSUM C Agricultural Load and Cost by Discom
consumption per pump. For KUSUM C, the number of pumps supported by the pilot solar capacity is assumed directly from the KUSUM C tender documents.
Solar generation assumptions
The solar generation assumptions are based on the PV Sizing and Generation methodology (see Appendix A). The capacity utilization factor (CUF) is assumed to be 21 percent for solar feeders in KUSUM A and C, and 23 percent for solar pumps in KUSUM C. In addition, the solar age degradation factor is assumed to be 1 percent per year. Based on the CUF and solar degradation factor, the annual generation in GWh is calculated as shown in the following equation, where 8,760 is the number of hours in a year.
Current cost of supply for electricity
Under the KUSUM schemes, the Discom savings are the cost of supply under KUSUM compared to the current cost of supply. For this analysis, the current cost of supply is estimated based on average costs and losses as reported in the Discoms’ latest annual tariff order, RERC Petition No. 1541/19, 1542/19, 1543/19 (RERC Discom Tariff Order)171, transmission wheeling charges as reported in Rajya Vidyut Prasaran Nigam Limited‘s (RVPN) latest annual tariff order, RERC Petition No. 1587/2020 (RVPN Tariff Order).172
For comparison with the feeder level schemes, the cost of supply is calculated for delivery to the 11 kV substation level. When comparing with solar pumps, the cost of supply is calculated for delivery to the pump. The cost components of the cost of supply of electricity includes the average power purchase cost (APPC), transmission wheeling charges, transmission and distribution losses to the 33 kV and 11kV substations.
The assumed average power purchase cost (APPC) for Discoms is ₹4.02/kWh, obtained from Table 100 of the RERC Discom Tariff Order. The per unit transmission charges are ₹0.28/kWh, from Table 69 of the RVPN Tariff Order. The state transmission losses and 33 kV wheeling losses of 7.15 percent and the assumed distribution losses from 33/11 kV substation to pump of 12.6 percent are from Table 19 of the RERC Discom Tariff Order.173 The yearly escalation of the APPC is assumed to be 0.50 percent
Based on these assumptions, the cost of existing grid supply at the 11 kV substation is calculated for the first year:
61
Based on these assumptions, the cost of existing grid supply at the pump is calculated:
Calculating Discom Savings
The savings to the Discoms associated with implementing KUSUM solar feeders is based on the difference between the cost of serving the agricultural load using grid electricity and cost of serving the agricultural load using solar generation. The per unit Discom savings are calculated for the first year, or t = 1, and the lifetime savings are estimated over 25 years of operation.
KUSUM A Solar Feeders
For KUSUM A, the per unit savings (₹/kWh) are calculated as shown:
The total annual savings represent the difference in cost between existing grid supply (₹4.63/kWh in Year 1) and the fixed price of solar power (₹3.14/kWh) for the total annual generation associated with 725 MW of solar capacity. The annual savings are estimated for each year of the 25-year lifetime, accounting for decreasing solar generation due to age-related degradation. A Performance-Based Incentive from the Government of India is estimated for the first five years of project operation. The PBI is valued at the lesser of either ₹6.6 Lakh/MW/year or ₹0.40/kWh/year. For Rajasthan, the ₹6.6 lakh/MW/year was estimated as being marginally lower and is applied for this analysis. It was assumed that one-third of the 725 MW capacity is deployed in each of the first three years for the purposes of adding the PBI estimate to the Discom savings. A NPV was calculated for the 25-year lifetime Discom savings and the PBI using a discount rate of 10 percent. The NPV estimates for Discom savings and PBI were divided by the number of pumps supported by 725 MW of solar capacity to estimate the per pump savings and required subsidy. In addition, the total savings and costs were divided by the total MW capacity to estimate per MW savings.
As a secondary analysis, the total annual savings were also estimated assuming that less than 100 percent of solar generation displaces grid electricity. From the solar generation analysis in Appendix A, it was assumed that 46 percent, 64 percent, and 76 percent of generated electricity is utilized by pumps operating for 4, 6, and 8 hours per day, respectively. The solar generation analysis for solar
62
feeders assumes that pumps will utilize generated solar within the specified daytime hours up until the pump capacity is reached. While the main analysis assumes that all generated solar displaces grid power, this secondary analysis assumes that the remaining portion of generated electricity is assumed to be curtailed, reducing the overall savings for the Discom.
KUSUM C Solar Pumps
The KUSUM C solar pump analysis is calculated for both modalities of the scheme: no net metering where the farmer cannot withdraw grid electricity, and net metering where the farmer is able to withdraw grid electricity. The excess generation and grid electricity used in each of the modalities is from the PV Generation and Sizing analysis in Appendix A. Based on the 6,000 7.5 HP of agricultural load identified in the Discom tenders for KUSUM C solar pumps, and sizing for double the load and converting to kW (1.5 kW/HP), the total estimated MW capacity for KUSUM C is 90 MW. The estimated system cost is ₹13.90 crore/MW as calculated in the farmer section above.
For KUSUM C solar pumps, the per unit savings (₹/kWh) for Discoms is calculated as shown:
As mentioned, the amount of grid electricity used with KUSUM C solar pumps is 0 in the no net metering case.
The total annual savings represent the difference between the cost of existing grid supply to the pump (₹5.36/kWh in Year 1) and the cost of purchasing excess solar generation from farmers at the fixed feed-in-tariff (₹3.44/kWh). As with the KUSUM A analysis, the annual savings are estimated for each year in the pump’s 25-year lifetime, accounting for the yearly solar degradation. The total subsidy cost associated with KUSUM C solar pumps include 30 percent capital subsidy from GoR and 30 percent capital subsidy from GoI. A NPV was calculated for the 25-year lifetime Discom savings for the total estimated capacity of 90 MW using a discount rate of 10 percent. In addition, the NPV estimates of the total subsidy costs were calculated for the 25-year lifetime. The total savings and costs were divided by the number of pumps supported by the total capacity at each given hourly consumption level to estimate the per pump savings and subsidy costs. Finally, the total savings and costs were divided by the total MW capacity to estimate per MW savings.
As a secondary analysis, the total annual savings were also estimated assuming that the excess generation purchased by the Discom can be used to displace grid electricity for non-agricultural loads. The additional cost savings are estimated based on whether the load served by the solar generation is located at the same feeder, or if the load is located further away. Similar to the analysis in KUSUM A, the additional cost savings represent the difference between the cost of existing grid supply to the pump and the cost of solar generation at the feed-in-tariff.
63
KUSUM C Solar Feeders
The total annual savings represent the difference in cost between existing grid supply (₹4.63/kWh in Year 1) and the break-even cost for solar feeders from the developer discounted cash flow analysis (₹2.72/kWh). The break-even cost represents the costs to the Discom under the CAPEX option where Discoms themselves are the RPG.
For KUSUM C feeders, the per unit savings (₹/kWh) are calculated by the same method as for KUSUM A feeders. The per pump savings were estimated using the same method as with the previous analyses. Finally, the total savings and costs were divided by the total MW capacity to estimate per MW savings.
GoR Benefit-cost Analysis for KUSUM A and C Solar Feeders
For solar feeders under KUSUM A or C, any change to GoR’s agricultural tariff subsidy burden is highly uncertain. Potential savings for GoR would be modulated by the RERC tariff setting process. Thus, no savings are estimated in this analysis.
GoR Benefit-cost Analysis for KUSUM C Solar Pumps
Compared to KUSUM A and C feeder schemes, the impact of the KUSUM C solar pumps on the state subsidy burden can be estimated based on current tariff level. The subsidy level of agricultural electricity is ₹4.65/kWh, considering the agricultural tariff (₹5.55/kWh) and the portion of the tariff that the farmer pays (₹0.90/kWh). Assuming that the amount that the farmer pays does not change due to the political difficulty of raising tariff payments for farmers, the per-unit subsidy increases yearly as the assumed cost of supply escalates per year. The subsidy savings is the amount of subsidy burden avoided due to the displacement of grid electricity with farmers’ self-generation. GoR cost for KUSUM C solar pumps is 30 percent of the capital cost. Based on the annual subsidy savings and upfront capital cost, the NPV savings and NPV GoR cost are calculated for the 25-year lifetime of a pump.
Results Summary
As noted above, the primary results for solar feeders assumes that 100 percent of generated solar displaces grid electricity, whereas the primary results for solar pumps are estimated assuming that only agricultural electricity is displaced. Solar feeders under KUSUM A are either appropriately sized or undersized compared to load, so less overgeneration is expected for those systems (proportionate to load). Thus, it is reasonable to assume that all generated electricity displaces higher-cost grid power. On the other hand, solar pumps under KUSUM C are oversized compared to load, and it is less certain whether a larger proportion of excess generation can be absorbed by non-agricultural load during hours of high solar generation.
64
65
Parameter Hours KUSUM A KUSUM C Feeder Pump – No Net Metering Pump – With Net Metering Feeder ₹/Pump ₹ crore /MW ₹/Pump ₹ crore /MW ₹/Pump ₹ crore /MW ₹/Pump ₹ crore /MW NPV Discom Savings 4 ₹97,030 ₹3.46 -₹71,094 -₹0.75 -₹73,028 -₹1.03 ₹108,652 ₹3.87 6 ₹145,545 ₹3.46 ₹95,710 ₹1.43 ₹90,876 ₹1.29 ₹162,977 ₹3.87 8 ₹194,060 ₹3.46 ₹245,837 ₹3.42 ₹208,885 ₹2.96 ₹217,303 ₹3.87 NPV Total Subsidy Costs 4 ₹12,812 ₹0.23 ₹589,010 ₹8.34 ₹589,010 ₹8.34 ₹58,968 ₹1.05 6 ₹12,812 ₹0.23 ₹589,010 ₹8.34 ₹589,010 ₹8.34 ₹58,968 ₹1.05 8 ₹12,812 ₹0.23 ₹589,010 ₹8.34 ₹589,010 ₹8.34 ₹58,968 ₹1.05 NPV GoR Subsidy Savings 4 ₹0 ₹0 ₹185,231 ₹2.62 ₹182,958 ₹2.62 ₹0 ₹0 6 ₹0 ₹0 ₹276,288 ₹3.91 ₹271,061 ₹3.91 ₹0 ₹0 8 ₹0 ₹0 ₹341,774 ₹4.84 ₹308,140 ₹4.84 ₹0 ₹0 BenefitCost Ratio 4 7.57 15.04 0.19 0.22 0.19 0.19 1.84 3.69 6 11.36 15.04 0.63 0.64 0.61 0.62 2.76 3.69 8 15.15 15.04 1.00 0.99 0.88 0.94 3.69 3.69
Table 10: Summary of Primary Analysis Results
Parameter Hours KUSUM A Feeder ₹/Pump ₹ crore/MW NPV Discom Savings 4 -₹33,573 -₹1.20 6 ₹5,281 ₹0.13 8 ₹56,501 ₹1.01
Table 11: Analysis for KUSUM A – Less Grid Electricity Displaced
Parameter Hours No Net Metering Net Metering Generation sold within the feeder Generation sold to farther load Generation sold within the feeder Generation sold to farther load ₹/Pump ₹/Pump ₹/Pump ₹/Pump NPV Discom Savings 4 ₹349,424 ₹291,015 ₹347,491 ₹289,082 6 ₹428,894 ₹382,616 ₹424,060 ₹377,782 8 ₹516,213 ₹478,659 ₹479,261 ₹441,706
Table 12: Analysis for KUSUM C – Solar Pumps, Savings from Excess Solar Generation Sold
66
Parameter Hours No Net Metering Net Metering ₹/Pump ₹/Pump ₹/Pump ₹/Pump NPV GoR Savings 4 ₹185,231 ₹ 2.62 ₹182,958 ₹2.62 6 ₹276,288 ₹ 3.91 ₹271,061 ₹3.91 8 ₹341,774 ₹ 4.84 ₹308,140 ₹4.84 NPV GoR Cost 4 ₹294,505 ₹ 8.34 ₹294,505 ₹8.34 6 ₹294,505 ₹ 8.34 ₹294,505 ₹8.34 8 ₹294,505 ₹ 8.34 ₹294,505 ₹8.34 Benefit-Cost Ratio 4 0.63 0.31 0.62 0.31 6 0.94 0.47 0.92 0.47 8 1.16 0.58 1.05 0.58
Table 13: GoR Costs and Savings for KUSUM C – Solar Pumps
APPENDIX C: SENSITIVITIES AND PRIMARY UNCERTAINTIES
AFFECTING THE VALUE PROPOSITION FOR SOLAR FEEDERS AND SOLAR PUMPS
Solar Feeders under KUSUM A and KUSUM C
The primary factors contributing to uncertainty around the NPV of solar feeders under KUSUM A and KUSUM C are: (i) the capital cost (CAPEX) of solar modules, (ii) the operational and maintenance cost (OPEX) of solar modules, (iii) the cost of land for construction, and (iv) the panels’ capacity utilization factor (CUF). Variability within any of these four factors could substantially alter the NPV of solar feeders from those figures presented in Table 10. The sensitivity of NPV to each uncertainty factor studied is shown below in Figure 12. Various sensitivities are displayed horizontally, while the height of the bars represents the uncertainty’s capacity to change the NPV of a feeder project (with gray being the maximum overperformance above best estimates and orange the maximum underperformance). The range for each uncertainty is based on research into the range of existing cost estimates.
67
-1 -0.5 0 0.5 1 1.5 CAPEXOPEX LendingFee Tariff InsuranceRequiredReturn onInvestment SalvageValueDegrad ationRateLifespanCapacityUtilizationFactor LandCost C h a n g e i n N P V ( I N R C r o r e ) Sensitivity
Figure 12: Potential Change in NPV of 1 MW PV Feeder under KUSUM A The sensitivity analysis for feeders under KUSUM A demonstrates the change in NPV given the best and worst-case estimated parameters for relevant inputs.
Another key uncertainty for KUSUM developers is the weighted average cost of capital, which is a measure of the return on equity and cost of debt. Figure 13 illustrates the change in the tariff required by developers as a function of their weighted average cost of capital with other inputs constant. If risk profiles change or the banking sector becomes constrained, the cost of equity or debt financing for developers could become higher or lower than current best estimates.
In addition to the uncertainty in capital cost estimates, there is also potential for KUSUM’s domestic manufacturing requirements to increase the cost of PV panels. Thus, the viability of the scheme may depend on GoR’s willingness to adjust tariff ceilings as needed to allow developers to place profitable bids in the face of increased capital costs. In the event of severe supply chain constrictions, a flexible tariff cap could help developers continue to bid on feeder projects that would otherwise have been unprofitable at the ₹3.14/kWh ceiling. In order to deter potential abuse of a flexible cap by developers, regulators could ensure that the price rises only if certain unfavorable economic conditions exist and developers are not bidding at or below the current rate.
Figure 13: Required Tariff Feeder for Given Cost of PV Modules (NPV = 0)
The sensitivity analysis for feeders under KUSUM A demonstrate the impact of weighted average cost of capital values on break-even tariff level. The current ₹3.14/kWh rate is denoted by the horizontal line, and its intersection with the center 10.2 percent WACC line indicates the assumed module cost of ₹3.6 crore/1 MW.
Solar Pumps under KUSUM C (with Net Metering)
The primary factors contributing to uncertainty around the NPV of solar pumps under KUSUM C are: (i) the capital cost of pumps, (ii) the price of avoided electricity purchases, and (iii) the ratio of installed PV capacity to pump power. We found evidence of considerable variability in several factors which makes increases the uncertainty associated with the value proposition of pump solarization, as
68
2 2.5 3 3.5 4 4.5 5 2.75 3 3.25 3.5 3.75 4 4.25 4.5 4.75 5 T a r i f f ( I N R / k W h ) Module Cost (INR Crore/MW) High WACC (12.2%) Medium WACC (10.2%) Low WACC (8.2%) KUSUM A Tariff (3.14)
compared with feeders. For example, a 50 percent increase in capital cost would require an additional subsidy of ₹6.45 crore/MW. Alternatively, pumps that are only 2/3rds as expensive would reduce the required subsidy by ₹4.27 crore/MW. The scale of each uncertainty factor studied is shown below in Figure 14 for the modality with net metering.
The
Finally, differences in the weighted average cost of capital do not substantially alter the total subsidy required for pump owners to achieve close to their required rate of return. The WACC is not as consequential for KUSUM C pump solarization because farmers’ total investment in equity and debt accounts for well under half of the necessary capital outlay, dampening the effects of a higher or lower WACC.
69
Figure 14: Potential Change in NPV of 1 MW PV Net Metered Pumps for Given Uncertainties
sensitivity analysis for pumps under KUSUM C demonstrates the change in NPV given the best and worst-case estimated parameters for relevant inputs.
-8 -6 -4 -2 0 2 4 6 8 CAPEX OPEX LendingFee Tariff Insurance Requi redReturn onInvestment AvoidedPurchases D e gradationRate Lifespan C a paci t yUtilizationFactor C h a n g e i n N P V ( ₹ c r o r e ) Sensitivity
APPENDIX D: PREVIOUS SOLARIZATION PROGRAMS, THEIR SUCCESSES AND CHALLENGES
KUSUM is not the first solarization scheme attempted in India, nor is it the only ongoing scheme. Thus, before turning to KUSUM itself, it is useful to analyze its predecessors and peers. This section reviews three such programs: (1) Dhundi Solar Pump Irrigators’ Cooperative Enterprise (Dhundi scheme; SPICE), (2) Suryashakti Kishan Yojana (SKY) Initiative, and (3) Mukhyamantri Kisan Aay Bodhotri Solar Yojana (Delhi scheme; MKABSY).
Dhundi SPICE.
SPICE was formed in 2016 between six farmers in Dhundi, a village in Anand, Gujarat, under the aegis of the International Water Management Institute (IWMI) and CGIAR’s Research Program on Climate Change, Agriculture and Food Security (CCAFS). At the time of its founding, SPICE was the first solar cooperative of its kind in India and managed 56.4 kW of solar generation capacity.174
SPICE’s design is fairly straightforward, especially for those familiar with the KUSUM C component it inspired. Under the scheme, diesel pump owners (i) set up solar systems on their own premises to solarize their pumps and (ii) entered 25-year PPAs with the local Discom who would purchase any electricity the farmer wishes to sell. The program received generous outside funding so generous, in fact, that participants were required to front just 12 percent of the total project cost. What’s more, the program offered participating farmers the highly attractive FiT of ₹7.13 per kWh, ₹4.63 of which comprised the contracted PPA rate. The difference, ₹2.50, comprised ‘Green Energy’ and ‘Water Conservation’ bonuses that were paid out by IWMI and CCAFS. In exchange for this right to sell power, the Dhundi farmers surrendered their right to apply for a subsidized grid connection over the PPA period.175 SPICE’s highly-subsidized financing and above-market FiT mean that the program may serve as proof of technical concept for KUSUM C, but not proof of commercial concept.
SPICE faced a number of ‘growing pains’ at the outset, including, among other things, (a) identifying willing participants, (b) clearing the land records of interested farmers, (c) registering the cooperative, and (d) preparing its bylaws. Despite these obstacles, in its first two years SPICE proved an unqualified boon to its members, whose incomes increased dramatically176 and who were able to repay their loans in full over just a 24-month period.177 It also proved surprising. Though the program was designed to provide participants with an alternative, market and climate risk-free source of income namely, the FiT the Dhundi farmers found they could sell solar-pumped water to their neighbors and earn more than twice the amount they would by selling power to the grid.178 Admittedly this result may be particular to Dhundi, where solar-pumped water replaced more expensive, diesel-pumped water, a substitution that is unlikely to be possible in most of Rajasthan. Even so, the experience of Dhundi supports this report’s argument that farmers may respond in unpredictable ways to the opportunities created by solarization schemes.
70
SKY Initiative.
Seeking to replicate SPICE’s success, the Government of Gujarat launched the SKY Initiative, a Dhundi analogue scheme that blends elements of both KUSUM A and KUSUM C. In its pilot stage, SKY Initiative sought to solarize 137 feeders which between them covered more than 12,000 farmers and 177 MW of solar power generation.179 SKY featured less generous financing than SPICE in two ways. First, it required that farmers shoulder 40 percent of the total program cost, five percent up front and the remaining 35 percent via a subsidized loan.180 Second, it only offered participants a FiT of ₹7.00/kWh for the first seven years of the PPA term, after which time the FiT would fall to ₹3.50/kWh. Perhaps as a result, the initiative floundered at the pilot stage. From its original goal of 137 feeders and 12,400 farmers, the pilot was scaled down to just five feeders and 2,000 farmers.181 While several explanations have been floated, the most frequently cited is that farmers are simply not interested in the project unable to make the down payment and unwilling to forfeit their right to subsidized power.182
The Government of Delhi has an alternative vision for solarization. While similar to KUSUM A in that it involves installation of solar panels on farmland, the new program does away with farmer cooperatives entirely. Instead, MKABSY compensates farmers for leasing up to one-third of their land to private developers, who erect solar panels on the land and take on all the associated risks therein.183 This point warrants emphasis. Unlike SPICE and SKY, the Delhi scheme neither requires a financial contribution from farmers nor imposes on them additional risks in the form of securing and maintaining panels in exchange for increasing their income. Farmers who participate in the scheme simply earn ₹8,333 per acre per month in the first year and receive increases of six percent per annum thereafter.184 This means that by the 25th and final year of the contract term, participating farmers will make ₹33,741 per acre per month. Since farmers earn roughly ₹20,000 per acre per annum, this fixed, stable income amounts to a 20-fold increase in annual income 185 However, as a new program, it has yet to be seen what uptake will be like or whether unforeseen barriers may limit its implementation.
Lessons
from Dhundi SPICE, SKY Initiative, and Delhi MKABSY Scheme
Farmers may require proof of concept at the local level before they agree to participate in a solarization scheme. As SPICE illustrates, even highly attractive financing wasn’t enough to attract farmers unfamiliar with or unconvinced by the promise of solar panels to the scheme. It was only after farmers in Dhundi saw the benefits accruing to the cooperative’s six original members that they came around to the idea. This experience suggests that educating farmers about the solar scheme and its benefits, while perhaps necessary, may not be sufficient. Risk-averse farmers may have to ‘see it with their own eyes.’
Farmers are extremely sensitive to the specific FiT and financing arrangement. At a 12 percent capital requirement and with a FiT of ₹7.13 per kWh, farmers lined up to participate in SPICE. At a
71
Delhi MKABSY Scheme.
40 percent capital requirement and a less favorable FiT, the SKY Initiative floundered. This stark contrast highlights the sensitivity of solarization schemes to the exact financial arrangement. Because KUSUM’s financing arrangement is even less generous than that of SKY and because farmers are unlikely to negotiate PPAs featuring FiTs as high as Dhundi’s, farmers may be less interested in KUSUM projects than many believe.
Farmers may be unwilling to trade certain subsidies for increased income, especially when that income is perceived as uncertain or variable. As the challenges in rolling out the SKY pilot demonstrate, farmers are loath to give up subsidized grid power for solar power. To make this trade-off attractive, a solarization scheme may need to provide (a) more reliable electricity supply than the grid, (b) with the option to sell excess power generated to the grid at a remunerative FiT (minimum five rupees per kWh, according to one estimate).186 While a successful solar pump scheme may include additional methods of incentivizing farmers to participate, proponents of solar pump schemes tend to emphasize these two.
Private developers may be disinclined to work with individual farmers or farmer cooperatives. There is some evidence to suggest that private developers are reluctant to work with farmers.187 Developers may not find the benefits of one-off agreements with farmers worth the transaction costs of negotiating them. This should be especially true of communities where farmers are unable to form cooperatives and where developers would therefore have to negotiate small agreements with individual farmers. Alternatively, developers may simply prefer to deal with either Discoms and business customers for utility scale solar generation, or urban, residential consumers in the solar rooftop space, shifting attention and investment away from agricultural solar initiatives like KUSUM.
72
APPENDIX E: LEGAL REGIME GOVERNING GROUNDWATER IN RAJASTHAN
Indian common law gives landowners ‘absolute dominion’ over groundwater resources. Groundwater is considered “part and parcel of the land” at common law,188 with the result that owners of property enjoy “the right… to collect and dispose within [their] own limits of all water under the land.”189 In other words, access to and control of groundwater is the exclusive prerogative of landowners on whose property the water is found.190 At common law, landowners may legally draw as much water as they please from below their land, even if they cause damage to the water resources of their neighbors as a result.191 These long-standing legal principles, which date from the British Colonial era, are one reason Rajasthan has suffered from depletion of its groundwater resources.
Though states may legislate out of this regrettable state of affairs, Rajasthan continues to adhere to the traditional common law framework. The Indian Constitution vests states with the power to make laws related to water,192 laws which would supersede the underlying common law regime. GoI, recognizing that the colonial regime is no longer up to the task of ensuring the long-term supply of groundwater, has encouraged states to pass water reform laws since 1970, even drafting a ‘Model Act’ to aid in the effort.193 Some states have heeded the call. West Bengal and Andhra Pradesh, for example, have followed the Model Act’s approach of issuing well permits and imposing extraction charges.194 Gujarat has passed similar legislation, but only for water used in irrigation.195 By contrast, to date GoR has passed no such legislation. Thus, the traditional common law approach permitting unrestrained groundwater extraction still prevails in Rajasthan.
The persistence of the common law regime in Rajasthan is not for lack of attempts at reform. To the contrary, as recently as 2005 GR considered adopting the Rajasthan Groundwater (Rational Use and Management) Act. The bill, which was functionally equivalent to parts of the Model Act, would have, among other things, (a) established a Water Authority tasked with regulating groundwater extraction; (b) required registration of existing wells, (c) instituted an application process for construction of new wells, and (d) imposed user charges for water pumped beyond a certain threshold determined by the legislature.196 While some scholars fault this regulatory approach for focusing on individual extraction units (i.e., wells) instead of hydrological units (i.e., aquifers),197 the bill, if passed, would likely have improved upon the status quo.
73
APPENDIX F: PREVIOUS DISTRIBUTION SECTOR REFORM EFFORTS
Previous reform efforts addressed root issues by improving revenue recovery, reducing transmission and distribution losses, enhancing metering infrastructure, and upgrading the grid. Recognizing the challenge of providing rural electricity, GoI approved Deendayal Upadhyaya Gram Jyoti Yojana (DDUGJY) in 2015, a scheme to fund rural feeder separation, improve distribution, reduce line theft, and improve metering of agricultural load. Rural feeder separation enables Discoms to schedule agricultural load while keeping domestic electricity available 24 hours a day, improving line visibility and reducing potential line theft. The following year, Rajasthan approved the Mukhya Mantri Vidhyut Sudhar Abhiyan (MMVSA) program to upgrade its agricultural power supply. Demand-side policies have also been proposed to manage agricultural electricity consumption. The Agricultural Demand Side Management Program (Ag-DSM) approved by GoI has prompted states like Rajasthan to replace over 10 percent of existing agricultural pumps with efficient alternatives.198, 199
Year
Central or State Policy
2001 Central
Accelerated Power Development Programme (APDP), later named Accelerated Power Development and Reform Programme (APDRP)
Description
Central finance mechanism for upgrading sub-transmission and distribution network, improving generation projects
2008 Central
Restructured Accelerated Power Development & Reforms Programme (RAPDRP)
Central finance mechanism for AT&C loss reduction, focusing on measuring performance
2014 Central
Renamed from R-APDRP, Integrated Power Development Scheme (IPDS)
2015 Central Deendayal Upadhyaya Gram Jyoti Yojana (DDUGJY)
2016 State Mukhya Mantri Vidhyut Sudhar Abhiyan (MMVSA)
Central finance mechanism for strengthening sub-transmission network, metering, IT application, customer care services
Central finance mechanism for rural feeder separation, strengthening distribution network and metering in rural areas
State program to improve rural and agricultural electricity supply, improve consumer services, and reduce AT&C losses to below 15%.
74
Table 14: Government Schemes to Improve Distribution Network200
X. ENDNOTES
1 Mohinder Gulati, Satya Priya, and Edward Bresnyan, “Grow Solar, Save Water, Double Farmer Income: An Innovative Approach to Addressing Water-Energy-Agriculture Nexus in Rajasthan” (The World Bank, January 2020).
2 Gulati, Priya, and Bresnyan.
3 Anurag Vaishnav, “Rajasthan Budget Analysis 2020-21” (PRS Legislative Research, February 20, 2020), https://www.prsindia.org/parliamenttrack/budgets/rajasthan-budget-analysis-2020-21.
4 Gulati, Priya, and Bresnyan, “Grow Solar, Save Water, Double Farmer Income: An Innovative Approach to Addressing Water-Energy-Agriculture Nexus in Rajasthan.”
5 Gulati, Priya, and Bresnyan.
6 Ashwin Gambhir and Shantanu Dixit, “Solar Agricultural Feeders in Maharashtra,” Akshay Urja, April 2019.
7 Shripad Dharmadhikary et al., “Understanding the Electricity, Water and Agriculture Linkages. Volume 1: Overview” (Pune, Maharashtra: Prayas Energy Group, September 2018).
8 Mohinder Gulati, Satya Priya, and Edward Bresnyan, “Grow Solar, Save Water, Double Farmer Income: An Innovative Approach to Addressing Water-Energy-Agriculture Nexus in Rajasthan” (The World Bank, January 2020).
9 MNRE, “Memorandum: Guidelines for Implementation of PM-KUSUM” (MNRE, July 22, 2019), https://mnre.gov.in/img/documents/uploads/8065c8f7b9614c5ab2e8a7e30dfc29d5.pdf.
10 Rajasthan Electricity Regulatory Commission, “Final Order PM KUSUM 2020” (Rajasthan Electricity Regulatory Commission, February 11, 2020), https://rerc.rajasthan.gov.in/rerc-user-files/tariff-orders.
11 Rajasthan Electricity Regulatory Commission, “Final Order PM KUSUM 2020” (Rajasthan Electricity Regulatory Commission, February 11, 2020), https://rerc.rajasthan.gov.in/rerc-user-files/tariff-orders.
12 “India Says All Villages Have Electricity,” BBC News, April 30, 2018, sec. India, https://www.bbc.com/news/worldasia-india-43946049.
13 Ann Josey, “Prayas Lecture” (Lecture, Teleconference, September 16, 2020).
14 Nicholas Ryan and Anant Sudarshan, “Rationing the Commons” (National Bureau of Economic Research, July 6, 2020), https://doi.org/10.3386/w27473.
15Gulati, Priya, and Bresnyan, “Grow Solar, Save Water, Double Farmer Income: An Innovative Approach to Addressing Water-Energy-Agriculture Nexus in Rajasthan.”
16 Shripad Dharmadhikary et al., “Understanding the Electricity, Water and Agriculture Linkages. Volume 1: Overview” (Pune, Maharashtra: Prayas Energy Group, September 2018).
17 MNRE, “Memorandum: Guidelines for Implementation of PM-KUSUM,” July 22, 2019.
18 MNRE. The rent payable to the farmer may be designated either in terms of (a) rupees per annum per acre or (b) rupees per unit energy generated per acre of land area. Method (a) yields truly fixed income, while method (b) may yield income that varies somewhat by season. Still, the variation in income under method (b) is certainly less than the variation in income earned by selling power to the grid, since the sole source of variation in the former, seasonality, is just one source of variation in the latter.
19 MNRE.
20 Mukhya et al., “Agriculture-Cum-Solar Farm Scheme in NCT of Delhi,” accessed November 21, 2020, http://web.delhi.gov.in/wps/wcm/connect/79b16c8047369c4d813ccd4bb6226757/Mukhya+Mantri+Kisaan+Aay +badhotary+Yojana.pdf?MOD=AJPERES&lmod=-276071204.
21 Tushaar Shah et al., “Promoting Solar Power as a Remunerative Crop,” Economic and Political Weekly 52, no. 45 (November 11, 2017): 14–19, https://www.epw.in/journal/2017/45/commentary/promoting-solar-powerremunerative-crop.html.
22 Siddharth Sareen, “Politics, Procurement, Bail-Out and Buy-In: Woes and Ways of Rajasthan’s Distribution Sector,” Working Paper, Mapping Power Project (Centre for Policy Research and Regulatory Assistance Project, April 2017).
23 Mohinder Gulati, Satya Priya, and Edward Bresnyan, “Grow Solar, Save Water, Double Farmer Income: An Innovative Approach to Addressing Water-Energy-Agriculture Nexus in Rajasthan” (The World Bank, January 2020).
24 “Rajasthan Solar Energy Policy 2019,” RajRAS - Rajasthan RAS (blog), December 20, 2019, https://www.rajras.in/rajasthan-solar-energy-policy-2019/.
25 Rajasthan Electricity Regulatory Commission, “(Renewable Energy Obligation) (Fifth Amendment) Regulations, 2019,” January 2019,
75
https://www.recregistryindia.nic.in/pdf/RPO/RERC(Renewable_Energy_Obligation)(5th_Amendment)_Regulatio ns,_2019_Dated_11_01_2019.pdf.
26 MNRE, “Memorandum: Guidelines for Implementation of PM-KUSUM,” July 22, 2019.
27 MNRE.
28 MNRE.
29 TERI, “Policy Paper on Solar PV Manufacturing in India: Silicon Ingot & Wafer - PV Cell - PV Module” (TERI), accessed November 19, 2020, https://www.teriin.org/sites/default/files/201908/Solar%20PV%20Manufacturing%20in%20India.pdf.
30 Rajasthan Electricity Regulatory Commission, “Final Order PM KUSUM 2020.”
31 Rajasthan Electricity Regulatory Commission, “Petition No. 1757/2020,” July 2020.
32 Iqbal, Mohammed. 2020. “Rajasthan First to Complete Farmers’ Selection for Solar Plants.” The Hindu, July 10, 2020, sec. Other States. https://www.thehindu.com/news/national/other-states/rajasthan-first-to-complete-farmersselection-for-solar-plants/article32037215.ece.
33 “Installed Capacity Report.” 2020. Government of India Ministry of Power, Central Electricity Authority. https://cea.nic.in/wp-content/uploads/installed/2020/11/installed_capacity.pdf
34 Rajasthan Electricity Regulatory Commission, “Final Order PM KUSUM 2020.”
35 figures based on conversations with Discom officials
36 MNRE, “Memorandum: Guidelines for Implementation of PM-KUSUM,” July 22, 2019.
37 “MNRE Issues Guidelines for Implementation of Feeder Level Solarisation under Component-C of PM-KUSUM Scheme.” n.d. Accessed December 6, 2020. www.pib.gov.in/Pressreleaseshare.aspx?PRID=1678286.
38 Commisionerate of Agriculture, “Rajasthan Agricultural Statistics at a Glance 2017-2018” (Jaipur, Rajasthan, India), accessed November 22, 2020, http://www.agriculture.rajasthan.gov.in/content/dam/agriculture/Agriculture%20Department/agriculturalstatistics /rajasthan%20agriculture%20statistics%20at%20a%20glance%202017-18-merged.pdf.
39 Department of Agriculture, Government of Rajasthan, “Rajasthan Agriculture Competitiveness Project Social Assessment and Management Framework,” 2012.
40 M S Rathore, “Groundwater Exploration and Augmentation Efforts in Rajasthan,” February 2005, 33, https://assets.publishing.service.gov.uk/media/57a08c6fe5274a27b20011db/R8169AGRAR_Review_Rajasthan.pdf.
41 Amal Kar, “Agricultural Land Use in Arid Western Rajasthan: Resource Exploitation and Emerging Issues,” December 1, 2014.
42 Commisionerate of Agriculture, “Rajasthan Agricultural Statistics at a Glance 2017-2018.”
43 Kar, “Agricultural Land Use in Arid Western Rajasthan.”
44 “58 Years of Agricultural Statistics of Rajasthan (1956-57 to 2013-14)” (Yojana Bhawan, Jaipur, Rajasthan: Directorate of Economics and Statistics, Department of Planning, Rajasthan., n.d.).
45 “Rajasthan Faces Power Cuts as Coal Shortage Hits Production,” Hindustan Times, October 8, 2017, https://www.hindustantimes.com/jaipur/rajasthan-faces-power-cuts-as-coal-shortage-hits-production/story9ZTbMq9C7Ryg56AT0tqamK.html.
46 “Breakdown in Units, Rajasthan Power Crisis Worsens,” DNA India, April 19, 2018, sec. Jaipur India, https://www.dnaindia.com/jaipur/report-breakdown-in-units-rajasthan-power-crisis-worsens-2606487.
47 Dev Ankur Wadhawan, “Rajasthan: Parts of Desert State Reeling under Severe Power Crisis This Festive Season,” India Today, October 12, 2017, https://www.indiatoday.in/india/story/rajasthan-power-crisis-bikaner-bharatpurdholpur-1063771-2017-10-12.
48 Sujith Koonan, “Legal Regime Governing Groundwater,” in Water Law for the Twenty-First Century: National and International Aspets of Water Law Reforms in India (Abingdon: Routledge, 2010), 182–204, http://www.ielrc.org/content/a1011.pdf.
49 Jesse J. Richardson, “Postcolonial Evolution of Water Rights in India and the United States,” in Land Policies in India: Promises, Practices and Challenges, ed. Sony Pellissery, Benjamin Davy, and Harvey M. Jacobs, India Studies in Business and Economics (Singapore: Springer, 2017), 51–70, https://doi.org/10.1007/978-981-10-4208-9_3.
50 “State Water Policy” (Jaipur, Rajasthan: State Water Resource Planning Department, Government of Rajasthan, February 2010), https://water.rajasthan.gov.in/content/dam/water/water-resourcesdepartment/Miscellaneous/WaterPolicy/Rajya%20Jal%20Neti_English.pdf.
76
51 “State Water Policy” (Jaipur, Rajasthan: State Water Resource Planning Department, Government of Rajasthan, February 2010), https://water.rajasthan.gov.in/content/dam/water/water-resourcesdepartment/Miscellaneous/WaterPolicy/Rajya%20Jal%20Neti_English.pdf.
52 Trevor Birkenholtz, “The 2010 Rajasthan State Water Policy and the Urbanization of Water,” IWMI-Tata Highlight, 2012, 8.
53 “11 Things to Know about the Mukhyamantri Jal Swavlamban Campaign of Rajasthan,” Rajasthan Mukhya Mantri Jal Swawlamban Abhiyan, 2015, http://www.water.rajasthan.gov.in/mjsa/blogs/11thingstoknowaboutMJSA.html.
54 Correspondence with Pratiti Priyadarshani, Foundation for Ecological Security, November 20, 2020.
55 “Water Commons Influencing Practice” (Anand, Gujarat, India: Foundation for Ecological Security, June 2016).
56 Rathore, “Groundwater Exploration and Augmentation Efforts in Rajasthan”; National Water Mission, “Vulnerable & Over Exploited Areas | National Water Mission, Ministry of Jal Shakti, Department of Water Resources, RD & GR, Government of India,” accessed November 20, 2020, http://nwm.gov.in/?q=vulnerable-over-exploited-areas.
57 Block is an administrative sub-division under district level and is made up of several Gram Panchayats (village council or local self-government over a cluster of villages). The local government body at the block level (tehsil / taluka) is called Panchayat Samiti, and it is the link between Gram Panchayats and Zila Parishad at the district level.
58 “Block Wise Ground Water Resources Assessment - 2017” (Central Ground Water Board, Ministry of Jal Shakti, Department of Water Resources, River Development and Ganga Rejuvenation, n.d.).
59 International Finance Corporation, “Rajasthan Water Assessment: Potential for Private Sector Interventions,” accessed November 20, 2020, https://www.ifc.org/wps/wcm/connect/REGION__EXT_Content/IFC_External_Corporate_Site/South+Asia/R esources/Rajasthan+Water+Assessment.
60 “State Water Policy” (Jaipur, Rajasthan: State Water Resource Planning Department, Government of Rajasthan, February 2010), https://water.rajasthan.gov.in/content/dam/water/water-resourcesdepartment/Miscellaneous/WaterPolicy/Rajya%20Jal%20Neti_English.pdf.
61 “Water Commons Influencing Practice.”
62 “Block Wise Ground Water Resources Assessment - 2017” (Central Ground Water Board, Ministry of Jal Shakti, Department of Water Resources, River Development and Ganga Rejuvenation, n.d.).
63 J. S. Famiglietti, “The Global Groundwater Crisis,” Nature Climate Change 4, no. 11 (November 2014): 945–48, https://doi.org/10.1038/nclimate2425.
64 Dharmadhikary et al., “Understanding the Electricity, Water and Agriculture Linkages. Volume 1: Overview.”
65 Reena Badiani, Katrina K. Jessoe, and Suzanne Plant, “Development and the Environment: The Implications of Agricultural Electricity Subsidies in India,” The Journal of Environment & Development 21, no. 2 (2012): 244–62, http://www.jstor.org/stable/26199424.
66 Shilp Verma, Neha Durga, and Tushaar Shah, “Solar Irrigation Pumps and India’s Energy–Irrigation Nexus,” Economic and Political Weekly 54 (January 12, 2019): 62–65; Gulati, Priya, and Bresnyan, “Grow Solar, Save Water, Double Farmer Income: An Innovative Approach to Addressing Water-Energy-Agriculture Nexus in Rajasthan”; M. Dinesh Kumar, “Impact of Electricity Prices and Volumetric Water Allocation on Energy and Groundwater Demand Management:: Analysis from Western India,” Energy Policy 33, no. 1 (January 1, 2005): 39–51, https://doi.org/10.1016/S0301-4215(03)00196-4; Reena Badiani and Katrina K. Jessoe, “Electricity Subsidies for Agriculture : Evaluating the Impact and Persistence of These Subsidies in India DRAFT,” 2011, /paper/Electricitysubsidies-for-agriculture-%3A-Evaluating-Badiani-Jessoe/0eb2682bb27429fc27c7d5e52804e1c89f55a3d1.
67 Verma, Durga, and Shah, “Solar Irrigation Pumps and India’s Energy–Irrigation Nexus.”
68 Poonam Priyanka Payal, “Role of Irrigation in Development: The Rajasthan Experience,” International Journal of Recent Technology and Engineering 8, no. 6 (March 30, 2020): 2430–35, https://doi.org/10.35940/ijrte.F7938.038620; Kar, “Agricultural Land Use in Arid Western Rajasthan.”
69 Dharmadhikary et al., “Understanding the Electricity, Water and Agriculture Linkages. Volume 1: Overview.”
70 Kar, “Agricultural Land Use in Arid Western Rajasthan.”
71 Chandni Singh, Henny Osbahr, and Peter Dorward, “The Implications of Rural Perceptions of Water Scarcity on Differential Adaptation Behaviour in Rajasthan, India,” Regional Environmental Change 18, no. 8 (December 1, 2018): 2417–32, https://doi.org/10.1007/s10113-018-1358-y.
72 David Blakeslee, Ram Fishman, and Veena Srinivasan, “Way Down in the Hole: Adaptation to Long-Term Water Loss in Rural India,” American Economic Review 110, no. 1 (2020): 200
224, https://econpapers.repec.org/article/aeaaecrev/v_3a110_3ay_3a2020_3ai_3a1_3ap_3a200-224.htm.
77
–
73 Suresh Kumar, B.L. Dhyani, and Raman Singh, “Depleting Groundwater Resources of Rajasthan State and Its Implications,” Popular Kheti 01 (October 3, 2013): 64–68.
74 Gustav Olofsson, “Water Scarcity and Slow Violence: The Effects of Water Scarcity in Gansu, China and Rajasthan, India,” 2017, http://lup.lub.lu.se/student-papers/record/8909263.
75 Siddharth Sareen, Mapping Power: The Political Economy of Electricity in India’s States, ed. Navroz K. Dubash, Ranjit Bharvirkar, and Sunila S. Kale (Oxford University Press, 2018).
76 Rajasthan Electricity Regulatory Commission, “Petition No. RERC 1541/19, 1542/19, 1543/19,” February 6, 2020.
77 Sareen, Mapping Power: The Political Economy of Electricity in India’s States.
78 “The Story of a Peasant Struggle in Jiwandesar, Rajasthan,” Economic and Political Weekly 55, no. 40 (June 5, 2015): 7
8, https://www.epw.in/journal/2020/40/commentary/story-peasant-struggle-jiwandesar-rajasthan.html.
79 Anurag Vaishnav, “Rajasthan Budget Analysis 2020-21.”
80 Ministry of Power, Government of India, “UDAY (Ujwal Discom Assurance Yojana) Scheme for Operational and Financial Turnaround of Power Distribution Companies,” November 20, 2015.
81 Anurag Vaishnav, “State Budget Analysis - Rajasthan 2019-20” (PRS Legislative Research, July 10, 2019), https://www.prsindia.org/sites/default/files/budget_files/State%20Budget%20Analysis%20-%20Rajasthan%20201 9-20%20English%20v2.pdf.
82 Anurag Vaishnav, “Rajasthan Budget Analysis 2020-21.”
83 Anurag Vaishnav.
84 Anurag Vaishnav, “State Budget Analysis - Rajasthan 2020-21” (PRS Legislative Research, February 20, 2020), https://www.prsindia.org/sites/default/files/budget_files/State%20Budget%20Analysis%20-%20Rajasthan%20202 0-21.pdf.
85 “The Story of a Peasant Struggle in Jiwandesar, Rajasthan.”
86 Sangeeta Pranvendra, “Rajasthan: Opposition Parties Channelling Energies to Exploit Farmers as Vote Bank,” DNA India, October 8, 2018, https://www.dnaindia.com/jaipur/report-rajasthan-opposition-parties-channelling-energiesto-exploit-farmers-as-vote-bank-2672859.
87 “Doubling of Farmers’ Income Issues & Strategies in Rajasthan” (NRMC, March 2018), https://www.nabard.org/auth/writereaddata/tender/2802192439Doubling%20of%20Farmers'%20Income%20Issu es%20&%20Strategies%20in%20Rajasthan.pdf.
88 “The Story of a Peasant Struggle in Jiwandesar, Rajasthan.”
89 “Power Subsidy Held up for Months, Farmers Plan Protests in Rajasthan,” The Indian Express (blog), June 5, 2020, https://indianexpress.com/article/india/power-subsidy-held-up-for-months-farmers-plan-protests-in-rajasthan6443077/.
90 Navroz K. Dubash, “The Disruptive Politics of Renewable Energy,” The India Forum, May 22, 2019, https://www.theindiaforum.in/article/disruptive-politics-renewable-energy.
91 Rajasthan Renewable Energy Corporation. 2019. “Annexure A. Details of All Rural 33 KV Sub-Stations for Solar Power Plants Installation by the Farmer under KUSUM Component-A: Jaipur Discom.” In Request for Selection For Selection of Developers for Setting up of Decentralized Solar PV Plants Each of 0.5 MW to 2 MW (AC) Aggregating to Total 113.5MW Capacity Be Installed and Connected at Discom’s 33/11kV Substations in Rajasthan.
https://energy.rajasthan.gov.in/content/dam/raj/energy/rrecl/pdf/Home%20Page/1.%20JVVNL%20List%20for %20RUVN%20for%20Component-A%20(1).pdf.
92 Rajasthan Renewable Energy Corporation. 2019. “Annexure B. Details of All Rural 33 KV Sub-Stations for Solar Power Plants Installation by the Farmer under KUSUM.” In Request for Selection For Selection of Developers for Setting up of Decentralized Solar PV Plants Each of 0.5 MW to 2 MW (AC) Aggregating to Total 113.5MW Capacity Be Installed and Connected at Discom’s 33/11kV Substations in Rajasthan
https://energy.rajasthan.gov.in/content/dam/raj/energy/rrecl/pdf/Home%20Page/2.%20AVVNL%20List%20for %20RUVN%20for%20Component-A%20(1).pdf.
93 Rajasthan Renewable Energy Corporation. 2019. “Annexure C. Details of All Rural 33 KV Sub-Stations for Solar Power Plants Installation by the Farmer under KUSUM (JdVVNL).” In Request for Selection For Selection of Developers for Setting up of Decentralized Solar PV Plants Each of 0.5 MW to 2 MW (AC) Aggregating to Total 113.5MW Capacity Be Installed and Connected at Discom’s 33/11kV Substations in Rajasthan
https://energy.rajasthan.gov.in/content/dam/raj/energy/rrecl/pdf/Home%20Page/3.%20JdVVNL%20List%20for %20RUVN%20for%20Component-A%20(1).pdf.
78
–
94 Anjali Viswamohanan, and Manu Aggarwal. 2018. “Curtailing Renewable Energy Curtailment.” Rethinking Renewable Energy Power Purchase Agreements. Council on Energy, Environment and Water.
95 Anjali Viswamohanan, and Manu Aggarwal. 2018. “Curtailing Renewable Energy Curtailment.” Rethinking Renewable Energy Power Purchase Agreements. Council on Energy, Environment and Water.
96 ; Avinash Kishore, Tushaar Shah, and Nidhi Tewari, “Solar Irrigation Pumps: Farmers’ Experience and State Policy in Rajasthan,” Economic and Political Weekly 49 (March 8, 2014): 55–62.
97 Mohinder Gulati, Satya Priya, and Edward Bresnyan, “Grow Solar, Save Water, Double Farmer Income: An Innovative Approach to Addressing Water-Energy-Agriculture Nexus in Rajasthan” (The World Bank, January 2020); Shripad Dharmadhikary et al., “Understanding the Electricity, Water and Agriculture Linkages. Volume 1: Overview” (Pune, Maharashtra: Prayas Energy Group, September 2018).
98 Mohinder Gulati, Satya Priya, and Edward Bresnyan, “Grow Solar, Save Water, Double Farmer Income: An Innovative Approach to Addressing Water-Energy-Agriculture Nexus in Rajasthan” (The World Bank, January 2020).
99 Avinash Kishore, Tushaar Shah, and Nidhi Tewari, “Solar Irrigation Pumps: Farmers’ Experience and State Policy in Rajasthan,” Economic and Political Weekly 49 (March 8, 2014): 55–62.
100 Frank A. Ward and Manuel Pulido-Velazquez, “Water Conservation in Irrigation Can Increase Water Use,” Proceedings of the National Academy of Sciences 105, no. 47 (November 25, 2008): 18215–20, https://doi.org/10.1073/pnas.0805554105.
101 Factsheet | HGIC 1804 | Published: May 21 and 2008 | Print, “Landscape Irrigation Management Part 5: Irrigation Time of Day,” Home & Garden Information Center | Clemson University, South Carolina, accessed November 25, 2020, https://hgic.clemson.edu/factsheet/landscape-irrigation-management-part-5-irrigation-time-of-day/.
102 Shilp Verma, Neha Durga, and Tushaar Shah, “Solar Irrigation Pumps and India’s Energy–Irrigation Nexus,” Economic and Political Weekly 54 (January 12, 2019): 62–65.
103 Tushaar Shah et al., “Promoting Solar Power as a Remunerative Crop,” Economic and Political Weekly 52, no. 45 (November 11, 2017): 14–19; Meera Sahasranaman et al., “Solar Irrigation Cooperatives: Creating the Frankenstein’s Monster for India’s Groundwater,” Economic and Political Weekly 53 (May 26, 2018); Avinash Nair, “Gujarat: Solar CoOperative at Dhundi Village Sells Water Instead of Electricity | India News,The Indian Express,” The Indian Express, August 14, 2016, https://indianexpress.com/article/india/india-news-india/gujarat-solar-co-operative-at-dhundivillage-sells-water-instead-of-electricity-2974172/; Shilp Verma, Neha Durga, and Tushaar Shah, “Solar Irrigation Pumps and India’s Energy–Irrigation Nexus,” Economic and Political Weekly 54 (January 12, 2019): 62–65.
104 Rajasthan Electricity Regulatory Commission, “Final Order PM KUSUM 2020.”
105 J. S. Famiglietti, “The Global Groundwater Crisis,” Nature Climate Change 4, no. 11 (November 2014): 945–48, https://doi.org/10.1038/nclimate2425.
106 Amal Kar, “Agricultural Land Use in Arid Western Rajasthan: Resource Exploitation and Emerging Issues,” December 1, 2014; Gustav Olofsson, “Water Scarcity and Slow Violence: The Effects of Water Scarcity in Gansu, China and Rajasthan, India,” 2017, http://lup.lub.lu.se/student-papers/record/8909263; Chandni Singh, Henny Osbahr, and Peter Dorward, “The Implications of Rural Perceptions of Water Scarcity on Differential Adaptation Behaviour in Rajasthan, India,” Regional Environmental Change 18, no. 8 (December 1, 2018): 2417–32, https://doi.org/10.1007/s10113-018-1358-y; David Blakeslee, Ram Fishman, and Veena Srinivasan, “Way Down in the Hole: Adaptation to Long-Term Water Loss in Rural India,” American Economic Review 110, no. 1 (2020): 200–224.
107 Dinesh Kumar, Water Policy Science and Politics (Elsevier, 2018), https://doi.org/10.1016/C2017-0-02539-9.
108 M. Dinesh Kumar, Christopher A. Scott, and O. P. Singh, “Can India Raise Agricultural Productivity While Reducing Groundwater and Energy Use?,” International Journal of Water Resources Development 29, no. 4 (2013): 557–73.
109 “Personal Communication with Mohinder Gulati,” November 25, 2020.
110 “Water Commons Influencing Practice” (Anand, Gujarat, India: Foundation for Ecological Security, June 2016); Bryan Bruns, “Common Pools and Common Knowledge” (Foundation for Ecological Security, March 2016).
111 Gulati, Priya, and Bresnyan, “Grow Solar, Save Water, Double Farmer Income: An Innovative Approach to Addressing Water-Energy-Agriculture Nexus in Rajasthan.”
112 “Solar Manufacturers Extend Support to Govt’s Atma Nirbhar Bharat Abhiyan, Energy News, ET EnergyWorld,” accessed November 19, 2020, https://energy.economictimes.indiatimes.com/news/renewable/solar-manufacturersextend-support-to-govts-atma-nirbhar-bharat-abhiyan/76146564.
79
113 Utpal Bhaskar, “India Gets 10 GW Proposals for Setting up Solar Equipment Manufacturing Capacity,” accessed November 19, 2020, https://www.livemint.com/industry/energy/india-gets-10-gw-proposals-for-setting-up-solarequipment-manufacturing-capacity-11599569420346.html.
114 Uma Gupta, “India Could Have 20 GW More Solar Manufacturing
Pv Magazine India,” accessed November 19, 2020, https://www.pv-magazine-india.com/2020/10/08/20-gw-of-additional-solar-manufacturing-coming-up-inindia/.
115 Rishabh Jain, Arjun Dutt, and Kanika Chawla, “Scaling Up Solar Manufacturing to Enhance India’s Energy Security,” n.d., 34.
116 TERI, “Policy Paper on Solar PV Manufacturing in India: Silicon Ingot & Wafer - PV Cell - PV Module.”
117 Srikanta Tripathy, “ReNew Power Plans 2,000mw Solar Manufacturing Unit in Rajasthan | Jaipur News - Times of India,” Times of India, August 5, 2020, https://timesofindia.indiatimes.com/city/jaipur/renew-power-plans-2000mwsolar-mfg-unit-in-raj/articleshow/77360479.cms.
118 Jules Scully, “India Approves Multi-Billion Dollar Financing to Support Domestic Solar and Battery Manufacturing | PV Tech,” PV Tech, November 12, 2020, https://www.pv-tech.org/news/india-approves-multi-billion-dollarfinancing-to-support-domestic-solar-and-battery-manufacturing.
119 MNRE, “Current Status | Ministry of New and Renewable Energy, Government of India,” accessed November 19, 2020, https://mnre.gov.in/solar/current-status/.
120 Srikanta Tripathy, “ReNew Power Plans 2,000mw Solar Manufacturing Unit in Rajasthan | Jaipur News - Times of India,” Times of India, August 5, 2020, https://timesofindia.indiatimes.com/city/jaipur/renew-power-plans-2000mwsolar-mfg-unit-in-raj/articleshow/77360479.cms.
121 The larger upper bound compared to the lower bound is due to the fact that Rajasthan currently only makes up 15% of total solar capacity in India despite having targets set to 30% of India’s total capacity. Thus, it is more likely that Rajasthan’s rate of installing solar capacity relative to the rest of India will continue to increase.
122 Ayush Verma, “Govt in Favour of Domestic Solar Manufacturing, Market Not so Much,” Saur Energy International, accessed November 25, 2020, https://www.saurenergy.com/solar-energy-news/govt-in-favour-of-domestic-solarmanufacturing-market-not-so-much.
123 MNRE, “Memorandum: Implementation of CPSU Scheme Phase-II for Setting up 12 GW Solar PV Power Projects,” April 13, 2020, https://www.eqmagpro.com/implementation-of-cpsu-scheme-phase-ii-for-setting-up-12gw-solar-pv-power-projects/.
124 World Bank, “India Project Update: Grid Connected Rooftop Solar Photovoltaic Program,” World Bank, accessed November 25, 2020, https://www.worldbank.org/en/results/2019/02/27/grid-connected-rooftop-solarphotovoltaic-project.
125 Jain, Dutt, and Chawla, “Scaling Up Solar Manufacturing to Enhance India’s Energy Security.”
126 TERI, “Policy Paper on Solar PV Manufacturing in India: Silicon Ingot & Wafer - PV Cell - PV Module.”
127 MNRE, “Memorandum: Guidelines for Implementation of PM-KUSUM,” July 22, 2019.
128 MNRE.
129 “Design, Survey, Supply, Installation, Testing, Commissioning & 5 Years Comprehensive Maintenance of Distributed
Grid Connected Solar PV Systems for Solarization of Grid Connected Agriculture Consumers under ‘KUSUM
Scheme - Component C’” (Ajmer Vidyut Vitran Nigam Limited), accessed November 21, 2020, https://energy.rajasthan.gov.in/content/dam/raj/energy/avvnl/pdf/Tender/Project/TN84/Upload_RFP_KUSUM_C_TN84.pdf.
130 “Design, Survey, Supply, Installation, Testing, Commissioning & 5 Years Comprehensive Maintenance of Distributed Grid Connected Solar PV Systems for Solarization of Grid Connected Agriculture Consumers under ‘KUSUM
Scheme - Component C.’”
131 MNRE, “Memorandum: Guidelines for Implementation of PM-KUSUM,” July 22, 2019.
132 “Design, Survey, Supply, Installation, Testing, Commissioning & 5 Years Comprehensive Maintenance of Distributed Grid Connected Solar PV Systems for Solarization of Grid Connected Agriculture Consumers under ‘KUSUM
Scheme - Component C.’”
133 “Product and Performance Warranty Card” (Adani Solar), accessed November 21, 2020, https://www.adanisolar.com/-/media/Project/AdaniSolar/Media/Downloads/Downloads/WarrantyDocument/Warranty_card.pdf.
134 “Guarantee Replacement Repair Conditions Inverters EU” (Delta Electronics, August 2019), https://solarsolutions.delta-
80
–
emea.com/downloads/Guarantee%20Replacement%20Repair%20Conditions%20Inverters%20EU%20August%202 019_EN.pdf.
135 MNRE, “Memorandum: Guidelines for Implementation of PM-KUSUM,” July 22, 2019.
136 RRECL Request for Selection (RfS)
137 “List of Suryamitra Training Centres for FY 2019-20,” accessed November 21, 2020, https://nise.res.in/wpcontent/uploads/2020/01/Suryamitra-TCs-Add-FY-2019-20.pdf.
138 “List of Suryamitra Training Centres for FY 2019-20.”
139 “N.I.S.E - Suryamitra Skill Development Programme,” accessed November 21, 2020, https://suryamitra.nise.res.in/info/About-Suryamitra.html.
140 “Best College for Mtech in Solar Energy in Jaipur, Rajasthan,” accessed November 21, 2020, https://www.amity.edu/jaipur/mtech-solar-and-alternative-energy.
141 Mohammed Iqbal, “‘Solar Mamas’ Power up Women’s Development,” The Hindu, November 12, 2017, sec. Women in Action, https://www.thehindu.com/specials/women-in-action/solar-mamas-power-up-womensdevelopment/article20016526.ece.
142 Bryan Bruns, “Common Pools and Common Knowledge,” March 2016.
143 Bryan Bruns, “Common Pools and Common Knowledge” (Foundation for Ecological Security, March 2016).
144 “Water Commons Influencing Practice” (Anand, Gujarat, India: Foundation for Ecological Security, June 2016).
145 “Managing India’s Clean Energy Waste: A Roadmap for the Solar and Storage Industry,” accessed December 6, 2020, https://www.teriin.org/article/managing-indias-clean-energy-waste-roadmap-solar-and-storage-industry.
146 “Managing India’s Clean Energy Waste: A Roadmap for the Solar and Storage Industry,” accessed December 6, 2020, https://www.teriin.org/article/managing-indias-clean-energy-waste-roadmap-solar-and-storage-industry.
147 Arunabha Ghosh et al., “Solar Power Jobs: Exploring the Employment Potential in India’s Grid-Connected Solar Market” (Council on Energy, Environment and Water and Natural Resource Defense Council, August 2014), https://www.nrdc.org/sites/default/files/renewable-energy-solar-jobs-report.pdf.
148 Gambhir and Dixit, “Solar Agricultural Feeders in Maharashtra.”
149 Srikanta Tripathy, “ReNew Power Plans 2,000mw Solar Manufacturing Unit in Rajasthan | Jaipur News - Times of India,” Times of India, August 5, 2020, https://timesofindia.indiatimes.com/city/jaipur/renew-power-plans-2000mwsolar-mfg-unit-in-raj/articleshow/77360479.cms.
150 “State Govt to Give Land to Landless Farmers,” Hindustan Times, November 11, 2016, https://www.hindustantimes.com/jaipur/state-govt-to-give-land-to-landless-farmers/storylfWYg5BErWxbVfW4qFd6RO.html.
151 “Amid An Important Farmer Debate, Don’t Forget the Woes of India’s Landless Workers,” The Wire, accessed November 30, 2020, https://thewire.in/agriculture/landless-farmers-rural-workers.
152 Avinash Kishore, Tushaar Shah, and Nidhi Tewari, “Solar Irrigation Pumps: Farmers’ Experience and State Policy in Rajasthan,” Economic and Political Weekly 49 (March 8, 2014): 55–62.
153 Commisionerate of Agriculture, “Rajasthan Agricultural Statistics at a Glance 2017-2018.”
154 Abhishek Jain and Tauseef Shahidi, “Adopting Solar for Irrigation: Farmers Perspectives from Uttar Pradesh Report” (Council on Energy, Environment and Water, January 2018), http://www.ceew.in/sites/default/files/CEEWAdopting-Solar-for-Irrigation-Farmers-Perspectives-from-UP-Report-17Jan18.pdf.
155 “Districtwise Literacy Rate of Rajasthan,” Government of Rajasthan, Literacy & Continuing Education, accessed November 19, 2020, https://education.rajasthan.gov.in/content/raj/education/literacy-and-continuingeducation/en/Literacy_Scenario/Districtwise_Literacy_Rate_of_Rajasthan.html.
156 Jain and Shahidi, “Adopting Solar for Irrigation: Farmers Perspectives from Uttar Pradesh Report.”
157 Soumya Sarkar, “India’s Tribal Farmers Tap Solar Irrigation to Cut Migration,” Reuters, July 27, 2020, https://www.reuters.com/article/us-india-solar-climatechange-water-trfn-idUSKCN24S1HS.
158 “Tribes of Rajasthan,” RajRAS - Rajasthan RAS (blog), November 29, 2016, https://www.rajras.in/tribes-ofrajasthan/.
159 Kar, “Agricultural Land Use in Arid Western Rajasthan.”
160 Olofsson, “Water Scarcity and Slow Violence.”
161 National Renewable Energy Laboratory, “PVWatts Calculator,” accessed November 20, 2020, https://pvwatts.nrel.gov/pvwatts.php.
162 Gulati, Priya, and Bresnyan, “Grow Solar, Save Water, Double Farmer Income: An Innovative Approach to Addressing Water-Energy-Agriculture Nexus in Rajasthan.”
81
163 Rajasthan Renewable Energy Corporation. 2019. “Annexure A. Details of All Rural 33 KV Sub-Stations for Solar Power Plants Installation by the Farmer under KUSUM Component-A: Jaipur Discom.” In Request for Selection For Selection of Developers for Setting up of Decentralized Solar PV Plants Each of 0.5 MW to 2 MW (AC) Aggregating to Total 113.5MW Capacity Be Installed and Connected at Discom’s 33/11kV Substations in Rajasthan.
https://energy.rajasthan.gov.in/content/dam/raj/energy/rrecl/pdf/Home%20Page/1.%20JVVNL%20List%20for %20RUVN%20for%20Component-A%20(1).pdf.
164 Rajasthan Renewable Energy Corporation. 2019. “Annexure B. Details of All Rural 33 KV Sub-Stations for Solar Power Plants Installation by the Farmer under KUSUM.” In Request for Selection For Selection of Developers for Setting up of Decentralized Solar PV Plants Each of 0.5 MW to 2 MW (AC) Aggregating to Total 113.5MW Capacity Be Installed and Connected at Discom’s 33/11kV Substations in Rajasthan
https://energy.rajasthan.gov.in/content/dam/raj/energy/rrecl/pdf/Home%20Page/2.%20AVVNL%20List%20for %20RUVN%20for%20Component-A%20(1).pdf.
165 Rajasthan Renewable Energy Corporation. 2019. “Annexure C. Details of All Rural 33 KV Sub-Stations for Solar Power Plants Installation by the Farmer under KUSUM (JdVVNL).” In Request for Selection For Selection of Developers for Setting up of Decentralized Solar PV Plants Each of 0.5 MW to 2 MW (AC) Aggregating to Total 113.5MW Capacity Be Installed and Connected at Discom’s 33/11kV Substations in Rajasthan https://energy.rajasthan.gov.in/content/dam/raj/energy/rrecl/pdf/Home%20Page/3.%20JdVVNL%20List%20for %20RUVN%20for%20Component-A%20(1).pdf.
166 Rajasthan Renewable Energy Corporation. 2019. “Annexure A. Details of All Rural 33 KV Sub-Stations for Solar Power Plants Installation by the Farmer under KUSUM Component-A: Jaipur Discom.” In Request for Selection For Selection of Developers for Setting up of Decentralized Solar PV Plants Each of 0.5 MW to 2 MW (AC) Aggregating to Total 113.5MW Capacity Be Installed and Connected at Discom’s 33/11kV Substations in Rajasthan
https://energy.rajasthan.gov.in/content/dam/raj/energy/rrecl/pdf/Home%20Page/1.%20JVVNL%20List%20for %20RUVN%20for%20Component-A%20(1).pdf.
167 Rajasthan Renewable Energy Corporation. 2019. “Annexure B. Details of All Rural 33 KV Sub-Stations for Solar Power Plants Installation by the Farmer under KUSUM.” In Request for Selection For Selection of Developers for Setting up of Decentralized Solar PV Plants Each of 0.5 MW to 2 MW (AC) Aggregating to Total 113.5MW Capacity Be Installed and Connected at Discom’s 33/11kV Substations in Rajasthan.
https://energy.rajasthan.gov.in/content/dam/raj/energy/rrecl/pdf/Home%20Page/2.%20AVVNL%20List%20for %20RUVN%20for%20Component-A%20(1).pdf.
168 Rajasthan Renewable Energy Corporation. 2019. “Annexure C. Details of All Rural 33 KV Sub-Stations for Solar Power Plants Installation by the Farmer under KUSUM (JdVVNL).” In Request for Selection For Selection of Developers for Setting up of Decentralized Solar PV Plants Each of 0.5 MW to 2 MW (AC) Aggregating to Total 113.5MW Capacity Be Installed and Connected at Discom’s 33/11kV Substations in Rajasthan
https://energy.rajasthan.gov.in/content/dam/raj/energy/rrecl/pdf/Home%20Page/3.%20JdVVNL%20List%20for %20RUVN%20for%20Component-A%20(1).pdf.
169 Rajasthan Electricity Regulatory Commission. 2020. “Petition No. 1757/2020.”
170 Iqbal, Mohammed. 2020. “Rajasthan First to Complete Farmers’ Selection for Solar Plants.” The Hindu, July 10, 2020, sec. Other States. https://www.thehindu.com/news/national/other-states/rajasthan-first-to-completefarmers-selection-for-solar-plants/article32037215.ece
171 Rajasthan Electricity Regulatory Commission. 2020. “Petition No. RERC 1541/19, 1542/19, 1543/19.”
172 Rajasthan Electricity Regulatory Commission. 2020. “Petition No: RERC/1587/19.”
173 Rajasthan Electricity Regulatory Commission. 2020. “Petition No. RERC 1541/19, 1542/19, 1543/19.”
174T Paranjoth and H.K. Mishra, “Dhundi Solar Pump Irrigators’ Cooperative | International Cooperative AllianceAsia and Pacific” (International Co-operative Alliance), accessed November 22, 2020, https://www.icaap.coop/icanews/dhundi-solar-pump-irrigators-cooperative.
175 Shah et al., “Promoting Solar Power as a Remunerative Crop.”
176 Kavita Kanan Chandra, “Two Years after It Was Launched, the World’s First Solar Cooperative Has Transformed Gujarat’s Dhundi Village,” The Hindu, April 14, 2018, sec. Society, https://www.thehindu.com/society/two-yearsafter-it-was-launched-the-worlds-first-solar-cooperative-has-transformed-gujarats-dhundi-village/article23528444.ece.
177 Think Change India, “World’s First Solar Cooperative Has Transformed This Gujarat Village into a Land of ‘Solar Farmers,’” YourStory.com, April 17, 2018, https://yourstory.com/2018/04/dhundi-village-gujarat-solar-powered.
82
178 Avinash Nair, “Gujarat: Solar Co-Operative at Dhundi Village Sells Water Instead of Electricity | India News,The Indian Express,” The Indian Express, August 14, 2016, https://indianexpress.com/article/india/india-newsindia/gujarat-solar-co-operative-at-dhundi-village-sells-water-instead-of-electricity-2974172/.
179 Maulik Pathak, “Gujarat Farmers Can Now Produce, Sell Solar Power under Suryashakti Kishan Yojana,” mint, June 23, 2018, https://www.livemint.com/Industry/Yo4kUy3NeBkdU293IJ3rMO/Gujarat-farmers-can-now-producesell-solar-power-under-Sury.html.
180 Pathak.
181 Maulik Pathak, “Cloud over SKY: Gujarat Scales down Pilot Solar Project | Ahmedabad News - Times of India,” Times of India, March 15, 2019, https://timesofindia.indiatimes.com/city/ahmedabad/cloud-over-sky-state-scalesdown-pilot-solar-project/articleshow/68416667.cms.
182 Nair, “Gujarat: Solar Co-Operative at Dhundi Village Sells Water Instead of Electricity | India News,The Indian Express.”
183 Mukhya et al., “Agriculture-Cum-Solar Farm Scheme in NCT of Delhi.”
184 Pretika Khanna, “Kejriwal Govt Approves Scheme for Farmers to Earn by Leasing Land to Solar Power Firms,” Mint, July 24, 2018, https://www.livemint.com/Politics/xDY0nbEUJ2K8Zom6ageoQP/Kejriwal-govt-approvesscheme-for-farmers-to-earn-by-leasing.html.
185 Mukhya et al., “Agriculture-Cum-Solar Farm Scheme in NCT of Delhi.”
186 Shah, “Kick-Starting the Kisan Urja Suraksha Evam Utthaan Mahabhiyan.”
187 ushaar Shah et al., “Promoting Solar Power as a Remunerative Crop,” Economic and Political Weekly 52, no. 45 (November 11, 2017): 14–19; Nair, “Gujarat: Solar Co-Operative at Dhundi Village Sells Water Instead of Electricity | India News,The Indian Express.”
188 Sujith Koonan, “Legal Regime Governing Groundwater,” Water Law for the Twenty-First Century: National and International Aspects of Water Law Reform in India, ed. P. Cullet, Routledge, 182, 185 (2010).
189 Indian Easements Act 1882 § 7, Illustration (g); see also Koonan, supra note 188, at 185.
190 Philippe Cullet and Sujith Koonan, eds., “Protection and Regulation of Groundwater,” Water Law in India: An Introduction to Legal Instruments, 2nd ed., Oxford University Press, 342 (2017).
191 Sujith Koonan. This rule, termed the ‘absolute dominion’ rule, derives from English common law and entered the Indian legal system with the passage of the Indian Easements Act 1882. Contrast India’s approach with that of United States courts which, for the most part, have shifted to a ‘reasonable use’ rule. This rule may aid water conservation by placing limits, even if admittedly imprecise, on the amount of groundwater landowners can extract. For more on the differences between the English and Indian regime on the one hand, and the American regime on the other, see Jesse J. Richardson, “Postcolonial Evolution of Water Rights in India and the United States,” Land Policies in India: Promises, Practices and Challenges, 52–54 (2017).
192 Indian Constitution, Art. 246 (“Seventh Schedule”), List II State List § 17; Philippe Cullet and Sujith Koonan, eds., “Regulation of Water: General Instruments and Issues,” Water Law in India: An Introduction to Legal Instruments, 2nd ed., Oxford University Press, 70 (2017).
193 Model Groundwater (Sustainable Management) Act 2016.
194 Cullet and Koonan.
195 Cullet and Koonan.
196 Rajasthan Ground Water (Rational Use and Management) Act 2005, §§ 4(15)(1)–(5), 5(20)(1).s
197 Sujith Koonan, “Groundwater Legal Regime in India: Towards a Paradigm Shift,” Governance (2016).
198 International Energy Agency, “Agricultural Demand Side Management (AgDSM) Programme,” IEA Policies Database, accessed November 21, 2020, https://www.iea.org/policies/7460-agricultural-demand-side-managementagdsm-programme.
199 Ministry of Power, Government of India, “Best Practices Adopted by Rajasthan to Achieve UDAY Goals,” https://smartnet.niua.org/content/95e28202-295b-420f-a0ec-5db52ee1b9a2.
200 RAJRAS, “Important Government Schemes in Rajasthan,” Important Government Schemes in Rajasthan, October 2017, https://www.rajras.in/wp-content/uploads/2017/10/Important-Government-Schemes-in-Rajasthan.pdf.
83