The Effects of Free Trade Agreements with Asia
Report to the Peruvian Ministry of Foreign Trade and Tourism (MINCETUR)
April 2023

PERU
2

Report to the Peruvian Ministry of Foreign Trade and Tourism (MINCETUR)
April 2023
Bishal Belbase
Gregory Kearney
Christian Keith
Sharon Lai
Abdul Samad Nizamani
Jimmy O’Donnell
Odette Overton
Patrick Ryan
Daniel Vonarburg
Kevin Ward
Dr. Julio Guzmán
We sincerely thank Roberto Helbert Sánchez Palomino, former Minister of External Trade and Tourism, MINCETUR; Kurt Burneo, former Minister of Economy and Finance; Alex Alonso Contreras Miranda, former Vice Minister of Economy, Minister of Economy and Finance; Gerardo Antonio Meza Grillo, Director of the Directorate of Asia, Oceania and Africa, MINCETUR; Francisco Sagasti, former President of Peru; Luis Guillermo Solis, former President of Costa Rica; Edgar Vazquez, Director of Research, ADEX (Asociación de Exportadores); Daniel Olivares, former Congressperson; Silvia Hooker, International Affairs Manager, SNI (Sociedad Nacional de Industrias); and Efrain Guadarrama Pérez, General Director, American Regional Organizations and Mechanisms (Mexico).
The views expressed in this report are those of the authors and do not necessarily reflect the views of Princeton University or the School of Public and International Affairs.
Bishal Belbase is a second-year Master in Public Affairs candidate studying economics and public policy with a focus on international development and trade. Before Princeton, he worked with Karma Health, a healthcare non-profit based in rural Nepal, where he oversaw programs and government partnerships.
Gregory Kearney is a second-year Master in Public Affairs candidate studying economics and public policy. Previously, he worked as a research analyst at the Hoover Institution, as a research economist at the Council of Economic Advisers at the White House, and as a consultant at Deloitte & Touche on the Global Transfer Pricing team in New York. His research areas of focus include state taxation, public pension financing, and infrastructure investment.
Christian Keith is a second-year Master in Public Affairs candidate studying economics and public policy. Prior to coming to Princeton, he worked on the fiscal and budget policy team at the Center on Budget and Policy Priorities working on researching and promoting redistributive policies within the tax and budget system. He also has non-profit community development experience working mainly in affordable housing and food insecurity.
Sharon Lai is a second-year Master in Public Affairs candidate studying economics and public policy. Prior to Princeton, she worked for several years in macroeconomic policy in Australia, conducting research and analysis on labor markets, housing markets, financial stability, and banking system issues.
Abdul Samad Nizamani is a second-year Master in Public Affairs candidate studying International Development. He belongs to the Pakistan Administrative Service and has worked in District Administration in various regions of Pakistan. He is interested in trade policy and how international trade can be a tool for sustainable growth for developing countries.
Jimmy O’Donnell is a second-year Master in Public Affairs candidate studying economics and public policy. Prior to attending Princeton, he spent a year as a Fulbright research grantee, evaluating Finland’s universal basic income experiment. In addition, Jimmy worked in the Economic Studies program at the Brookings Institution where he researched U.S. economic policy, including place-based strategies, tax reforms, and labor market institutions.
Odette Overton is a second-year Master in Public Affairs candidate studying democratic reforms and electoral politics. Prior to Princeton, she worked for the California State Senate where she primarily staffed budget and data policy issues, including the state’s $134 billion economic recovery package in response to the COVID-19 pandemic. Odette also has extensive experience with political campaigns, applied behavioral research, and litigation.
Patrick Ryan is a second-year Master in Public Affairs student studying economics and public policy, with a focus on international financial and macroeconomic policy. Before Princeton, he worked at the International Monetary Fund where he advised and trained member countries on public financial management and macrofiscal policy issues.
Daniel Vonarburg is a second-year Master in Public Affairs student studying economics and public policy. He is interested in policy solutions to emerging technologies in the global financial sector. Prior to Princeton, Daniel served as a bank examiner at the Federal Deposit Insurance Corporation (FDIC), where he examined financial risks and assessed compliance with federal regulations in U.S. banks.
Kevin Ward is a second-year Master in Public Affairs candidate studying economics and public policy. Prior to attending Princeton, he worked at The Palladium Group where he advised ministries of health in low- and middle-income countries and their development partners on efficient and equitable financing of health sector investments.
Peru has pursued a highly liberalized international trade policy since the 1990s, through a combination of unilateral tariff reductions, bilateral agreements, and multilateral agreements. To date, Peru has signed 21 free trade agreements and registers a 1.1% advalorem average tariff, one of the lowest tariffs in the world. While free trade has had substantial benefits for Peru, we believe that under current circumstances, it requires a reprioritization of national trade policy.
With near-zero tariffs on all goods and services exported from Peru to the world’s largest economies, future tariff reductions may have a limited impact on Peru’s trade flows. Our analysis confirms that regional trade agreements signed from 1990 to 2018 have significantly increased bilateral trade flows. However, non-tariff costs –which have long represented the vast majority of bilateral trade costs between Peru and its trading partners – have significantly grown as a share of overall trade costs. Some non-tariff barriers can be addressed as part of trade negotiations, but Peru can also reduce its non-tariff trade costs with public investments in transportation infrastructure, trade facilitation initiatives, trade-related administrative simplification, and technical assistance to help Peruvian firms become more competitive to enter new overseas markets.
In addition, export portfolio diversification is another way of neutralizing the decreasing marginal benefits of further trade liberalization. According to our Computable General Equilibrium (CGE) Model analysis, over time cumulative bilateral trade liberalization is reinforcing Peruvian comparative advantages in low labor-skilled sectors such as agriculture, and intensifying the destruction of mediumlabor skilled industries such as textiles and machinery equipment, where the economy is not competitive.
impacts of future agreements may be limited. In our CGE analysis, none of the three agreements has a large impact on Peru’s GDP or its export volume. The overall effect of the Pacific AllianceSouth Korea agreement is muted because Peru, Chile, and Colombia already have bilateral agreements with South Korea and because limited intra-Alliance integration dulls the impact of a Mexico-South Korea agreement on Peru. In the case of the two prospective ASEAN agreements, trade complementarity between Peru and these countries is weaker than it is with developed economies like South Korea. Moreover, Peru already has agreements with four ASEAN members: Brunei, Singapore, Thailand, and Vietnam.
Despite the limited overall effects of prospective trade agreements, the anticipated distributional effects will be important. The three agreements are expected to have relatively large negative effects on output and employment in light and heavy manufacturing industries (textiles, leather, machinery) and relatively large positive effects in the agriculture sector. These sectoral shifts are consistent with Peru’s static comparative advantage with other trading partners. Whether Peru should embrace a further shift toward agriculture and away from manufacturing is a matter for Peru’s broader economic development agenda. It is important to note that sectoral job losses have been important drivers of inequality, poverty, and social unrest, though this phenomenon has not been confined to disadvantaged sectors.
The future of trade policy and export promotion in Peru lies in addressing non-tariff trade costs. To ensure that Peru’s trade policy continues to increase exports while fulfilling other policy goals, we propose several recommendations for MINCETUR:
Prospective trade agreements between PeruASEAN, Pacific Alliance-ASEAN, and Pacific Alliance-South Korea confirm that the overall
1. Align trade policy with economic development policy. MINCETUR should ensure that further tariff reductions and other elements of trade agreements promote the growth of industries that contribute to economic development.
2. Promote exports and investment by reducing non-tariff trade costs. MINCETUR should reduce non-tariff costs by negotiating reductions in bilateral non-tariff barriers, investing in physical and policy infrastructure (e.g., a data protection policy), and providing technical assistance to help existing and potential exporters enter new markets through an independent and technicaloriented State agency.
3. Ease employment transition for exposed sectors. MINCETUR can negotiate gradual tariff reduction schedules in sensitive industries in prospective trade agreements. Workers from affected sectors could also be included as beneficiaries in already existing State programs dedicated to the training and repositioning of
workers who lose their jobs due to FTAs.
4. Safeguard against unfair competition. MINCETUR should negotiate for prospective trade agreements to include penalties for employing unfair labor standards, including child labor, with clear language on enforcement.
5. Establish a stakeholder committee to provide inputs for potential trade agreements. MINCETUR should establish a stakeholder committee to receive feedback and recommendations from industry participants and gain more credibility, legitimacy, and a more comprehensive assessment of the impact of each trade agreement.
Since 1990, Peru has pursued trade liberalization as part of a broader agenda of economic liberalization. To bring down the inflation of the 1980s, the Government of Peru embraced a full package of neoliberal reforms, including abandoning price controls, reducing subsidies, floating the exchange rate, privatizing stateowned enterprises, liberalizing capital flows, and cutting import tariffs. Despite causing shortterm pain, these reforms did succeed in restoring macroeconomic stability to Peru.
Peru’s unilateral import tariff reductions have simplified the domestic politics of free trade. With many voters who link tariff reductions to macroeconomic stability and fewer importcompeting industries to lobby for protectionism, Peru’s Ministry of Foreign Trade and Tourism has been firmly committed to bilateral and multilateral trade liberalization. To date, Peru has signed 21 trade agreements with countries representing 98% of global economic output. As tariffs have fallen, Peru’s exports and imports have risen, and trade with countries under trade agreements accounts for over 90 percent of Peruvian exports.1 Peru is now one of the world’s most open economies, with a 1.1% ad-valorem average tariff, one of the lowest in the world.2
Since the early 1990s, the average tariff rates applied to Peruvian imports and exports have steadily declined. This liberalization has been supported by the negotiation of bilateral and multilateral trade agreements with countries across the Americas, Asia, and Europe. Currently, Peru is a member of 21 active regional trade agreements (Figure 1).3,4
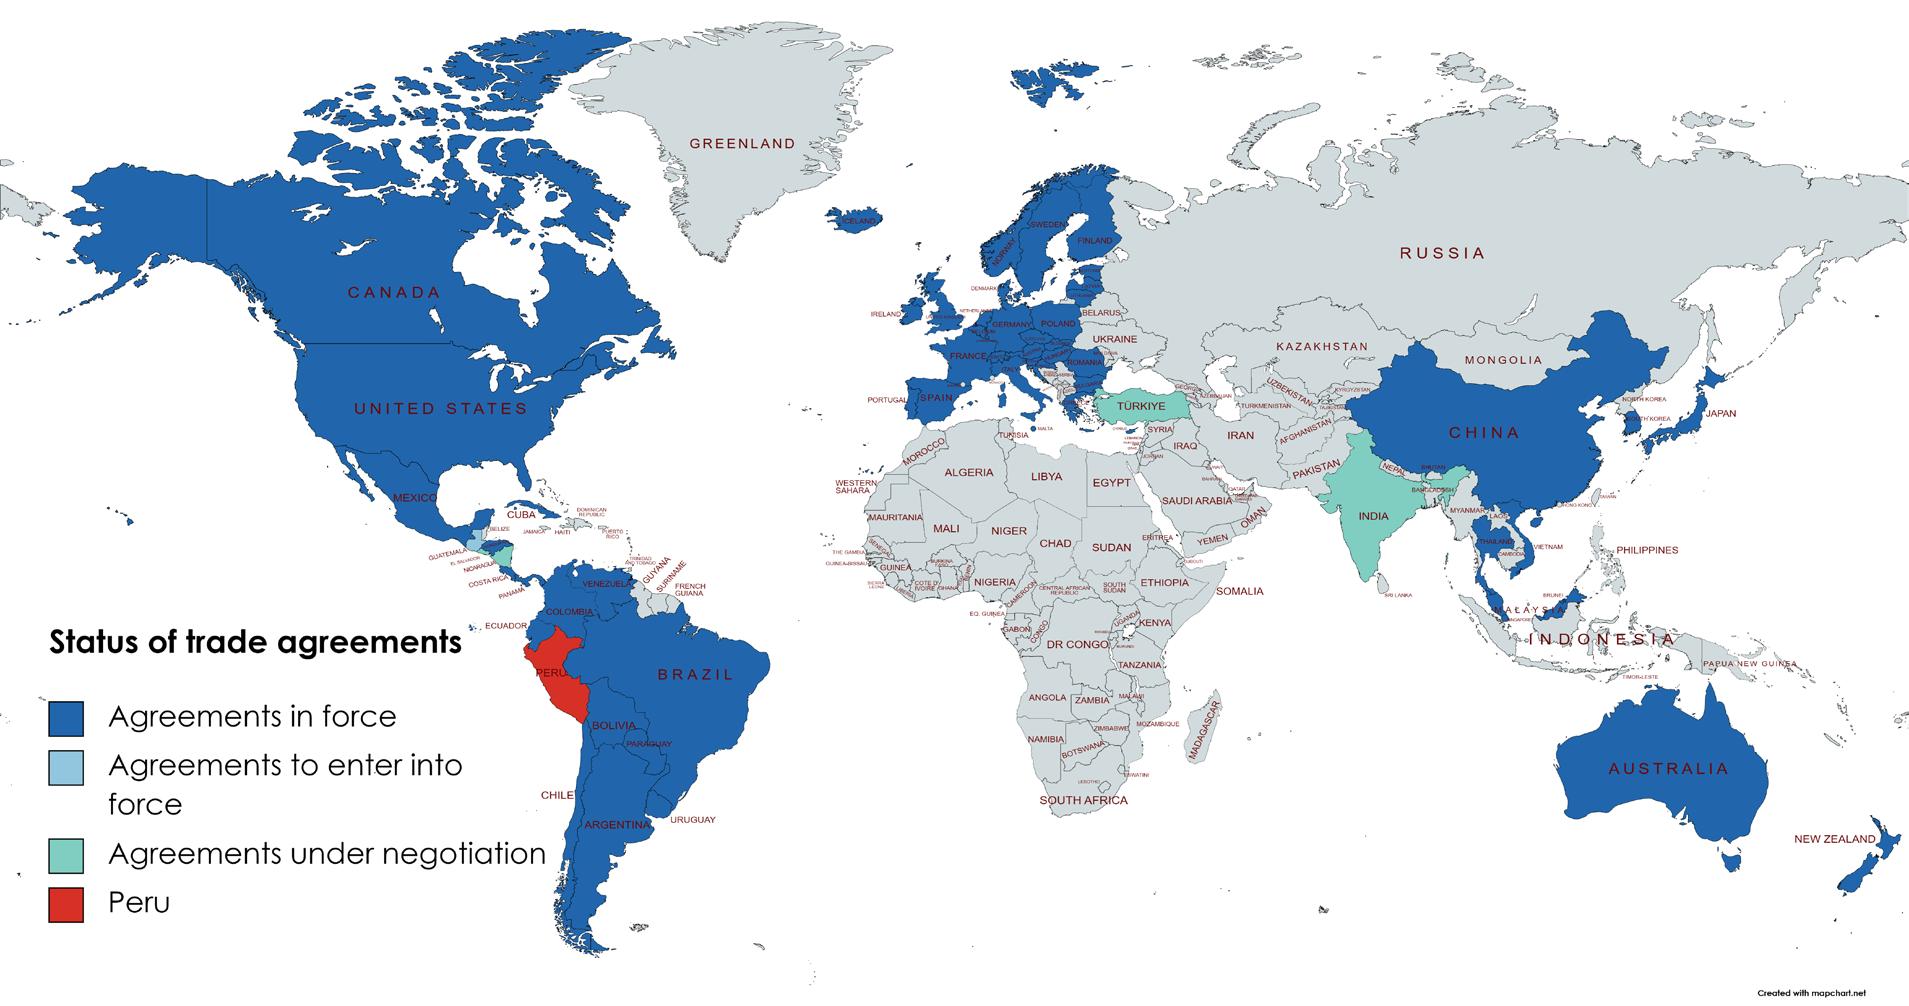
Peru became a founding member of the World Trade Organization on January 1, 1995 (having been a member of the General Agreement on Tariffs and Trade since 1951). It is also a founding member of the Andean Community of Nations (1969) with Bolivia, Colombia, and Ecuador; the Pacific Alliance (2014) with Chile, Colombia, and Mexico; and the Comprehensive and Progressive Agreement for Trans-Pacific Partnership (2018) with Australia, Brunei, Canada, Chile, Japan, Malaysia, Mexico, New Zealand, Singapore, and Vietnam. Peru also has agreements with MERCOSUR (a trade bloc composed of Brazil, Argentina, Paraguay, and Uruguay), the European Union, and the European Free Trade Association (Iceland, Liechtenstein, Norway, and Switzerland).
Source: MINCETUR
The Pacific Alliance was established in April 2011, with the objectives of increasing trade, promoting integration, and fostering cooperation between Peru, Chile, Colombia, and Mexico - four market-oriented Pacific Rim countries in Latin America - to engage with Asia in a more effective manner. This free trade area represents a population of 234 million people, accounts for 42 percent of Latin America’s GDP, and is the sixth largest exporter globally.5 Since its formation, it has been able to achieve the elimination of tariffs on 98 percent of goods and services, visa-free travel, and shared embassies among the member states.
In response to stalled multilateral negotiations at the WTO Doha Development Round, Peru began a series of bilateral trade negotiations in the 2000s that culminated in trade agreements with its largest trade partners, including the
United States (2009), Canada (2009), China (2010), South Korea (2011), and Japan (2012). Peru’s other bilateral agreements are with Cuba, Chile, Singapore, Thailand, Japan, Panama, Costa Rica, Venezuela, Brazil, Honduras, Australia, Guatemala, and the United Kingdom.
Trade flows have responded to Peru’s increasing liberalization. From 1990 to 2021, Peru’s exports rose from $9 billion to $49 billion, while imports rose from $7 billion to $56 billion (2015 USD). Peru’s trade openness - calculated as the sum of exports and imports as a share of GDP - has increased from 27 percent in 1990 to 56 percent in 2021, comparable to the average for Latin America & Caribbean (53 percent).6 Among Pacific Alliance members, Mexico has the highest trade openness (82 percent), followed by Chile (64 percent), Peru, and then Colombia (41 percent) (Figure 2).
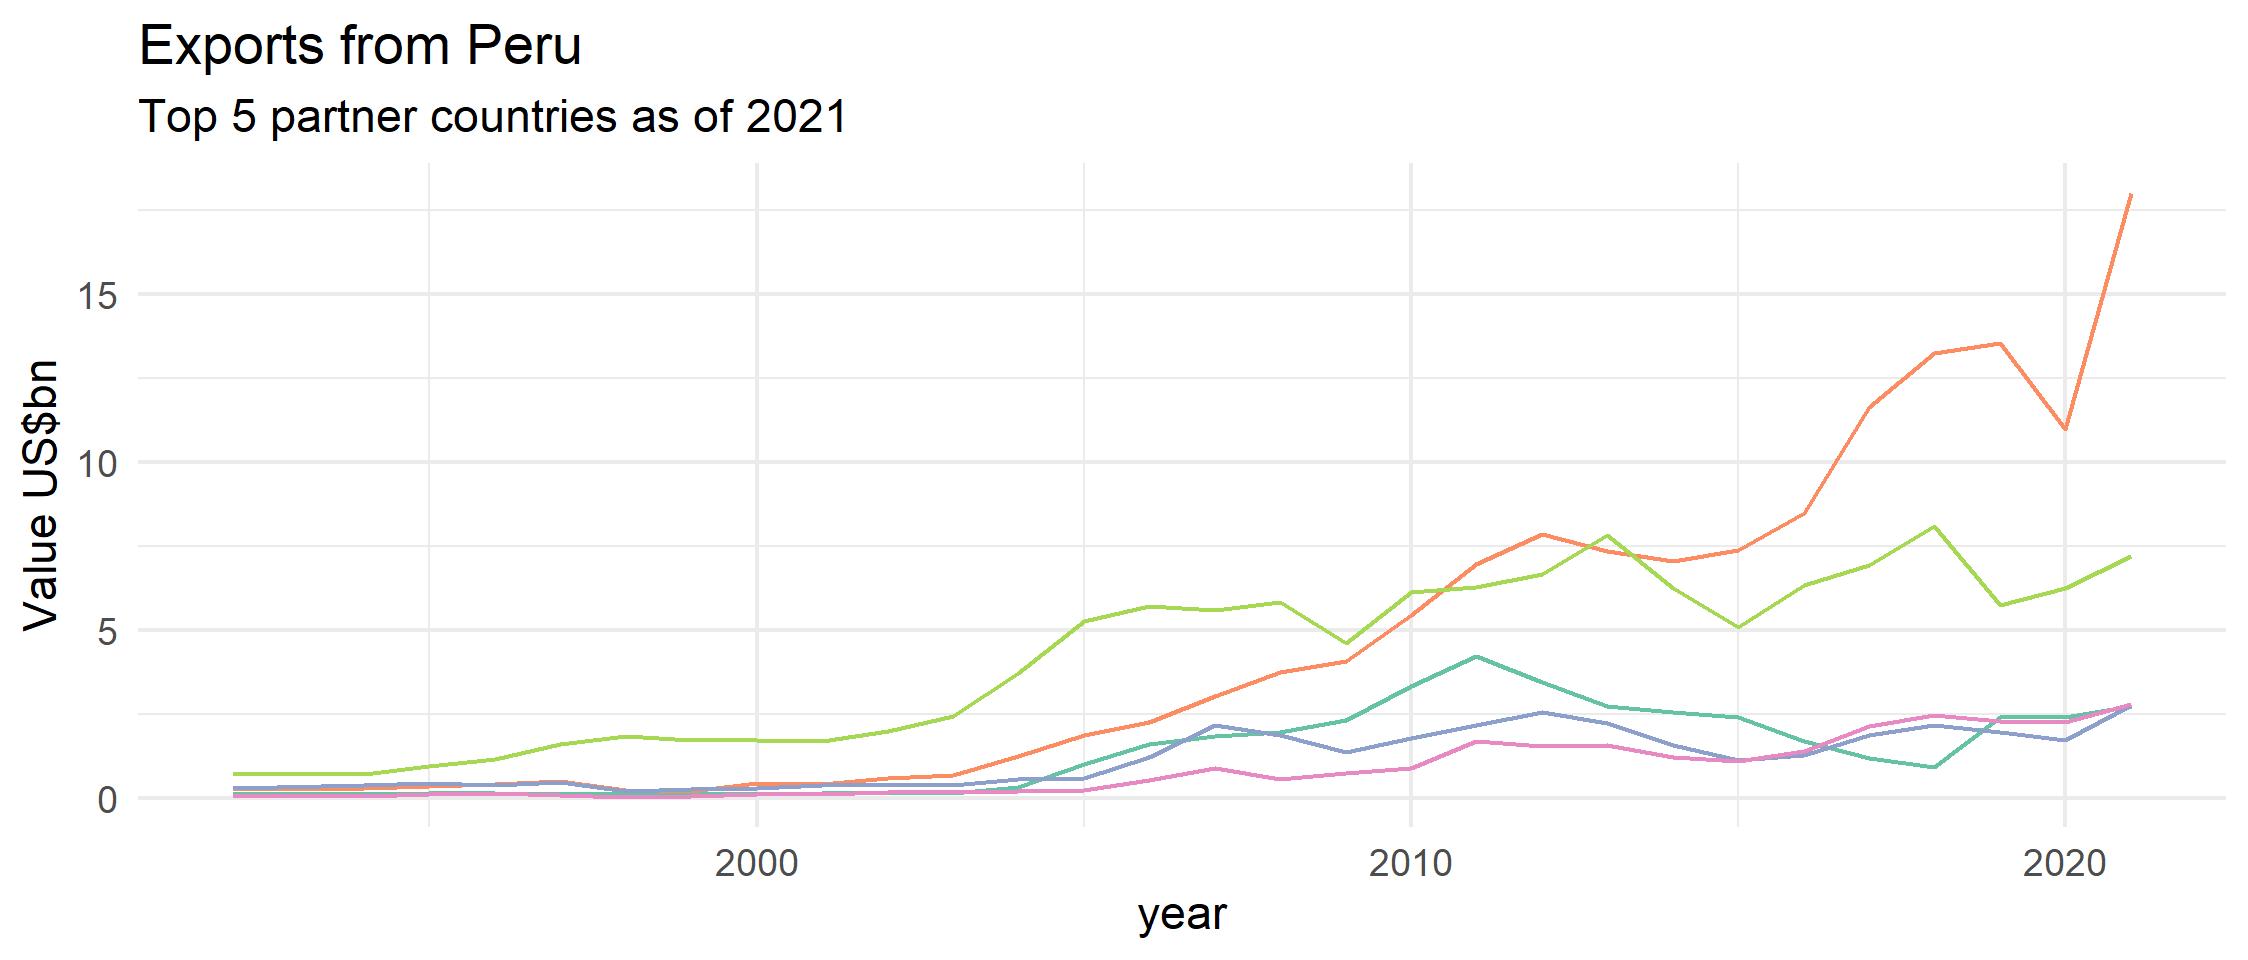
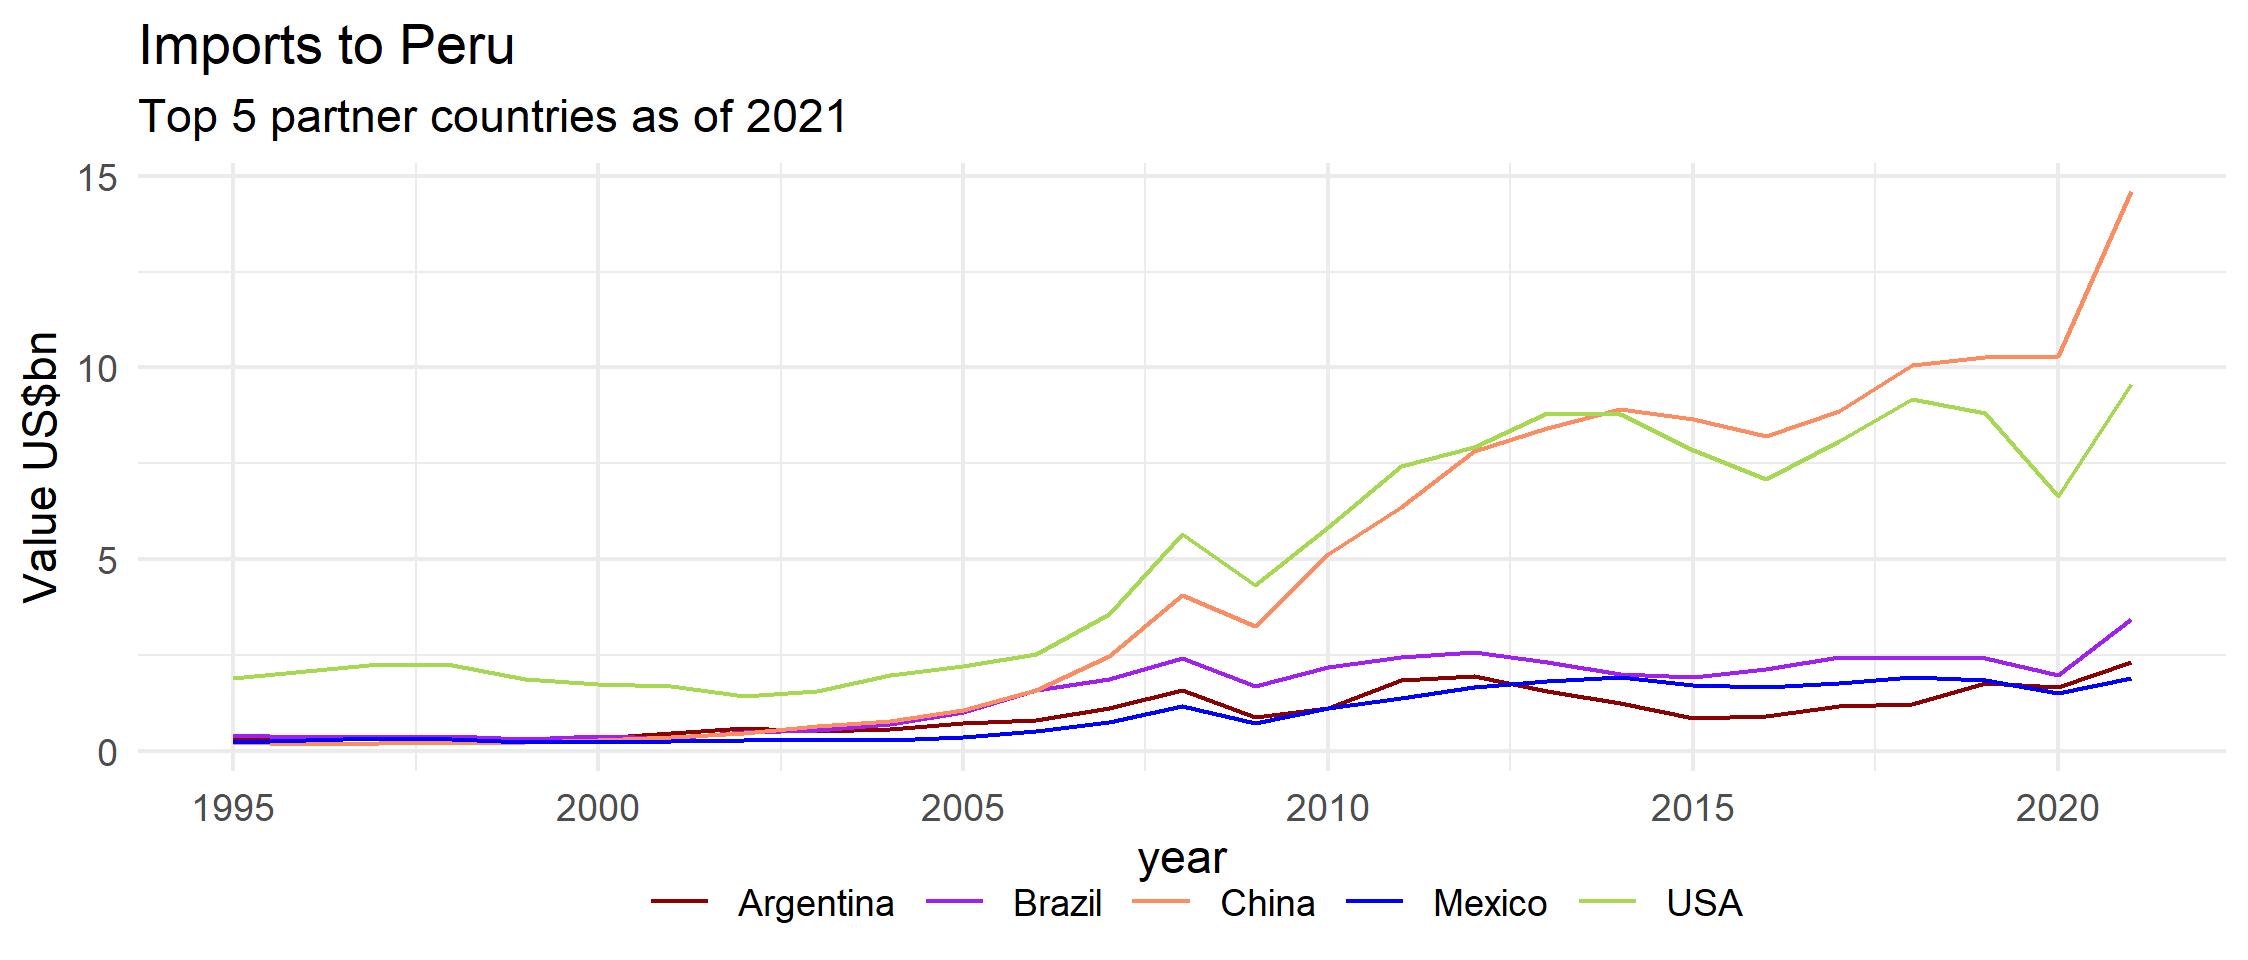
As of 2021, Peru’s top export market (by country) was China, followed by the United States, South Korea, Japan, and Canada (Figure 3). The largest source of Peruvian imports was China, followed by the United States, Brazil, Argentina, and Mexico. The value of Peru’s exports to China was more than double the value exported to the United States, which was double the value exported to Brazil. Similarly, the value of Peru’s imports from China was about 50 percent larger than the value imported from the United States, which was almost three times the amount imported from Brazil. As a trade bloc, the European Union
is also a very important trading partner for Peru. In 2021, the value of Peruvian exports to the European Union was $4.1 billion (which would make it the third-largest export market). The value of imports to Peru was $7.5 billion, making it the second-largest import partner after China.7
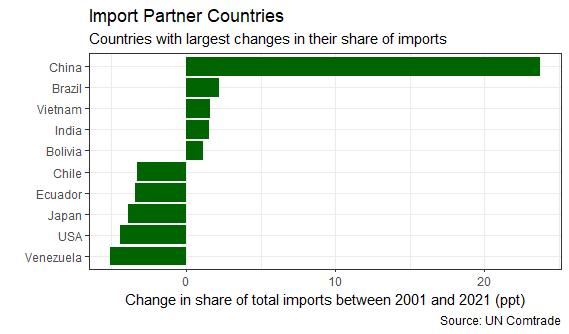
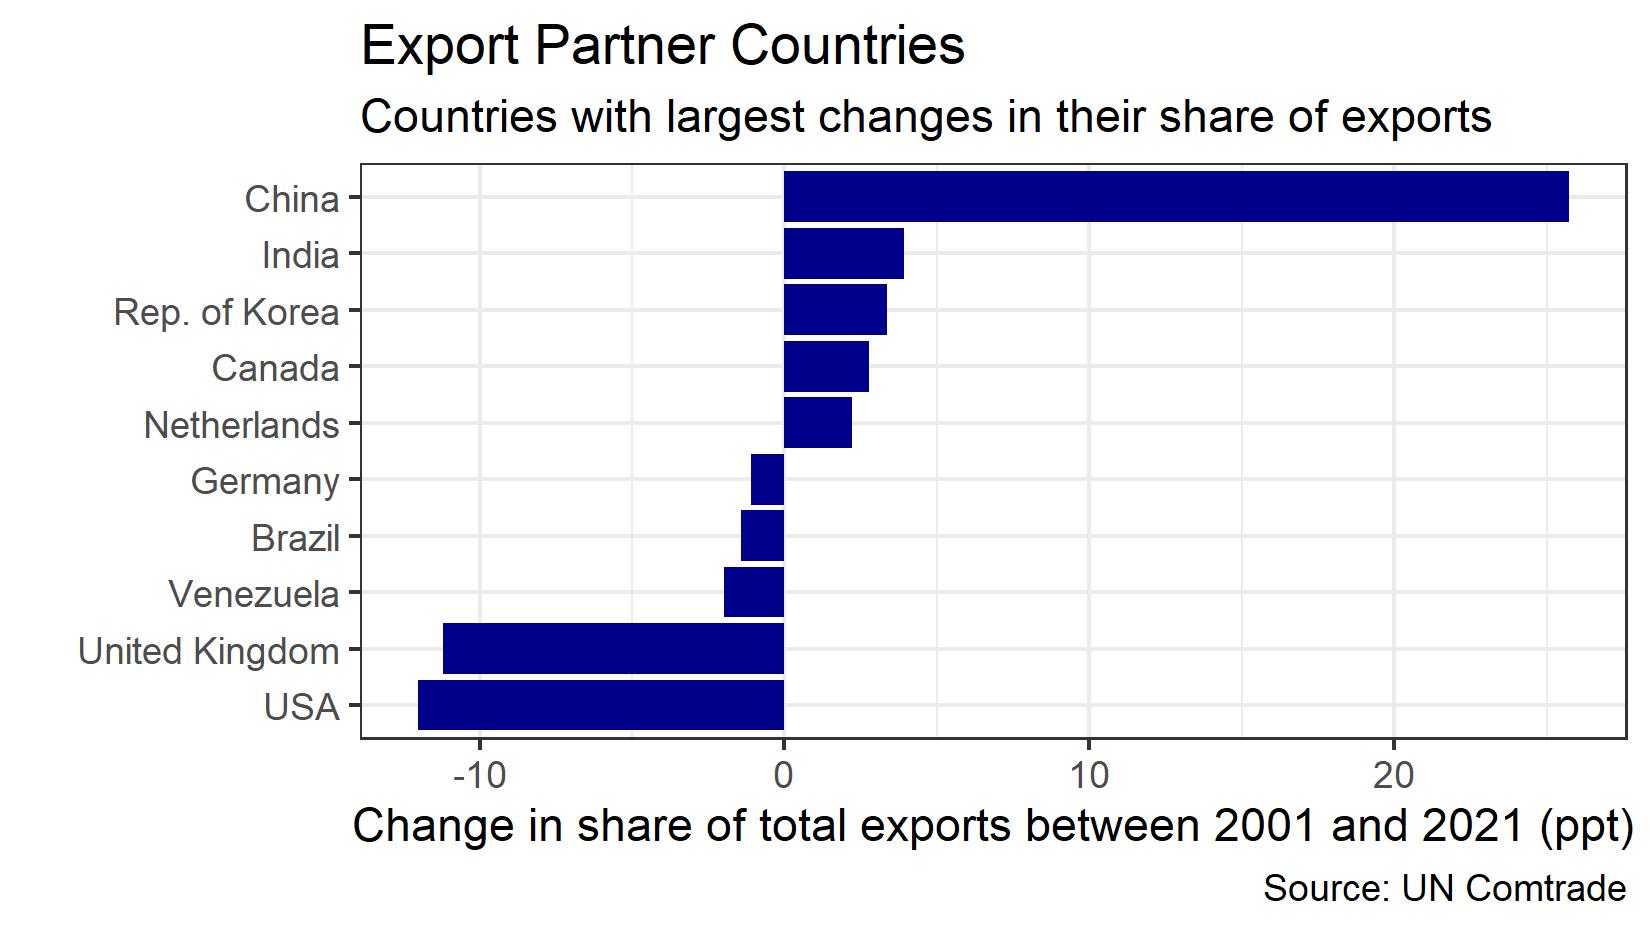
Peru’s main trading partners have changed significantly in recent decades (Figure 4). Most notably, China has become an increasingly important trading partner. The share of Peru’s total exports that went to China increased by 26 percentage points between 2001 and 2021,
Source: UN Comtrade
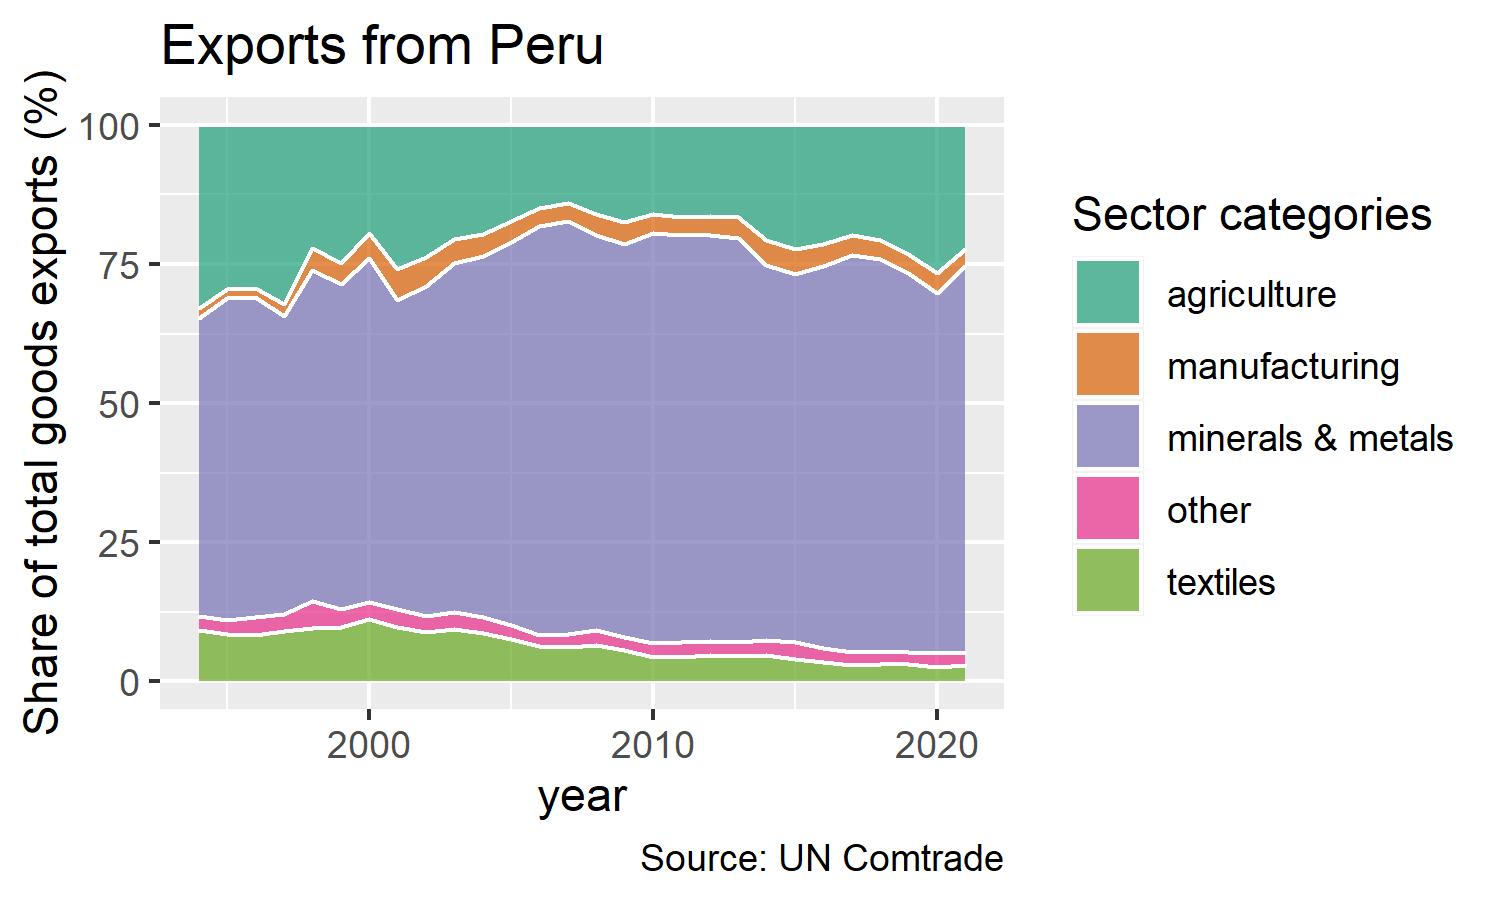
from 6 percent to 32 percent. Similarly, the share of Peru’s imports from China increased significantly by 24 percentage points between 2001 and 2021, from 5 percent to 29 percent. Mineral and metal exports have been the largest share of Peru’s exports since 1990 (Figure 5).
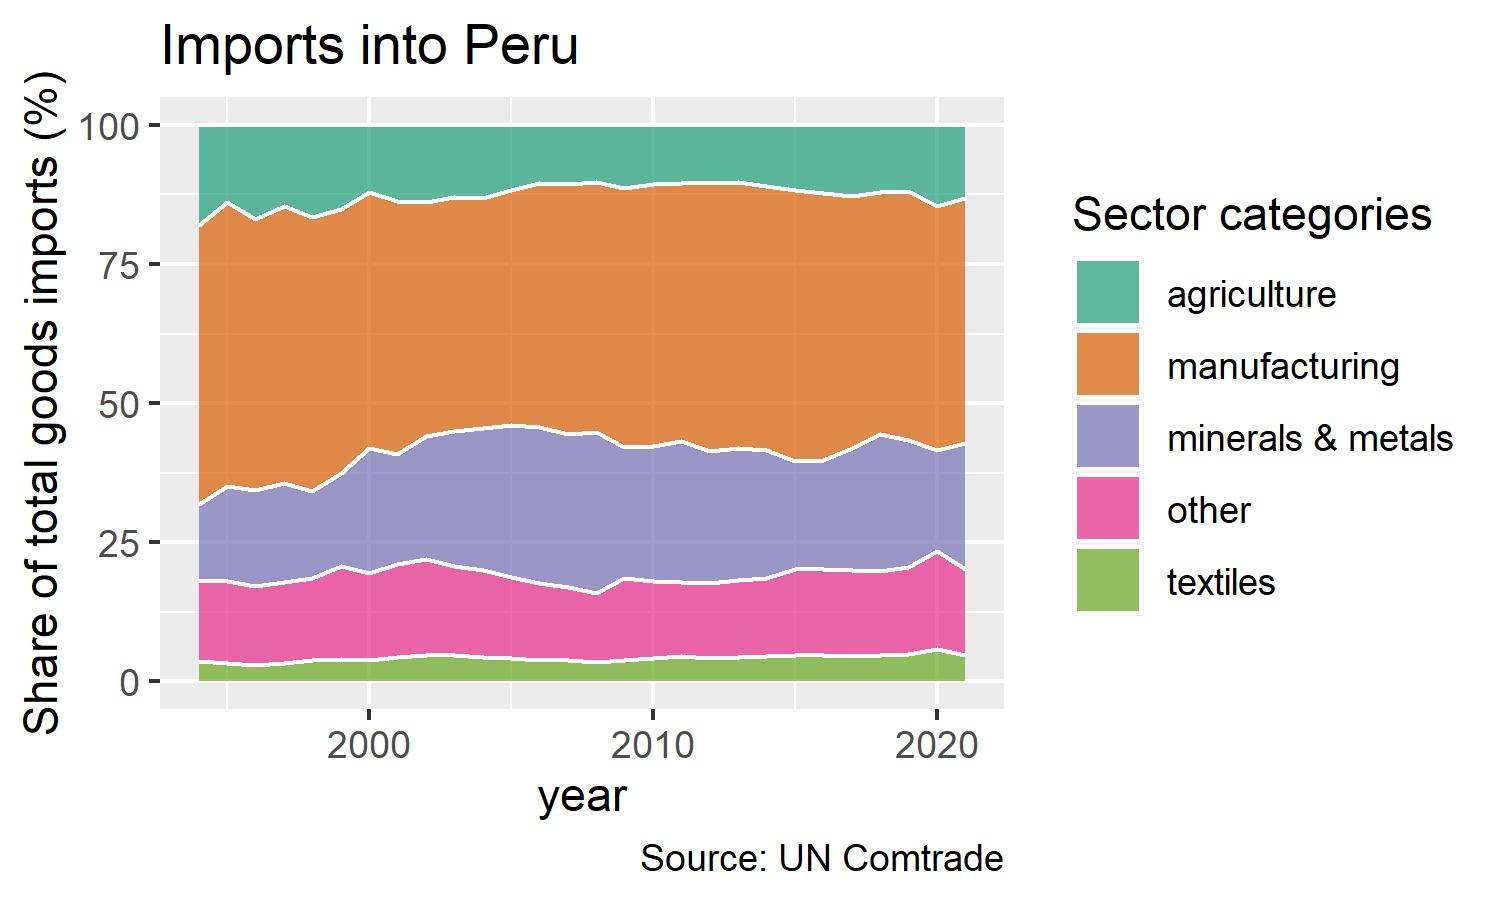
Minerals and metals increased as a share of Peru’s exports until 2008, while the share for agricultural products and textiles declined. Since 2008, however, the share for agricultural products has risen somewhat as the share for textiles has fallen to nearly zero. On the other hand, manufacturing goods comprise the largest portion of Peru’s imports, followed by minerals and metals, agricultural products, and textiles.
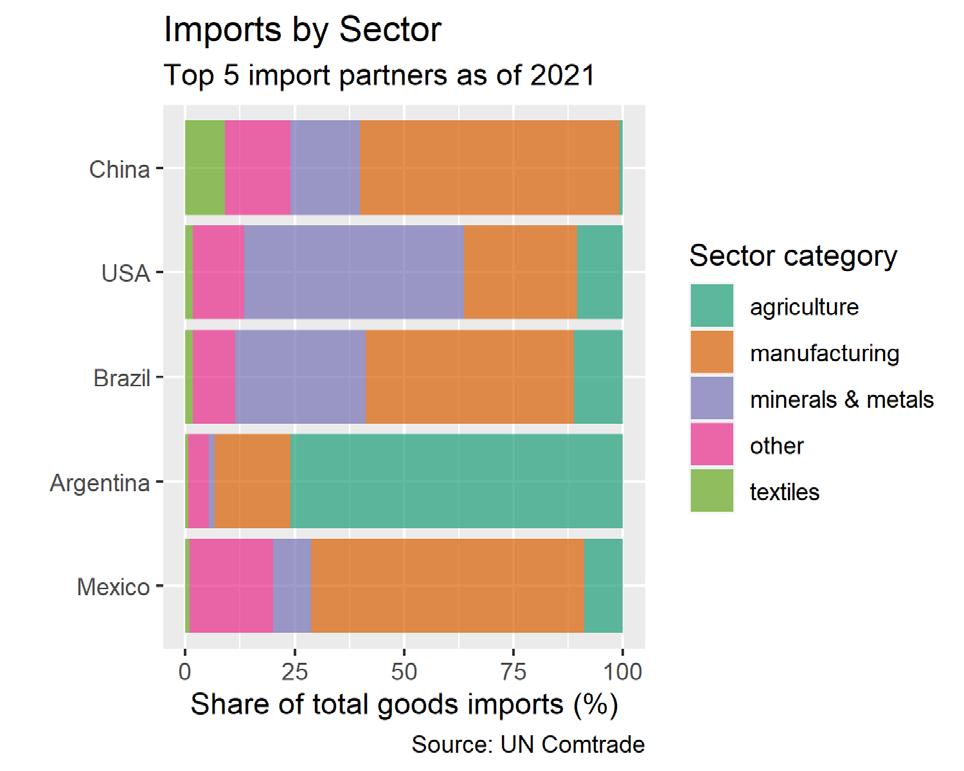
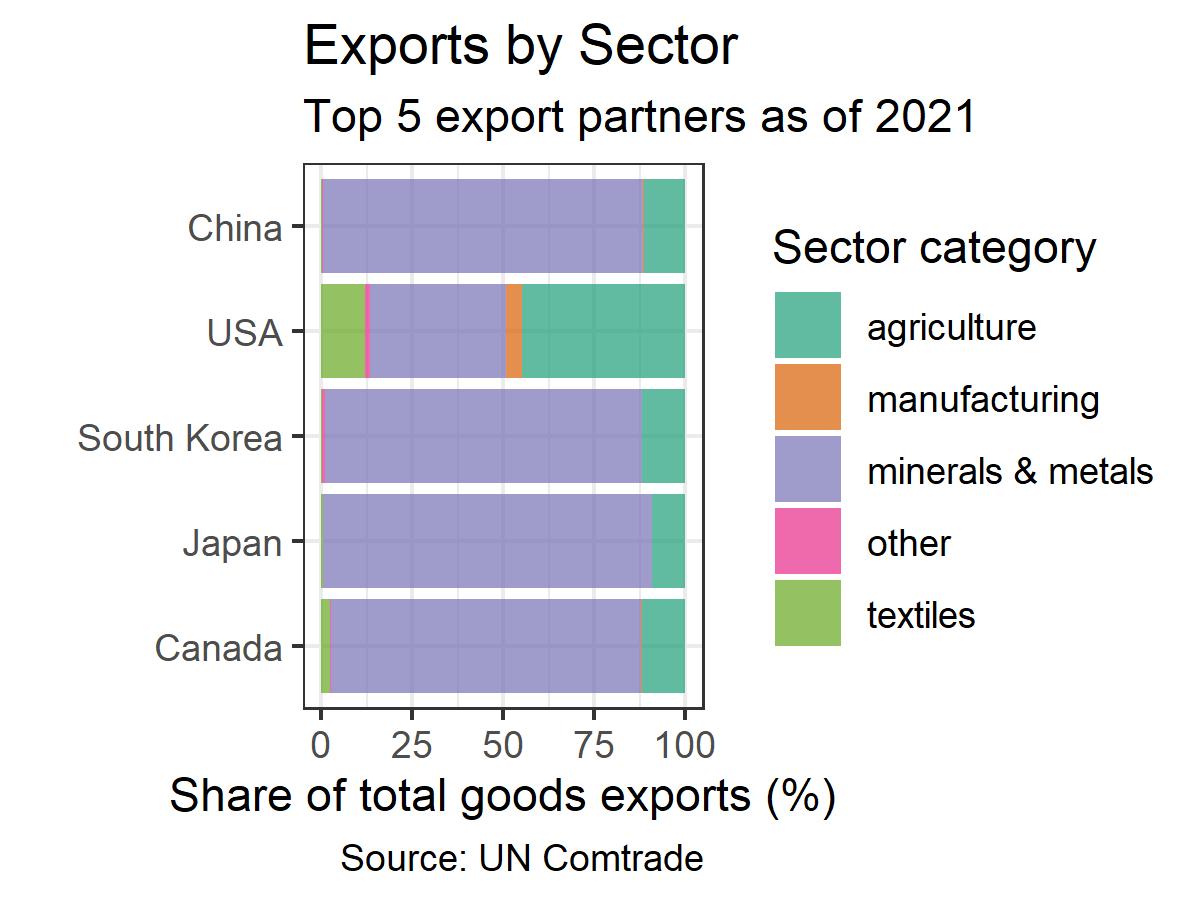
The sectoral composition of Peru’s exports and imports varies substantially across its largest trading partners. Minerals and metals make up the vast majority (over 85 percent) of exports to the top trading partners in East Asia and Canada, with the remainder made up mostly of agricultural products (Figure 6). Exports to the USA are more diversified; agricultural exports are about 45 percent of total exports, mineral and metal exports are about 40 percent, textile exports are about 10 percent, and manufacturing exports are about 5 percent. The composition of imports varies substantially across Peru’s top trading partners: Peru imports primarily manufactured goods from China, Mexico, and
Brazil; minerals and metals from the United States; and agricultural products from Argentina. As illustrated by the above sectoral compositions, Peru primarily exports low-complexity products: minerals & metals and agricultural products. Though Peru’s static comparative advantage is in producing low-complexity products, the Harvard
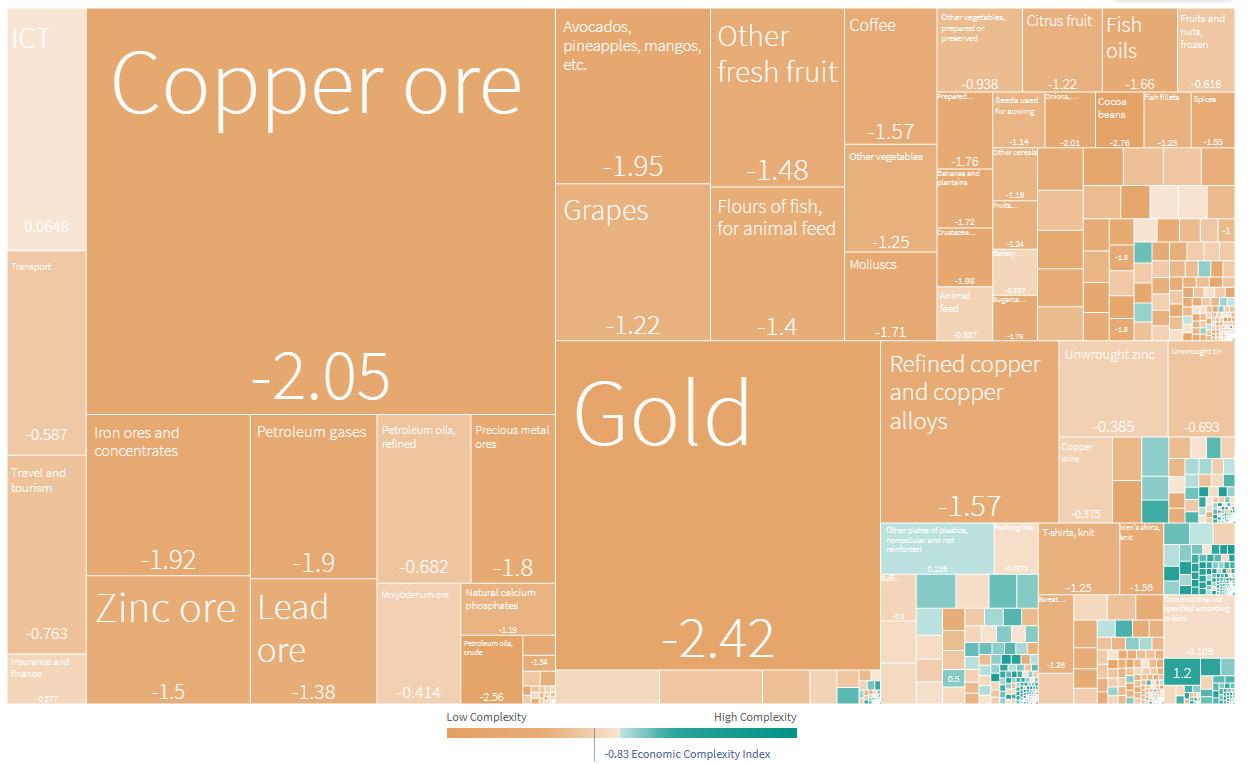
Growth Lab finds that countries that produce higher-complexity goods tend to grow faster. According to their Economic Complexity Index (ECI), Peru ranks as the country with the 105th most complex exports (out of 133) (Figure 7). Its ranking has worsened by 10 positions over the past decade.
Source: The Growth Lab at Harvard University. The Atlas of Economic Complexity. http://www.atlas.cid.harvard.edu.
Though we might assume that countries enter free trade agreements to increase aggregate welfare, economic theory often takes a backseat to politics when negotiating the specifics of a trade agreement (e.g., when to initiate one, who to sign it with, what sectors to protect, etc.). Influential industries or regions will often see their interests prioritized during the negotiation process.8 Similarly, geopolitical considerations about a country’s position in the region (or even in the world) as well as strategic decisions on how to engage with allies and/or rivals are also top of mind for negotiators.9,10 Given the sizable role they play in shaping free trade agreements, analyzing the domestic and global politics of trade is critical to understanding Peru’s trade policy orientation.
Free trade agreements often have divergent effects on an economy’s various sectors, and different sectors will therefore tend to have different views on trade. Sectors in which Peru holds a comparative advantage vis-a-vis a given trading partner should tend to support a reduction in bilateral tariffs, whereas those with a comparative disadvantage should tend to oppose tariff reductions. Additionally, preferences might vary by class (labor, capital) or skill level. The broader academic literature on the political economy of trade provides some important insights into how to think about these factors. For example, Scheve and Slaughter (2001) find that both lower skill sets and home ownership in areas with industries comparatively disadvantaged by trade are strongly correlated with support for trade barriers.11
A recurring challenge in trade negotiations is how to account for the wide variety of interest groups that stand to gain or lose from the terms of a trade deal. Often, business leaders and technocrats have an outsized influence in trade negotiations, even though their interests may not coincide with those of workers’ groups. Peru arguably experienced a clash of interests
between relevant stakeholders in July 2007 after former President Alan Garcia signed an FTA with the United States. Despite economic growth surging to 8 percent in the prior year, unions and organized labor protested and demanded amendments to the trade agreement with the U.S. to improve their wages and ameliorate wealth disparities within the country.12
The fallout that occurred in the aftermath of the FTA between the United States and Peru is emblematic of Peru’s broader experience with trade policy. We see mixed results even in the sectors that benefited the most. For example, agriculture and mining have been big beneficiaries of free trade insofar as their growth trends are concerned; however, the benefits have not been shared equally, as lower-skilled workers, in particular, have been left out and social conflicts emerged from mining projects on a regular basis.
The subsections below provide greater detail on the internal dynamics both of sectors that benefited and those that lost due to free trade as well as complementary policies that could be implemented to protect potentially affected stakeholders.
The agricultural sector is a key source of production for the Peruvian economy. This sector alone represents somewhere between 7.3 percent and 11.3 percent of GDP and employs more than one-quarter of the entire country’s workforce.13, 14
Agriculture has also been one of the biggest beneficiaries of Peru’s increased use of FTAs. The International Trade Administration estimates that Peruvian agricultural exports increased from $645 million in 2000 to $9.2 billion in 2021.15
However, this growth has not translated to higher wages and improved working conditions within the agricultural sector. In the past few years, there have been episodes of social unrest among workers in the sector. In response to the protest, Peru’s legislature passed reforms that
raised wages by 30 percent; however, workers claimed that it was not enough.
Thus, when considering any prospective FTA or RTA, it is important to give proper attention toward complementary policies that ensure that agricultural workers are not placed at a significant disadvantage relative to workers in participating countries. This will require basic provisions that protect workers’ rights such as strict labor standards as well as rules against the use of child labor. Provisions of this sort would allow for the continued growth of the industry, the creation of a substantial number of new jobs, a reduction in the risk of prospective protests, and higher credibility in Peruvian leadership, not only in trade policy, but in public policy, in general.
Mining represents approximately 10 percent of Peru’s GDP. While of similar size in GDP terms, mining—unlike agriculture—makes up a much larger share of total exports. Mineral export revenues were $27.2 billion in 2021, comprising 60 percent of Peru’s total exports.16 While mining makes up a large percentage of total exports, Peruvian investors account for a small share of total market participation. Investors from the United Kingdom, China, Canada, and the United States account for 21.8, 20.3, 15.6, and 13.3 percent of the market, respectively, while
3.5 percent.17
Like the agricultural sector, the mining industry has also been the center of social unrest in recent years. After former President Castillo’s election win in July 2021, mining communities near one of the largest mines in Peru, the Las Bambas copper mine, blocked the road that is used to transport copper from the mine.18 This was not an isolated incident, as there had been a number of protests over the course of 2021 at different mining sites throughout Peru.19 The unrest in large part stems from local communities feeling as though they are not equally benefiting from the mining activities in their respective areas.
Given its size, the mining and natural resources
sector will be central to the future of Peru’s economic growth as well as its free trade agreement policy. The government ought to take steps to maximize the potential benefit that the mining sector can deliver to the Peruvian people. This will involve addressing issues related to the social unrest in and around mining towns. By ensuring that the workers and communities that support the mining firms also enjoy the benefits of this lucrative industry, the Peruvian government can create an environment of equitable and sustainable growth for the sector.
While trade has benefited formal sector industries in the aggregate, the impact on the informal sector is less obvious. Recent estimates suggest that approximately 80 percent of Peruvian citizens are employed in the informal economy.20
Current literature that studies the relationship between FTAs and informality is mixed. Some studies suggest that FTAs can result in large welfare gains; other studies have shown that FTAs led to significant losses in employment in the informal sector.21
While Peru’s informal sector makes up a large proportion of the country’s total employment, the distribution of informality differs by sector, with more informal employment in the agricultural sector than in the manufacturing sector. Informal workers are more economically disadvantaged than their formal counterparts.
The political ramifications of having such a large informal sector who are economically worse off are significant. Cameron (1991) observed that informal workers were less tied to the right or the left ideology and were instead more attracted to candidates who were considered outsiders from the established political system.22 Understanding the potential destabilizing impacts of having significant informality, greater care should be taken in considering proper complementary policies to any prospective FTA or RTA that aim to create more inclusive growth across both formal and informal sectors. Doing so ensures that there is a reduced risk of political unrest,
while optimizing the potential benefits of any prospective trade deal.
Whereas the agriculture and mining sectors have been significantly enhanced by free trade agreements, the textile and leather industries have been negatively affected, especially following China’s admission to the WTO in 2001 and the signing of Peru’s FTA with China in 2009. Estimates from the Ministry of Production suggest that, between 2012 and 2016, the textile sector declined at an average annual rate of 7.16%, leading to significant job losses in the sector.23, 24
In response to the economic harms it has undergone over the past decade, the textile industry has pressured the Peruvian government for protection. In early 2022, the Peruvian government filed a complaint with the WTO about unfair, excessive imports from Asia.25 Moreover, Peru’s National Institute for the Defense of Competition and the Protection of Intellectual Property (Indecopi) has even implemented—or extended—temporary anti-dumping duties on certain Chinese imports, including footwear and certain polyester fabrics.26, 27 Given all of this previous experience, future trade agreements— especially with Asian trading partners—will need to be particularly careful with how provisions around the textile sector are handled. Moreover, the fact that firms in the textile industry are small, dispersed, and disorganized increases the likelihood of future social unrest since the industry does not have proper formal political representation to channel its demands.
Another sensitive social issue regarding Peru’s free trade liberalization are the concerns about potential environmental impacts of some FTAs. Since much of the foreign investment and increases in exports have come from the mining and agriculture sectors, particular worries have been raised about the degradation occurring in those industries. As discussed above, much of the social unrest that occurred in these
sectors centered on, among other things, the environmental degradation caused by these industries.28
Past FTAs with China and the United States either do not include environmental provisions or those that are included are not effective. As a result, there have been several calls for Peru to add such language during re-negotiations with China.
A recent report by The Carnegie Endowment for International Peace warns that competition between the United States and China could raise additional obstacles to improving coordination in the region.29 If tensions continue to rise, Peru may have difficulty maintaining warm relations with its two largest trading partners. A key potential issue is the large inflows of China’s Belt and Road Initiative financing in Peru. China’s investments into the country currently exceed US$30 billion, making Peru the largest destination for Chinese investment in Latin America after Brazil.30
China overtook the United States as Peru’s largest trading partner in 2014. However, the United States remains an important partner for Peru – as a net importer of foodstuff and long-standing strategic ties between the two countries. For the time being, the likelihood of Peru having to choose a side in rising US-China tensions remains remote. It does not appear that Peru will have to choose one power to align with and should be able to maintain robust trade and financial ties with both countries.
To better understand the regional politics of trade, it is crucial to analyze the dynamics and strategic priorities of the Pacific Alliance, a trade bloc composed of Chile, Colombia, Mexico, and Peru. The proposal for the Pacific Alliance entered into effect through the Lima Declaration in April 2011. Other than the economic benefits, the bloc would serve as a geopolitical counterweight to the more statist and protectionist governments of Brazil and Venezuela.31 At the time of signing
the agreement, the four member states were led by market-friendly governments with a specific objective of increasing trade with the Asia Pacific region.
The Pacific Alliance has been able to achieve consensus among its members on a model of economic and political integration aimed at attracting investment and increasing exports. It also favors a more open economy with lower levels of tariffs and encourages the signing of FTAs by individual member states as well as a bloc. However, while the bloc is open to trade with external countries, internal trade integration is limited, which constrains the ability of member states to take advantage of various facilities such as flexibility on rules of origin.
Many other countries have expressed interest in joining the Pacific Alliance. Applications for candidate countries follow a similar process to what is followed for trade negotiations and can also be subject to significant political pressures from Alliance members.
The Pacific Alliance, like other regional blocs, has to balance the individual interests of the member states with the interests of the bloc. While they do not always align, the Pacific Alliance is not highly affected by the potential clash in the interests of member states because the members are allowed to sign trade agreements with third countries without the approval of the alliance as opposed to Mercosur. However, the following geopolitical considerations for the Pacific Alliance are evident:
The trade openness in the Pacific Alliance from more to less open is ranked as Chile, Peru, Mexico, and Colombia. Naturally, this limits the capacity of the Alliance to offer more or less ambitious FTAs to Associate States because of the concerns of the member states. For instance, Colombia is particularly sensitive to its agriculture sector and seeks protection for it in most negotiations because the producers are well organized.32
While this can at times be addressed by signing separate agreements by individual countries, ideally all the member states would want to have similar agreements to bolster the alliance and improve integration within the bloc.
The Pacific Alliance is seeking to balance its trade and investment relationship between the US and China but Mexico is much more dependent on the US than the member states. This is because Mexico’s trade with the US at $619 bn. in 2019 was much higher than its trade with China at $90 bn. in the same year. Moreover, China has invested only about $1 bn. in Mexico from 1999 - 2018 whereas the US investment from 1999 - 2021 was US$ 292 billion.33 Mexico’s GDP is higher than the sum of the GDP of the other three member states of the Pacific Alliance and it has the potential to be the leader of the bloc even though the presidency is rotated among the member states every year.
Peru and the other Pacific Alliance members have recognized the Asia Pacific as a priority region with which to improve trade ties. In particular, there is growing interest in increasing trade with the Association of Southeast Asian Nations (ASEAN) members. ASEAN currently consists of ten countries: Brunei, Cambodia, Indonesia, Laos, Malaysia, Myanmar, the Philippines, Singapore, Thailand, and Vietnam.34
The strong trade interest in Asia is grounded in its large economic size, growth prospects, and burgeoning population. Today, Asia accounts for 60 percent of the world’s population and the region’s GDP grew at a rate of 6.5 percent in 2021, post-COVID.35 It is on track to produce 52 percent of the global GDP by 2050, which would lead to an increase in living standards for 3 billion people.36
In addition to economic trade interest in Asia, Peru could also benefit politically from increased access to the Asian market, particularly as it relates to collective self-reliance. Peru is
heavily dependent on the productivity of other countries with nearly 60% of volatility in GDP due to external factors. By diversifying its trade ties with other countries in the region, Peru could leverage its diplomatic relations with other midsize countries and become more independent from the volatility of its major trade partners, such as China and the United States.
Greater trade with ASEAN countries could increase export potential through multiple channels:

• Southeast Asian countries are the dominant food supplier for Asia. With the projected rise of the Asian middle class, demand for higher quality food, products in which many Pacific Alliance countries enjoy a comparative advantage, will grow.
• Poor infrastructure quality in Latin America has been a major bottleneck in increasing trade integration within the LAC region, but seaborne trade with Asia is less constrained by land-transported trade in LAC.
• ASEAN countries are the preeminent suppliers of manufactured and industrial products, which are in high demand in the
Pacific Alliance member states, as they seek to industrialize their economies.
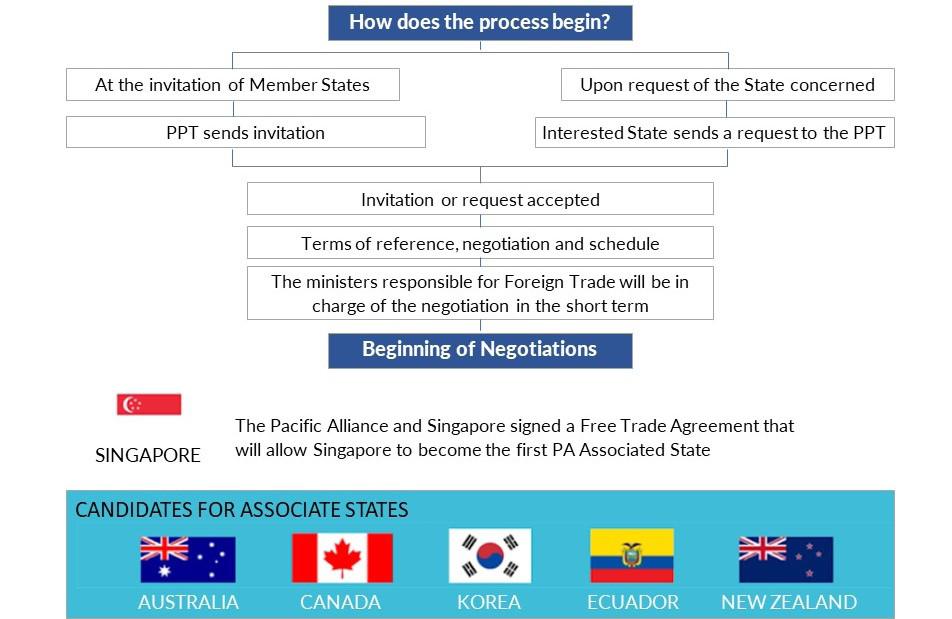
Various Asian countries have also shown interest in increasing trade ties with Peru, as demonstrated by its existing agreements with Singapore, China, Korea, Thailand, and Japan. Additionally, Singapore recently became the first country with which the Pacific Alliance signed an FTA. South Korea has also applied to join the Pacific Alliance, with negotiations for it becoming an Associate State commencing this past year (July 2022).
Despite trade interest with Peru, there exist political obstacles that could decrease the viability of future trade deals. For example, Peru is considering an agreement with Indonesia but would have to overcome several differences in values to be successful, such as agreeing to ideal labor standards and the optimal level of trade liberalization. In sharp contrast to Peru’s liberalization strategy, Indonesia has long been seen as a bastion of protectionism who earlier this year doubled down announcing that 30% of its palm oil volume will now be required to go to the local market. This reflects a staggering 10% increase from the world’s largest provider of palm oil amidst concerns over rising inflation and food costs.37
In considering the future direction of Peru’s trade relationships, a common thread across domestic and regional politics, specifically within the Pacific Alliance, is the goal of increasing trade ties with Asia. Chile, Colombia, and Peru already have bilateral agreements with South Korea. Mexico is currently negotiating a trade agreement with South Korea, which, when finalized, will make South Korea an Associate State of the Pacific Alliance. Peru also has demonstrated interest in trade agreements with ASEAN countries, both independently and as part of the Pacific Alliance. To understand how these agreements may be structured, it is important to understand Peru’s strategic priorities and key issues that will be discussed during the negotiations. This section documents strategic priorities for Peru in any future trade agreements, documenting issues of interest for three potential trade agreements:
Pacific Alliance-South Korea, Pacific AllianceASEAN, and Peru-ASEAN.
For Peru, there are two primary pathways to initiate free trade agreement negotiations: as a single entity (e.g., entering into a bilateral or regional trade agreement) or as a member of a trade coalition (e.g., negotiating an agreement as part of the Pacific Alliance). The negotiation of trade agreements in Peru requires the support of various ministries, including the Ministry of Foreign Affairs, the Ministry of Economy and Finance, and the Ministry of Production. MINCETUR generally leads this process and manages the actual negotiation of any agreement. Figure 8 below describes the trade negotiation process.
Peru already has a trade agreement - and low tariff rates - with South Korea. However, these
Source: Mexican Ministry of Foreign Affairs
tariff rates are still higher than those with Pacific Alliance members and ASEAN countries (Figure 9). The higher tariff rates with South Korea are due to the exclusion of 107 agriculture and marine products in the Peru-South Korea trade agreement.38 The existing low tariff rates on ASEAN imports suggest that any agreement may have a limited, overall impact on the Peruvian economy. Discussion of the impacts of a potential trade agreement with ASEAN members is discussed in Section 4.
The harmonization of exports and imports across countries, in addition to tariff levels, influences
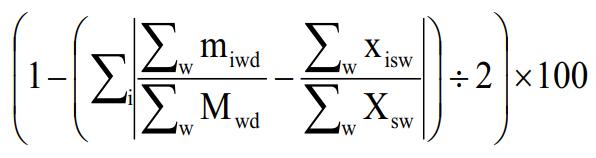
the overall volume of trade between countries. The Trade Complementarity Index (TCI), defined below, assesses how similar Peru’s exports are to ASEAN countries’ imports (and vice versa).39 The index takes a value between zero and 100 - with zero indicating no overlap in exports and imports and 100 indicating a perfect match in the import/export patterns of countries.
Peru has a lower level of complementarity with ASEAN countries when compared to its largest Figure 9. Average Ad Valorem Tariff Rates on All Traded Commodities
Percent
Source: GTAP 10
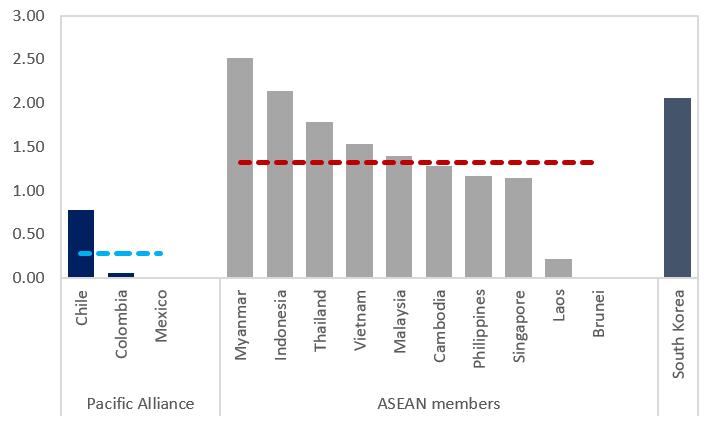
current trading partners (Figures 10 and 11). Within ASEAN, Peru has the highest levels of complementarity with Cambodia and Thailand - which is, in part, driven by Peru’s exports of gold and petroleum and imports of cars and broadcasting equipment. Importantly, this index captures complementarity at one moment in time and there would likely be a shift in export and import patterns if a trade agreement is signed. TCI would likely rise if an agreement between the countries were signed - due to Peru diversifying its exports to match ASEAN imports. Moreover, negotiations often explicitly carve out requirements for increasing the exports of specific, strategically important goods. These
clauses are likely to be used in any agreement with ASEAN countries to protect domestic industries who are likely to lose due to increased competition from trading partners. Overall, the greater harmonization of import and export patterns would lead to broader benefits resulting from any agreement - though the extent to which that occurs depends on which sectors are excluded or protected in an agreement. Which sectors ultimately are protected in trade agreements is influenced by key domestic stakeholders and geopolitical considerations discussed above.
Source: World Integrated Trade Solution data
Source: World Integrated Trade Solution data
Trade agreements provide economic benefits which go beyond broadening market access. They can also be a useful tool to increase foreign direct investment (FDI) flows into a country. Through increased foreign direct investment, companies can support economic development and enhance productivity through technology and intellectual property transfers.40 Moreover, trade agreements are potent tools to lay the groundwork for greater convergence toward international standards.41 Labor standards are often intertwined with trade agreements to ensure that no country achieves an unfair advantage through unfair labor practices like suppressing workers’ wages, utilizing child labor, or other measures. Moreover, as the global economy has become increasingly digitized, data standards for cross-country data transfers are also a key topic of debate. These trade-related issues are analyzed in more detail below.
The suppression of labor rights, safety standards, and working conditions give producers an unfair advantage in trade due to artificially low costs. The size of the ASEAN textile industry and the desire of Pacific Alliance members to remain competitive in textiles suggest that labor standards will be particularly important in the negotiations. On the other hand, labor standards are already incorporated into Peru’s bilateral agreement with South Korea. Industrial safety standards are poor in ASEAN countries and accidents leading to loss of life are common. For instance, in June of 2022, a fire at a container depot in Bangladesh killed 49 people while injuring over 200 others.42 These low standards demonstrate that labor lacks power in many of these countries and could consequently result in ASEAN countries having an unfair advantage over Peruvian industries. The importance of labor standards in the context of potential trade agreements is discussed in Box 1.
ASEAN
The ASEAN region lags behind the rest of the world in ratifying International Labor Organization conventions – the ASEAN regional average of ratification is 5.6 out of 8 compared to a global average of 7.4.43 Included in these conventions are provisions on freedom of association and collective bargaining, forced labor, discrimination, and child labor.
South Korea
South Korea’s FTAs with Peru and Colombia do have such provisions and labor provisions in these agreements feature prominently.44 Given these existing provisions in South Korea’s agreements with Alliance members, the shared interest in maintaining adequate labor standards will shape any broader agreement between South Korea and the Pacific Alliance.
FDI is a critical source of finance for developing countries and can contribute to employment generation, technology diffusion, economic growth, and sustainable development.45 Inflows to emerging and developing economies represents roughly half of all global FDI inflows.46 Greater
openness to trade via free trade agreements affects FDI flows through multiple channels. For example, a reduction in trade barriers should encourage vertical FDI by reducing transaction costs involved in a vertical integration strategy.47 Furthermore, signing an FTA often includes efforts to further reduce transaction costs that specifically affect cross-border investment – through policies which
liberalize capital flows, homogenize legal norms, and design institutions to handle cross-border disputes. A wide body of literature documents positive consequences of free trade agreements on FDI.48,49 Looking specifically at emerging and developing economies, FTAs are associated with large changes in FDI inflows. A study focusing on the impacts of free trade on FDI in Vietnam documents that FTAs increase FDI inflows by 129 percent, on average.50

International trade and cross-border transactions often rely on Internet services - with the transfer of data being required to execute these transactions. Even businesses who do not sell goods or services online depend on the ability to transfer data for everyday business transactions; such as managing payroll, processing credit card charges, communicating with clients, and updating software for remotely controlled machinery. If adequate, a country’s data policy framework provides a basis for corporations to engage in international data transfers and could lead to increased FDI. This interaction between data policy and foreign investment
flows is discussed in Box 2. Moreover, a better international data transfer environment could enhance the ability of Peruvian companies to expand their international operations. Peru’s approach to data policy ultimately can enhance its economic position on a global scaleenabling more seamless integration with the global economy. A discussion of international data transfers and current Peruvian policy is provided in Annex 2.
The wide-ranging economic impact of trade agreements underscores the need for careful analysis to understand the net impact of trade agreements. Importantly, non-trade considerations (such as labor standards, FDI, and data protection) should feature in debates over the merit of potential agreements. Without adequate complementary policies in place, Peru risks not capitalizing on the impact that FTAs can have on foreign investment flows and overall productivity-enhancing effects from the convergence toward international standards. A conducive environment for international trade necessitates a broader approach to trade and non-trade economic policies in Peru.
Over and above prohibitive time and cost constraints, the lack of a country-wide binding data policy presents foreign investors with additional risks to consider. The lack of a well-defined compliance environment could prohibit financial inflows to Peru. Potential investors seek stability, and when access to foreign markets is uncertain, they may choose to invest elsewhere or not at all. For example, in the 2020 Schrem II decision, the Court of Justice of the European Union (EU) declared that the existing US-EU Privacy Shield allowing international data transfers between EU and US companies was invalid because of improper data usage related to US surveillance programs.51 The decision put 5,380 Privacy Shield participants at risk, including US companies, their subsidiaries in Europe, and 250 entities headquartered in Europe; 75 percent of those covered by the Privacy Shield were small-and medium-sized companies who did not have the resources to apply for contractual waivers.
The lack of a new trade agreement to allow transatlantic data flows threatened over $264 billion in trade between the EU and the US - as they are each other’s most important commercial partners for digitally-enabled services. Even companies who can afford a contractual waiver could be deterred from investments due to environmental uncertainty, such as Facebook’s parent company, Meta, who threatened to pull out of the EU market if another data agreement could not be reached.52 In response to corporate pressure, U.S. President Joe Biden signed an executive order in October 2022 committing to a new US-EU data framework.53 Cross-country collaborations are becoming increasingly important to secure international transactions and are highly valued by corporations and investors when assessing investment prospects.
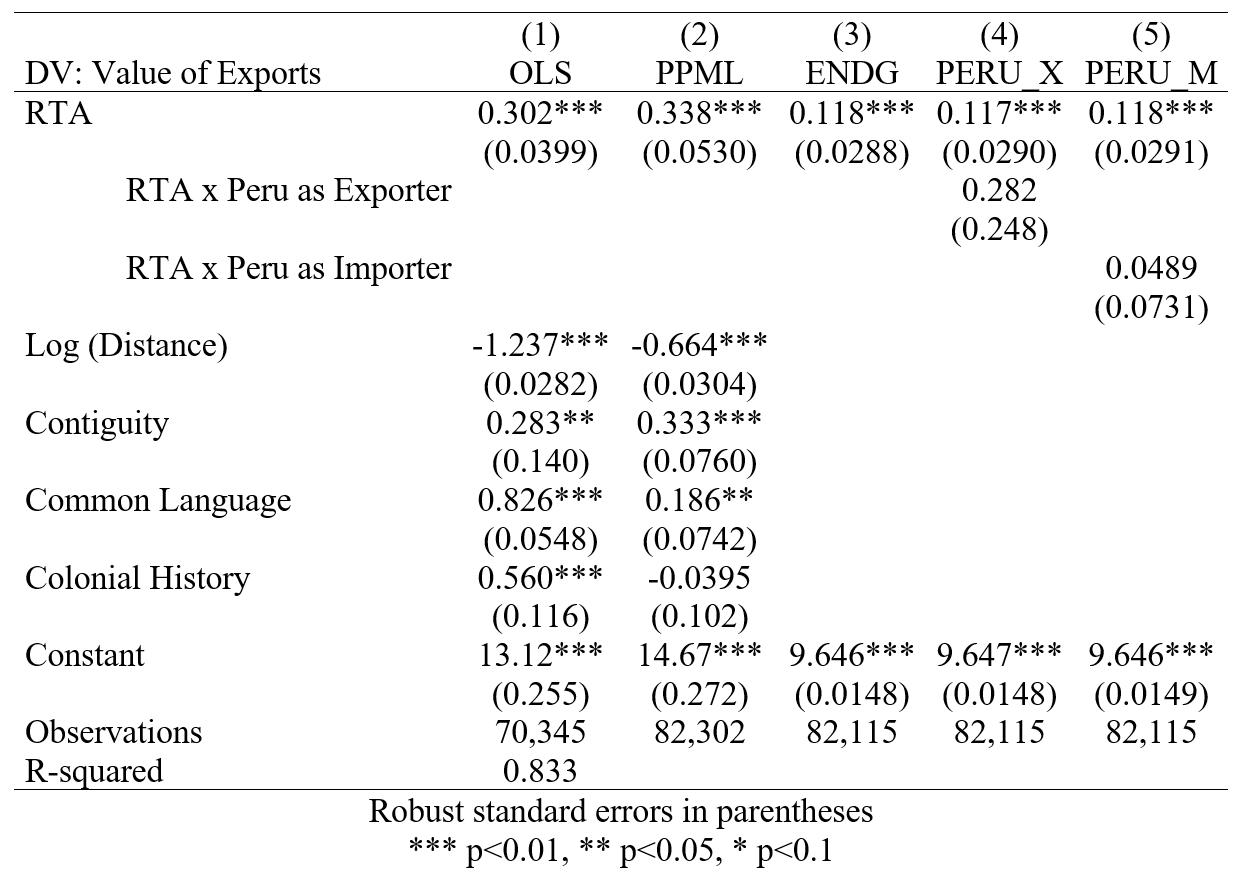
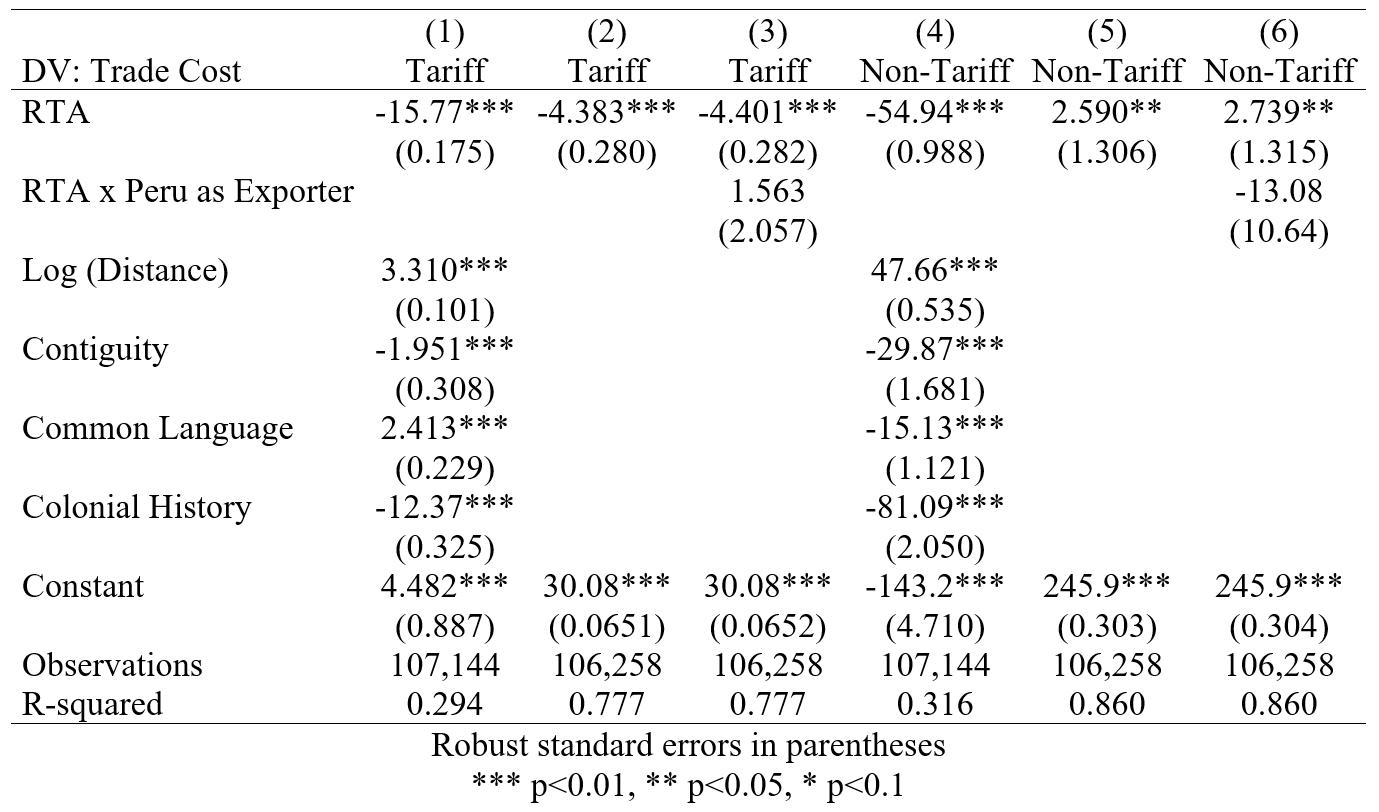
To understand the effect of a regional trade agreement (RTA) on Peru’s trade flows, we run a gravity model of international trade flows, using a balanced dataset of manufacturing export flows between 77 country pairs from 1990 to 2018 with 4-year intervals. In a theoretically founded gravity model, bilateral trade flows are a function of each country’s economic output and their relative trade costs (i.e., bilateral trade cost relative to multilateral trade resistance).54 Our estimation follows recommendations in the WTO’s "An Advanced Guide to Trade Policy Analysis: The Structural Gravity Model".55 Data are sourced from the United States International Trade Commission’s International Trade and Production Database for Estimation (ITPD-E).56
Regression specifications (1)-(2) in Table 1 control for various proxies of bilateral trade cost
between each exporter and importer: distance to capital, contiguity, common language, and colonial history. All importer-year and exporter-year characteristics (including GDP of each country and multilateral trade resistance in each year) are captured with importer-year, and exporter-year, fixed effects (FEs). Specification (1) uses an OLS estimator, while specification (2) uses a Poisson Pseudo Maximum Likelihood (PPML) estimator to account for zero trade flows between many country pairs:
For specifications (3)-(4), we account for unobserved factors between country pairs, using pair FEs. Pair FEs absorb all pair-level time-invariant trade costs, including distance between capitals, contiguity, common language, and shared colonial history. These FEs help us rule out a reverse causality explanation, whereby country pairs that already trade a lot are more likely to sign an RTA. Specifications (4)-(5) add Peru-specific interactions to test whether RTAs have a different effect for Peruvian exports and imports: Table 1: Estimating the Effects of Regional Trade Agreements on Export Value
Source: US International Trade Commission
The models without pair FEs - specifications (1) and (2) - estimate positive and significant effects of RTAs. In these specifications, RTA increases exports by 30-34%. When we add pair FEs in specification (3), the estimated effect of RTA diminishes to 12% but remains significant. The Peru-specific interaction terms (RTA × Peru Exp. and RTA × Peru Imp.) in specifications (4) and (5) are positive but insignificant, indicating that the effect of RTAs on Peru’s exports and imports is not significantly different from the global average.
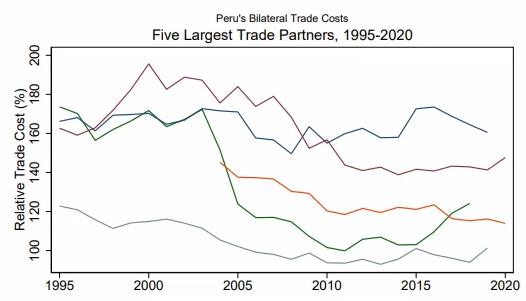
To illustrate the anticipated effect of further tariff reductions in Peru, we analyze Peru’s bilateral trade costs. While bilateral trade costs are composed of a wide variety of tangible and intangible factors - distance, history, institutions, infrastructure, etc. - and are notoriously difficult to calculate, they can be estimated using a gravity model. Following the methodology described in Novy (2012), UNESCAP and the World Bank publish relative trade costs for 180 countries from 1995-2020.57,58 These trade costs are calculated as:
Peru’s trade costs have fallen substantially
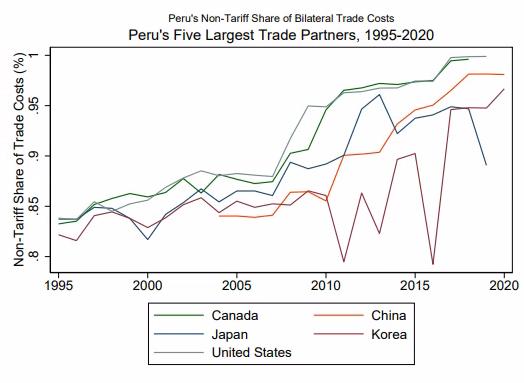
since 1995. The relative trade cost to the United States, for example, has fallen from 120% in 1995 to about 100% in 2019 (Figure 12A). There is also a clear upward trend in the non-tariff share of trade costs (Figure 12B). Over the same period, the non-tariff share of trade cost to the
United States increased from less than 85% to nearly 100%. This result is consistent with the reduction in tariff levels, which has left non-tariff factors as the primary barriers to trade flows. The finding that non-tariff costs far exceed tariff costs is true for all of Peru’s import partners.
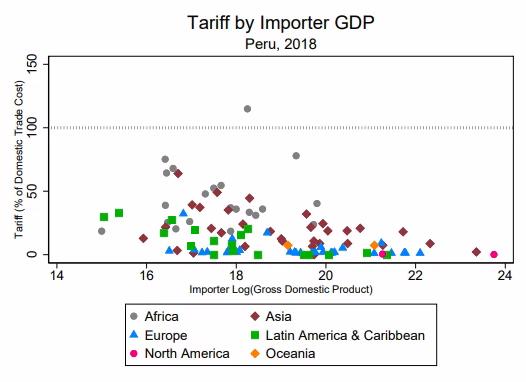
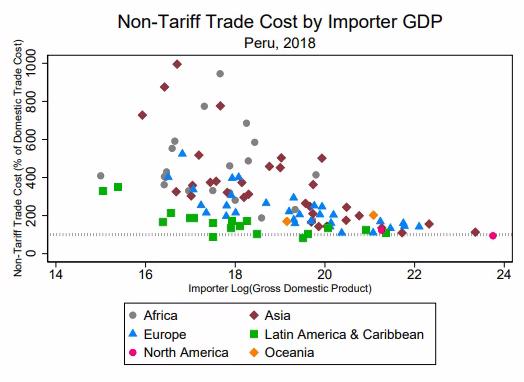
Peru benefits from low tariff costs on exports to many economies around the world, with higher tariffs on exports to smaller economies and to Asia and Africa (Figure 13). In 2018, most bilateral tariff costs fell within 0-25% of Peru’s intranational trade cost. In contrast, most non-tariff trade costs fell within 100-400% of Peru’s intranational trade costs, again with higher tariffs to smaller economies (the 100% line is included in Figure 13 for ease of comparison).
To understand the role of RTAs in lowering bilateral trade costs, we regress tariff-related and non-tariff trade costs on RTA, following the analysis in Novy (2012) (Table 2). Model (1), which includes exporter-year and importer-year FEs and a series of time-invariant trade cost-related variables, reports that an RTA lowers relative tariff costs by 16 percentage points. Adding pair FEs in specification (2) reduces the effect to 4 percentage points, and the effect is not significantly different when Peru is the exporter (3).
We do not see comparable effects of RTAs on non-tariff trade costs. Specifications (4)-(5) mirror specifications (1)-(3) but with non-tariff trade costs as the dependent variable. While specification (4) suggests that RTAs reduce nontariff trade costs by 55 percentage points, the models with pair FEs find small but significant
positive effects on non-tariff trade costs. Again, the results when Peru is the exporter do not appear significantly different from the global average.
Overall, the gravity model results suggest that trade agreements have successfully reduced trade costs and boosted exports in recent decades, both at the global level and for Peru specifically. However, given that tariffs comprise an increasingly small portion of Peru’s trade costs (nearly zero for some of its largest trade partners) and that trade agreements have not had a significant effect on reducing non-tariff trade costs, future trade policy may require a reorientation. A focus on reducing non-tariff trade costs - either through agreements and/or complementary policies - may be a more promising avenue for boosting exports in Peru.
The ex-post analysis of Peru’s trade policy illustrates that, on average, trade agreements have a positive impact on export levels for Peru and documents that trade agreements lower trade costs between countries. However, it is difficult to determine how these positive benefits apply to a potential trade agreement between the Pacific Alliance (or Peru) and Asian countries due to the countries’ geographic location. The distance
Source: ESCAP-World Bank
between ASEAN countries and Pacific Alliance members, combined with a lack of a shared language could act as barriers to deeper trade integration. Indeed, results from our gravity model illustrate that trade costs are increasing in distance and tend to be higher for countries that do not share a border or language. Thus, whether a deeper trade agreement could overcome these impediments and offer export growth potential remains an open question.
Regardless of the overall impact of tariff reductions, an agreement will have diverse effects on export sectors across regions. Faced with greater competition from trading partners, domestic producers in certain sectors could be displaced as foreign producers with lower costs exploit their comparative advantage. The complex dynamics of trade agreements and uncertainty around the impacts of a potential agreement with ASEAN countries give rise to many important questions, including:
• Will Peru’s macroeconomy benefit from
export gains due to new trade agreements?
• Which domestic sectors are likely to benefit the most from increased market access in Asian countries?
• Which sectors will be negatively impacted by increased competition in trade partner countries?
To answer these questions, we leverage a highly granular dataset on global trade, the Global Trade Analysis Project database, version 10 (GTAP 10).59 GTAP 10 relies on country-based Input Output Tables and contains complete bilateral trade information, transport, and protection linkages for 65 sectors in 121 countries and 20 aggregate regions of the world (collectively comprising 98 percent of global GDP and 92 percent of world population).
With this data, we can run simulations and create
counterfactual scenarios to assess the impact of potential trade agreements on the Peruvian economy. Our analysis is based on the standard GTAP model – which is a multi-region, multisector computable general equilibrium (CGE) model with perfect competition and constant returns to scale.60 Annex 1 contains more information on the standard GTAP CGE model.
Importantly, a CGE model allows us to assess both direct and indirect effects of entering into a trade agreement by modeling the behavior of all producers and consumers in an economy and the linkages among them.61 Thus, not only can we estimate the direct impact on export levels for different sectors in the Peruvian economy, but we can also assess how producers may shift their resource allocations across sectors in response to the modeled scenarios.
Given the strategic priorities of the Pacific Alliance, existing trade relationships, and ongoing trade negotiations, we consider three potential trade agreements in our analysis: Pacific Alliance-South Korea, Pacific AllianceASEAN, and Peru-ASEAN. A brief overview of each of these scenarios is provided in Box 3. Rather than attempting to replicate the exact terms of a potential agreement, these scenarios consider basic shocks - reducing tariffs between trade agreement partners to 0 percent - to provide a baseline result of the potential impact. In practice, countries often negotiate terms to protect strategically important sectors, or exclude them altogether. As a result, the overall impact of potential trade agreements is not a precise estimate. Nonetheless, this approach provides a clear indication of the most exposed sectors in potential trade agreement scenarios.
Pacific Alliance-South Korea
South Korea is currently negotiating to become an Associate Member of the Pacific Alliance. This scenario considers all Pacific Alliance members reducing tariffs on South Korean exports to 0 percent and South Korea reciprocating for all Pacific Alliance exports. Given Chile, Colombia, and Peru already have bilateral agreements with South Korea, the large change in this scenario stems from a liberalization of trade relations between Mexico and South Korea.
The Pacific Alliance has demonstrated interest in expanding trade ties with Southeast Asia. In this scenario, all Pacific Alliance members sign a trade agreement with all ASEAN members (Brunei, Cambodia, Indonesia, Laos, Malaysia, Myanmar, Philippines, Singapore, Thailand, and Vietnam) and decide to reduce tariffs to 0 percent on all exports from Pacific Alliance members to ASEAN members, and vice versa.
Given political dynamics in the Pacific Alliance, it may be difficult to move quickly to pass a trade agreement between the Pacific Alliance and ASEAN members. This scenario considers the prospects of Peru signing a bilateral agreement with ASEAN members (Brunei, Cambodia, Indonesia, Laos, Malaysia, Myanmar, Philippines, Singapore, Thailand, and Vietnam). Peru lowers tariffs on all ASEAN exports to 0 percent, and ASEAN members also reduce tariffs on Peruvian exports to 0 percent.
Moreover, conducting CGE simulations in this manner can identify the impact of complementary policies enacted alongside trade agreements.
Ex ante, there is reason to believe that a Pacific Alliance trade agreement with South Korea will have a muted effect on the Peruvian economy given that all members of the Pacific Alliance except for Mexico have existing trade agreements with South Korea. Nonetheless, the inclusion of Mexico into a potential Pacific Alliance agreement warrants further analysis on how Peru may be impacted. On the other hand, an agreement with ASEAN countries could, in theory, meaningfully influence the Peruvian economy given the collective size of the ASEAN market and the lack of existing agreements between Peru and these countries. However, tariffs between Peru and ASEAN countries are already relatively low, so a further reduction may, in reality, have a limited impact.
In addition to macroeconomic and sectoral impacts, we estimate the impact that these trade agreements will have on Peruvian employment across sectors and worker skill levels. We also provide estimates for how a complementary public investment drive to reduce transport costs (modeled as a decrease in shipping costs) could further increase gains from trade.
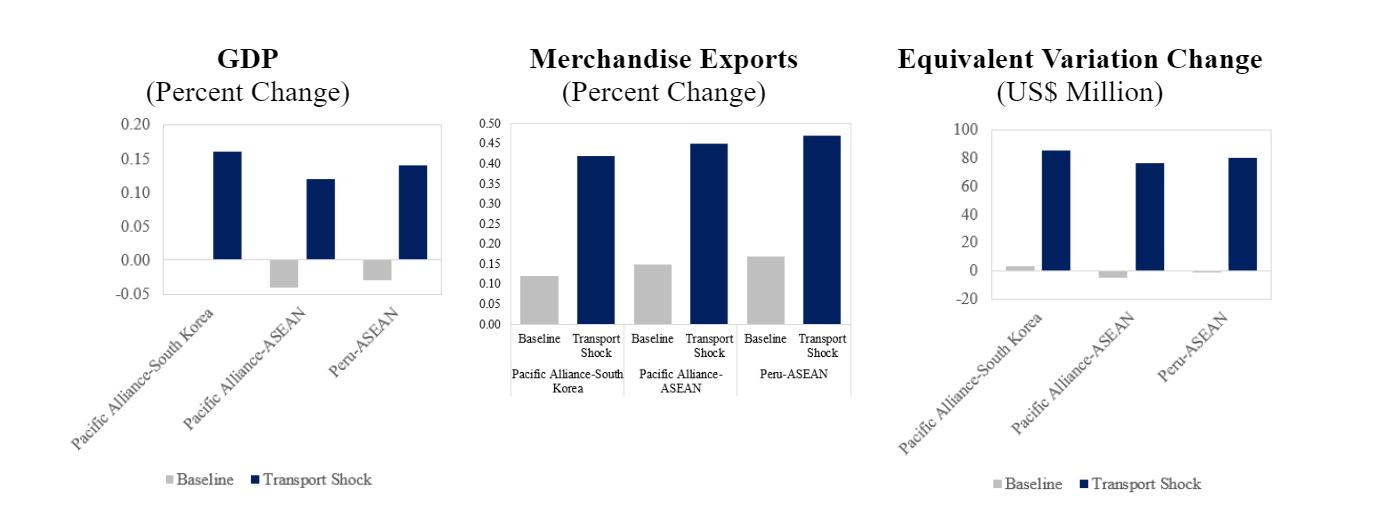
Macroeconomic effects of signing trade agreements are limited, especially without the introduction of complementary policy efforts.
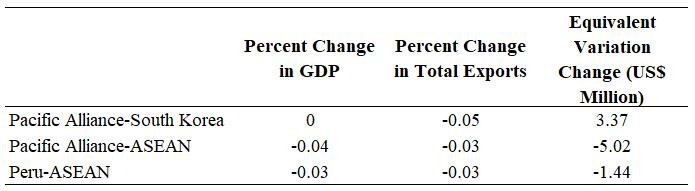
Across all three scenario simulations, the introduction of a trade agreement has a negligible effect on Peruvian GDP, ranging from no effect to a 0.03 percent decrease across all three simulations. Moreover, Peru’s aggregate trade balance is effectively unchanged across each simulation - with different sectors experiencing modest export gains and losses. However, even without a large macro impact, trade agreements could provide benefits to the economy such as reducing prices that both consumers and producers face. To analyze the impact that agreements have on economic welfare, we compute the change in equivalent variation for Peru – a measure which captures the impact that changes in prices have on agents’ income. For the Peruvian economy, equivalent variation changes are also muted across all three scenarios – ranging from an increase of $3.37 million in a Pacific Alliance-South Korea trade agreement to a $5.02 million decrease in a Pacific AllianceASEAN trade agreement scenario.
The absence of large-scale macroeconomic impacts or economic welfare gains is likely attributed to the already very low tariff rates in
Source: GTAP 10 Results
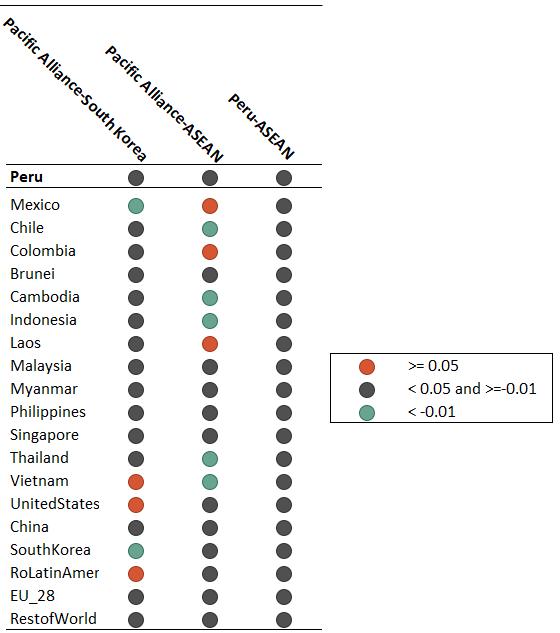
the Peruvian economy. As a result, decreases in the tariff rates stemming from trade agreements represent a relatively small magnitude shock for the economy. This reality is corroborated by the fact that Peru experiences effectively no change in its terms of trade across all scenarios when compared to the counterfactual world where these trade agreements do not exist (Figure 14).
Introducing complementary policies, particularly those aimed at decreasing transport costs, could multiply the economic effect of signing trade agreements.
To consider the impact of complementary policies and trade, we introduce a 5 percent positive shock on productivity in trade margin services used for
exports from Peru. This shock can be understood as a reduction in Peruvian transport costs which could result from increased infrastructure investment. A successful public investment drive (in ports, roads, telecommunications, etc.) could result in complementary trade infrastructure, facilitating more efficient transportation. The diverse geographic landscape of Peru presents
difficulties for producers looking to increase their export potential. Greater connectivity between inland regions in Peru and the coast could facilitate increased exports, particularly for agricultural sectors. Under these shock scenarios, we find that the impacts of trade agreements are even more positive than our baseline simulations. The lack of large macroeconomic impacts in our baseline
highlights that trade policy, alone, will not bring about economic prosperity. Rather, combining trade policy with other complementary economic development policies – such as increased infrastructure investment – leads to greater gains from trade.
Sector-level impacts are substantial, with certain sectors experiencing large gains in exports and others struggling to compete with trading partners.
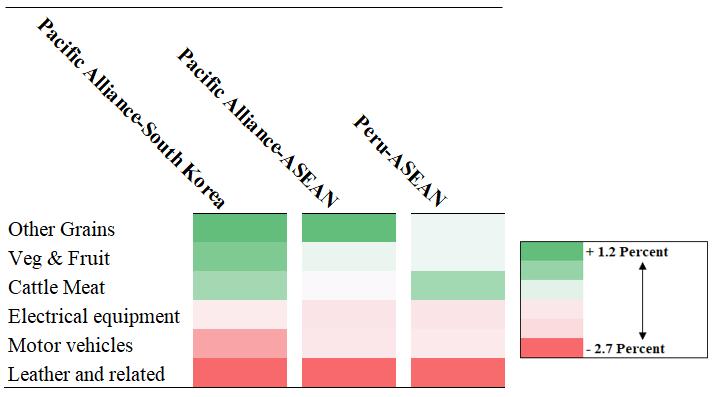
While the macro effects from trade agreements are not substantial in our simulations, these high-level results conceal more complex sectoral results. The Pacific Alliance and ASEAN countries have domestic exporters who operate in the same sectors, such as textiles and leather products. With greater trade integration, exporters with the lowest costs will ultimately reap the benefits of a trade agreement. Figure 16 below highlights that Peruvian food exporters are likely to gain the most from a trade agreement, while exporters in
Source: GTAP 10 Results
leather products, electronic products, and motor vehicles will be crowded out by more competitive producers in the ASEAN countries.
Given the success that prior trade liberalization has had for Peru’s agricultural sector, a further opening up of Peru’s markets to more trading partners would provide Peru with additional opportunities to expand its markets and increase growth in the sector at home. Our results suggest that an FTA between the Pacific Alliance and South Korea could significantly increase the production of certain grains, as well as fruits and vegetables. The extent to which this increase in trade translates to broader economic welfare gains is dependent upon adequate standards and protections for labor. Thus, it is crucial to complement trade liberalization policies with other domestic policies supporting workers in
these sectors (e.g., regulations regarding safer working conditions, higher wages, etc.).
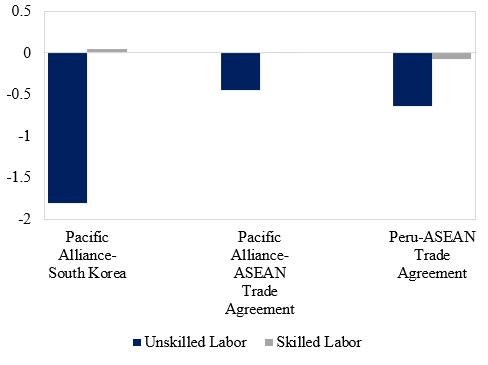
The diverse impact of trade agreements could lead to variations in employment across sectors and skill levels.
Sectors that can grow their export potential in these trade agreements will demand more labor in order to do so. For Peru, producers in the food and cattle meat export sector will demand more labor while producers who are crowded out by more cost-competitive ASEAN firms in electrical equipment, motor vehicles, and leather products will decrease their demand for labor the most. Overall, there is a much more negative impact on demand for low-skilled workers than high-skilled workers across all three scenarios. Intuitively, this change could be driven by firms seeking to
Source: GTAP 10 Results
increase the quality of their outputs when faced with greater ASEAN competition.
To estimate the number of jobs gained and lost by industry and skill-level, we multiply sectorand skill-specific changes in employment demand from GTAP 10 by the number of highskill workers (completed high school) and lowskill workers (did not complete high school)
employed in that sector. Employment numbers are pulled from the 2019 National Household Survey from the National Institute of Statistics and Informatics (INEI) (See Annex 3).62
Academic literature suggests that employment growth in informal and formal sectors due to trade-induced demand, while both directionally similar, are not the same in magnitude.
Source: GTAP 10 Results, Authors' analysis
GoutamSource: GTAP 10 Results
et al. (2017) find that the informal sector grows at approximately 70 percent of the estimated effect that trade-induced demand has on the formal sector.63 Thus, we multiplied employment figures in the informal sector across industries by 70 percent of the estimated GTAP 10 coefficients to consider the differences in employment growth rates between the informal and formal sectors.
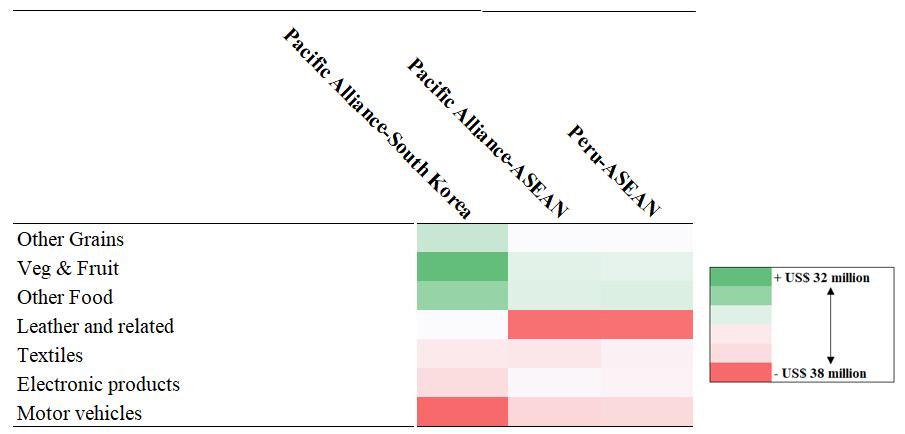
We find that the Pacific Alliance-South Korea agreement creates approximately 7,000 jobs in Peru, with large job gains in agriculture (5,600) and large job losses in manufacturing64 (-262). All regions see overall job gains, however informal, low-skill workers in the Lima Metropolitan area lose jobs on the net (-149).
The Pacific Alliance-ASEAN agreement and the Peru-ASEAN agreement show similar effects on employment, with slightly large effects in the former. The agreement with the Pacific Alliance creates approximately 1,400 jobs, while the agreement with Peru creates about 1,300. Again, we predict large job gains in agriculture (1,095 and 1,108, respectively), construction (322 and 393, respectively), and mining (190 and 152, respectively) and large job losses in manufacturing (-362 and -262, respectively). Leather production sees especially large job loss
(-1,000 for both agreements). Only two of seven regions - Lima and Costa Norte (-19 and -34 AND -42 and -61, respectively) - see overall job losses. These net losses are small, though concentrated among informal, low-skill workers in these regions.
The varied impacts of the trade agreement simulations highlight that agreements will have unequal impacts across industries. Similarly, the effects of any agreement will be felt differently across the formal and informal sectors. The majority of the benefits from FTAs are accruing to the roughly 20 percent of the population that is in the formal sector. In other words, as much as 80 percent of Peruvian workers may be largely unaffected by FTAs. Moreover, estimates suggest that even to the extent that FTAs have a marginal effect on lower-skilled, informal work, the direction of the incentive is negative (e.g., negatively impacts low-skill workers, potentially pushing workers and firms away from formalization, not towards it). Considerations of potential negative impacts on low-skilled workers should be accounted for as Peru contemplates the potential impacts that future FTAs could have on the economy.
The results from our CGE simulations demonstrate that the Peruvian sectors with the greatest comparative advantage, such as vegetables and fruit exports, will experience the largest gains from greater trade integration with Asia. These gains are moderated by export losses in less competitive industries - leading to a minimal overall macroeconomic effect. While export gains offset losses at the macro level, labor markets in vulnerable sectors will be particularly hard hit. These labor impacts underscore the need for policies to support labor markets in sectors with the greatest job losses and facilitate training programs to meet the increased labor demand in sectors with the greatest export growth.
The job losses in Peru’s textile sector are largely attributed to its high number of free trade agreements, which opened the sector to external competition from Southeast Asia. Indeed, our computable general equilibrium analysis suggests a decline in textile exports of 0.32 percent if the Pacific Alliance signs an FTA with ASEAN. This result is likely driven by the Southeast Asian textile competitive advantage and ability to undercut the pricing of the Peruvian textile sector, leading to a decline in business for Peruvian firms. The model also shows a decline of 0.26 percent in leather and related products exports but an increase of 0.29 percent in apparel exports.
The fact that there are industries negatively affected is not a reason to abandon free trade agreements altogether; rather, it suggests that Peru must be strategic about how FTAs are negotiated and how complementary policies are implemented. For example, knowing the negative effects that prior FTAs had on its textile sector, Peru could consider policies to protect or ease the transition away from this sector if it is deemed important to maintain. These policies could take the form of “fair trade” provisions related to vulnerable sectors (e.g., any future FTA with large textile-producing countries should include strong anti-dumping measures at a minimum and perhaps more specific sector-level protections). In addition to easing the transition
for vulnerable sectors, these provisions could also moderate any social unrest resulting from the impacts of a trade agreement.
One sector that may be particularly vulnerable in an ASEAN trade agreement is textiles. ASEAN textile producers generally have lower costs than their Peruvian counterparts – driven by the availability of low-skilled/semi-skilled labor at relatively low costs. This cost advantage also results from poor working conditions in these economies. The International Labour Organization in its 2022 report on the Asian garment sector concluded that “Although real wages in the sector have increased in most countries, working conditions remain poor in general, with high levels of insecurity and precariousness.”65 Poor working conditions are a function of the high use of informal labor in this sector and the temporary nature of the work. It is not an uncommon sight in Asia to see people gathered outside garment factories early in the morning hoping to be called in for a day’s work.
On the net, this analysis reinforces the idea that trade policy is unlikely to deliver economic growth in isolation. Complementary policies aimed at reducing non-tariff costs (i.e., transport costs) are necessary to support export growth and economic development in Peru.
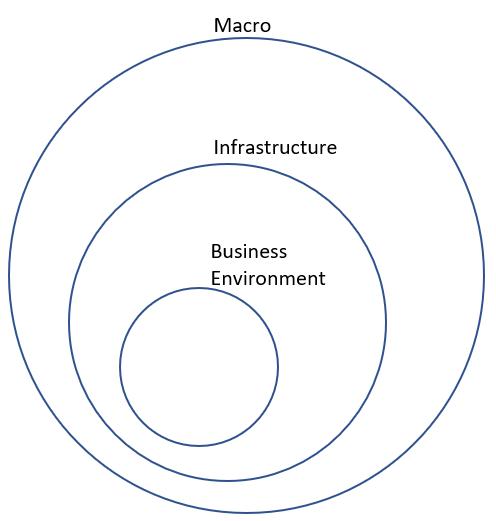
The retrospective analysis of Peruvian trade agreements highlights a decreasing marginal benefit of FTAs and underscores the importance of reducing non-tariff trade costs in maximizing the impact of trade agreements. Indeed, the simulations of the three potential trade agreements had negligible macroeconomic benefits in absence of a shock to transport costs (a non-tariff cost). Together, these results reinforce the need for complementary policies to be adopted alongside trade policy. To maximize the benefits of trade agreements, policies should address issues at each level of the international trade environment (depicted in Figure 19). While trade policy is generally discussed with only macroeconomic considerations in mind, it is crucial to also adopt policies that increase the ability of businesses to capitalize on international trade and provide the necessary infrastructure (roads, ports, telecommunications, etc.) to increase transport efficiency.
Source: Authors’ Analysis
to international trade (and resulting increases in financial flows) is also a critical consideration in international trade policy. With these factors in mind, we detail five specific recommendations to optimize Peru’s trade policy approach and promote broader economic development.
1. Align trade policy with economic development policy.
International trade has many consequences that can affect economic development. Trade agreements often have an effect of promoting the growth of certain industries (while also negatively impacting other industries). Our CGE results highlight how lowering trade barriers tends to benefit those sectors in which Peru enjoys a comparative advantage relative to its trading partners (i.e., agriculture, mining). If the growth (or decline) of these specific sectors is not aligned with Peru’s broader economic development agenda, trade policy could restrain the country’s broader development objectives. In particular, the growth in exports of agricultural and mining products has been a key consequence of Peru’s trade policy. The gains for these sectors have important knock-on effects on other sectors –diverting resources away from investing in the development of higher value-added sectors. As Peru seeks to diversify its economy and shift towards producing more sophisticated products, exploiting the complementarities between trade policy and development objectives (i.e., by excluding or protecting strategic sectors) is key to increasing the gains from trade for all.
2. Reduce non-tariff trade costs to promote exports and investment.
The international trade environment has become increasingly complex and requires careful consideration of both the trade and nontrade effects of signing new agreements. It is particularly important to assess the distributional consequences of trade agreements, as Peru’s experience with trade agreements highlights that gains from trade are not evenly shared. Creating an economic environment conducive
Our analysis highlights that Peru’s trade costs are predominantly non-tariff related, as the country has low prevailing tariffs across most sectors. Since tariffs are already low, any agreement resulting in a further reduction is unlikely to meaningfully increase trade volumes. This is corroborated by the results from the three CGE scenarios considered. Peru should focus instead on reducing non-tariff costs alongside trade agreements. The transport shock discussed in Section 4 illustrates how complementary policies
significantly increase the positive effects of trade. In addition to physical infrastructure, Peru should seek to enhance its digital infrastructure by improving its country-wide data policy. These reforms would increase the efficiency of Peruvian trade and could also support greater FDI inflows resulting from a trade agreement. Policies aimed at increasing public and private investment will help Peru reduce non-tariff trade costs, increasing the impact of trade agreements on export growth. Creating a national development bank or dedicated economic development agency could support a reduction in non-tariff trade costs by providing technical assistance to help exporters enter new markets. Moreover, a development bank could support the management of increased investment flows alongside a trade agreement. Chile’s CORFO (Corporación de Fomento de la Producción) provides an example of how a national development bank could be structured.

Results from our CGE simulations demonstrate that certain sectors are more adversely affected by trade agreements than others. Low-skilled workers also experience worse outcomes than high-skilled workers. Sectors that are likely to experience negative employment effects from signing a trade agreement include textiles and leather goods. In these circumstances, the use of certain tariff provisions, like a tariff reduction schedule, can ease employment transitions and could mitigate the employment costs of an agreement. However, negotiating tariff provisions to support domestic industries should only be used in cases where the impact of an agreement is likely to have significant, disruptive effects.
Labor standards are critical to safeguard the competitiveness of industries with strong, ASEAN counterparts (e.g., textiles). Labor standards in ASEAN countries lag behind the global trend and could provide ASEAN members with an unfair advantage. Including labor provision in trade negotiations will avoid a race to the bottom on labor standards that would hurt Peruvian industry and workers. Antidumping measures
can also protect against unfair competition, but in practice these clauses are difficult to enforce. Penalties for employing unfair labor standards should be included in any agreement with clear language defining the enforcement of trade penalties for unfair labor practices (such as child labor).
5. Establish a stakeholder committee to receive inputs for potential trade agreements.
An analysis of Peru’s approach to trade negotiations highlights that certain stakeholders are more involved in discussions of potential agreements than others. Given that trade agreements have a variety of direct and indirect effects on many sectors, a more representative deliberation process could improve Peru’s assessment of future trade agreements. A stakeholder committee could be used to solicit feedback from industry participants as Peru begins its process of considering a potential trade agreement. This body would not have any decision-making power, but rather would be used to ensure that Peru considers a more comprehensive assessment of the impact of trade agreements – understanding the potential impacts across all sectors. Brazil’s CEBRI (Centro Brasileiro de Relações Internacionais) provides one example of how these committees can be structured.
Peru remains committed to multilateralism and greater regional trade cooperation. For the past three decades, Peru has consistently pursued trade liberalization through a variety of trade agreements. Despite this, regional economic integration and trade cooperation remain limited. The Pacific Alliance has played an important role in recent multilateral trade cooperation, though domestic political pressures in member states may be limiting the effectiveness of the bloc. As a result, Peru's approach now consides both bilateral and multilateral trade agreements to support trade liberalization efforts.
Our quantitative analysis highlights that the macroeconomic effects of Peru signing additional free trade agreements alone are limited. This result is consistent with our analysis of Peruvian trade costs, where the vast majority of costs are composed of non-tariff barriers. Yet, the muted impact of trade agreements masks substantial heterogeneity in performance across domestic industries. The sectors in which Peru enjoys comparative advantage (i.e., agricultural products and mining) are likely to experience the largest export gains while exports from sectors with robust competition (i.e., automobiles, leather, and textiles) are likely to be crowded out by more cost-competitive firms in partner countries. Moreover, trade agreements have a disproportionately negative effect on lowskilled workers when compared to highskilled workers. The correlation between lowskilled work and the informal sector suggests that the informal sector may face negative
consequences from trade liberalization, which is particularly important given that approximately 80 percent of the Peruvian workforce operates in the informal sector. Substantial variation in sector performance and employment outcomes underscores the need for a comprehensive assessment of the distributional consequences of trade policy.
Our results suggest that trade agreements push Peru toward its competitive advantage in low-complexity exports and may inhibit the development of sectors producing higher value-added products. To minimize these negative effects of trade agreements and maximize economic gains from trade, Peru’s trade policy should be just one tool in a suite of complementary economic policies. Aligning trade policy priorities with economic development objectives and public investment plans will deliver greater returns than signing an agreement in isolation. In particular, efforts to reduce non-tariff trade costs, such as transport, can reduce costs for domestic producers and increase profits. Having the capacity to manage trade-related financial inflows is also central to maximizing the effects of trade policy. The Peruvian government should develop strategies to attract and manage FDI inflows alongside trade agreements and adopt adequate policy frameworks for key issues like data policy. Clear frameworks can increase stability for investors, helping to attract foreign inflows. Capitalizing on the economic development potential of trade agreements requires an integrated policy approach, with trade negotiations reinforcing Peru’s development objectives.
African Development Bank. (n.d.). Asia 2050 Realizing the Asian Century Executive Summary. Manila: African Development Bank.
Aguiar, A., Chepeliev, M., Corong, E, McDougall, R., and van der Mensbrugghe, D. (2019). “The GTAP Data Base: Version 10.” Journal of Global Economic Analysis 4 (1): 1–27.
Alfaro, L., Kalemli-Ozcan, S., and Sayek, S. (2009). “FDI, Productivity, and Financial Development.” The World Economy 32 (1): 111–35.
Anderson, J. E. (1979). “A Theoretical Foundation for the Gravity Equation.” The American Economic Review 69 (1): 106–16.
Aquino, M., and Marguerita, C. (2022). “Peru Proposes ‘New Approach’ to Mining to Combat Economic Disparities, Conflicts.” Reuters, September 30, 2022.
Arbeláez, M. A., Higuera, S., Steiner, R., & Zuluaga, S. (2018). “Protecting “Sensitive” Agricultural Products in Colombia: A Political Economy Approach.” Coyuntura Económica XLVIII (1,2): 153–205.
ASEAN Secretariat. (2020). “ASEAN Member States.” Association of Southeast Asian Nations
Bae, C., and Jang, Y.J. (2013). “The Impact of Free Trade Agreements on Foreign Direct Investment: The Case of Korea.” Journal of East Asian Economic Integration 17 (4): 417–45.
Bonett, D. et al. (2022). Peru: Evolution of Employment and Income Indicators by Department, 20072021. Lima, Peru: National Institute of Statistics and Informatics (INEI).
Borchert, I., Larch, M., Shikher, S., and Yotov, Y. (2022). “The International Trade and Production Database for Estimation - Release 2 (ITPD-E-R02),” USITC Working Paper 2022–07–A, U.S. International Trade Commission, Washington, D.C.
Burfisher, M. (2017). Introduction to Computable General Equilibrium Models. Cambridge, UK: Cambridge University Press.
Cameron, M.A. (1991). “The Politics of the Urban Informal Sector in Peru: Populism, Class, and ‘Redistributive Combines’.” Canadian Journal of Latin American and Caribbean Studies 16 (31):
79–104.
Cervantes, M., Laing, A., and Ellis, A. (2020). “Peruvian President ‘Deplores’ Two Deaths in Farm Workers Protest, Vows to Sanction Police.” Reuters, December 31, 2020.
Civicus. (2021). “Communities Impacted by Mining and Oil Extraction Lead Wave of Protests in Peru.” Civicus, December 2, 2021.
Coqui, B. M. (2021). “Why Mexico’s Relationship with China Is So Complicated.” Americas Quarterly, September 28, 2021.
Corong, E., Hertel, T., McDougall, R., Tsigas, M., and Van der Mensbrugghe, D. (2017). “The Standard Gtap Model, Version 7.” Journal of Global Economic Analysis 2 (1): 1–119.
Council on Foreign Relations. (2021). “Mercosur: South America’s Fractious Trade Bloc.” Backgrounder, Council on Foreign Relations, Washington, DC.
———. (2022). “What is ASEAN?” Backgrounder, Council on Foreign Relations, Washington, DC.
Cross Border Privacy Rules System. (2022). “About CBPRS”, Cross Border Privacy Rules System
Dix-Carneiro, R. et al. (2021). “Informality and the Effects of Trade in Developing Countries.” NBER Working Paper No. 28391, NBER, Cambridge, MA.
Dudenhoefer, D. (2018). “As Peru’s Agricultural Production Grows, Smallholders Long for Better Markets”, World Bank Blogs, March 15, 2018.
Duong, M., Holmes, M.J., and Strutt, A. (2021). “The Impact of Free Trade Agreements on FDI Inflows: The Case of Vietnam.” Journal of the Asia Pacific Economy 26 (3): 483–505.
Eichengreen, B., Mehl, A., and Chițu, L. (2019). “Mars or Mercury Redux: The Geopolitics of Bilateral Trade Agreements.” European Central Bank Working Paper No. 2246, Frankfurt, Germany.
Engen, L. (2017). “Labour Provisions in Asia-Pacific Free Trade Agreements.” Background Paper No.1, United Nations Economic and Social Commission for Asia and the Pacific, Bangkok, Thailand.
European Commission. (n.d.) “Adequacy Decisions: How the EU Determines If a Non-EU Country Has an Adequate Level of Data Protection.” European Commission, Brussels, Belgium.
Fugazza, M., and Fiess, N. (2010) “Trade Liberalization and Informality: New Stylized Facts.” United Nations: Policy Issues in Internality Trade and Commodities Study Series No. 43, United Nations Conference on Trade and Development, United Nations, New York, NY and Geneva, Switzerland.
Goutam, P., Gutierrez, I.A., Kumar, K/B/, and Nataraj, S. (2017). “Does Informal Employment Respond to Growth Opportunities? Trade-Based Evidence from Bangladesh.” RAND Corporation Working Paper 1198, RAND Corporation, Santa Monica, CA.
Grossman, G., and Helpman, E. (1995). “The Politics of Free-Trade Agreements.” American Economic Review 85 (4): 667–90.
Hinz, J. (2017). “The Ties That Bind: Geopolitical Motivations for Economic Integration.” Kiel Working Paper 2085, Kiel Institute for the World Economy, Kiel.
International Labour Organization. (n.d.) “Informal Economy.” Decent Work for Sustainable Development (DW4SD) Resource Platform, International Labour Organization, Geneva, Switzerland.
———. (2022a). “NORMLEX: Information System on International Labour Standards.” Database, International Labour Organization, Geneva, Switzerland.
———. (2022b). Employment, Wages and Productivity Trends in The Asian Garment Sector: Data And Policy Insights For The Future Of Work. Bangkok, Thailand: ILO Printing Press.
International Monetary Fund. (2021). “Coordinated Direct Investment Survey (CDIS).” Database, International Monetary Fund, Washington, DC.
———. (2022). “Regional Economic Outlook: Asia and Pacific.” Database, International Monetary Fund, Washington, DC.
Intersoft Consulting. (n.d.) “General Data Protection Regulation (GDPR).” Intersoft Consulting
Isabel, M. (2022). “Peru Apparel Industry Welcomes Tariff Barrier to Block Import Surge.” Just Style, February 10, 2022.
Korynevych, V. (2022). “Peru’s Struggle to Balance Foreign Investors’ Rights and Local Communities’ Demands.” Jones Day, May 2022.
La Republica Staff. (2022). “Embassy of China: Trade volume between the two countries exceeded US$ 37,000 million in 2021.” La Republica, June 17, 2022.
Leon, A., Wilkinson, T., and McDonnell, P. (2022). “In Peru, President’s Ouster Just Latest Manifestation of Extreme Political Turmoil.” Los Angeles Times, December 11, 2022.
Listiyorini, E., and Raghu, A. (2022). “Food Protectionism Grows as Indonesia Curbs Palm Oil Exports.” Bloomberg News, March 9, 2022.
McKenzie, B. (n.d.) “Binding Corporate Rules.” Baker McKenzie.
Medvedev, D. (2012). “Beyond Trade: The Impact of Preferential Trade Agreements on FDI Inflows.” World Development 40 (1): 49–61.
MercoPress Staff. (2007). “Escalating Protests in Peru with At Least Three Dead.” MeroPress: South Atlantic News Agency, July 13, 2007.
———. (2021). “Ecuador wants to become a full member of the Pacific Alliance.” Merco Press, September 1, 2021.
Merke, F., Stuenkel, O., and Feldmann, A. (2021). Reimagining Regional Governance in Latin America. Washington, DC: Carnegie Endowment for International Peace.
Mexican Ministry of Foreign Relations. (2021). “Mexico temporarily suspends visa exemption for citizens of Ecuador.” Joint Press Release, Ministry of Foreign Relations and Ministry of the Interior, Mexican Government, Mexico City, Mexico.
Mildebrath, H. (2020). “The CJEU Judgment in the Schrems II Case.” European Parliamentary Research Service, Brussels, Belgium.
National Board of Trade Sweden. (2014). No Transfer, No Trade: The Importance of Cross-Border Data Transfers for Companies Based in Sweden. Stockholm, Sweden:
National Institute for the Defense of Competition and the Protection of Intellectual Property. (2022a). “Indecopi Imposed Provisional Antidumping Duties on 100% Polyester Plain Weave Fabrics Imported from China.” Press Releases, INDECOPI, August 25, 2022.
———. (2022b). “Indecopi Modifies Antidumping Duties on Chinese Footwear to Benefit National
Production.” Press Releases, INDECOPI, March 22, 2022.
Novy, D. (2013). “Gravity Redux: Measuring International Trade Costs with Panel Data.” Economic Inquiry 51 (1): 101–21.
Organisation for Economic Cooperation and Development. (2016). Multi-dimensional Review of Peru (Volume 2): In-Depth Analysis and Recommendations. Paris, France: Organisation for Economic Cooperation and Development.
Peinhardt, C, Kim, A.A., and Pavon-Harr, V. (2019). “Deforestation and the United States–Peru Trade Promotion Agreement.” Global Environmental Politics 19 (1): 53–76.
Peruvian Ministry of Foreign Trade & Tourism. (n.d.a.) “General Directorate of International Trade Negotiations.” MINCETUR, Lima, Peru.
———. (n.d.b.) “Organization.” MINCETUR, Lima, Peru.
———. (n.d.c.) “Peru: Anti-Dumping Measures Applied to Textiles of Chinese Origin.” Conjunctural Report No. 004, MINCETUR, Lima, Peru.
———. (n.d.d.). “Trade Agreements in Peru.” MINCETUR, Lima, Peru.
———. (2014). “Ministerial Resolution No. 146-2014.” MINCETUR, Lima, Peru.
———. (2022). “Monthly Trade Report - September 2022”. MINCETUR, Lima, Peru.
Peruvian National Institute of Statistics and Informatics (INEI). (2021). “National Household Survey (ENAHO) 2019.” Database, National Institute of Statistics and Informatics (INEI), Lima, Peru.
Post, C. (2016). “Peru: Chinese Imports Devastate Lima’s Garment District.” Peru Reports, September 20, 2016.
Ramírez, S. (2013). “Regionalism: The Pacific Alliance.” Americas Quarterly, April 22, 2013.
Rochabrun, M. (2021). “Analysis: Peru’s Las Bambas Standoff Tests Castillo’s Mining Reform Pledges.” Reuters, October 4, 2021.
Rodriguez, K., and Alimonti, V. (2020). “The State of Communication Privacy Law in Peru.” Electronic Frontier Foundation (EFF)
Rodrik, D. (2018). “What Do Trade Agreements Really Do?” Journal of Economic Perspectives 32 (2):
73–90.
Scheve, K.F., and Slaughter, M.J. (2001). “What Determines Individual Trade-Policy Preferences?” Journal of International Economics 54: 267–92.
Securiti. (n.d.) “What You Need to Know About Peru’s Data Protection Law.” Securiti.
Sica, D., and Malamud, A. (2021) “Mercosur Sinks Into Irrelevance.” La Nación, March 25, 2021.
Slack, K. (2014). “Peru’s Mining Money: Something Isn’t Working.” Oxfam, June 24, 2014.
Solomon, I. (2016). “The Peru Trade Deal Turns Ten: The Consequences of Irresponsible Trade Past, Present, And Future.” Sierra Club, April 12, 2016.
The Borgen Project. (2021). “Examining the Pros and Cons of Mining in Peru.” Borgen Magazine, March 32, 2021.
The Pacific Alliance. (2022). “The XVI Summit of the Pacific Alliance culminates with the signing of the Free Trade Agreement with Singapore and the signing of a Declaration on Creative Economy.” Press Releases, The Pacific Alliance.
The White House. (2022). “Fact Sheet: President Biden Signs Executive Order to Implement the European Union-U.S. Data Privacy Framework.” The White House Briefing Room, October 7, 2022.
Tobias, B. (2022). “Bangladesh Fire: Nearly 50 Killed, Hundreds Injured in Depot Blast.” BBC News, June 5, 2022.
Trachtenberg, D.M., and Archick, K. (2022). “U.S.EU Trans-Atlantic Data Privacy Framework.” CRS Report, Congressional Research Service, Washington, DC.
U.S. Chamber of Commerce, and Hunton & Williams LLP. (2014). Business Without Borders: The Importance of Cross-Border Data Transfers to Global Prosperity. Washington, DC: U.S. Chamber of Commerce, and Hunton & Williams LLP.
U.S. International Trade Administration Staff. (2022a). “Peru - Country Commercial Guide: Mining Equipment and Machinery.” U.S. International Trade Administration, Washington, DC.
———. (2022b). “Peru - Country Commercial Guide: Textiles and Apparel.” U.S. International Trade Administration, Washington, DC.
———. (2022c). “Peru – Country Commercial Guide: Agriculture Sectors.” U.S. International Trade Administration, Washington, DC.
United Nations Conference on Trade and Development. (2015). “Foreign Direct Investment: An Important Source of External Development Financing for The Poorest Economies.” News, United Nations Conference on Trade and Development, Geneva, Switzerland.
———. (2022). World Investment Report 2022. Geneva, Switzerland: United Nations Conference on Trade and Development.
United Nations Economic and Social Commission for Asia and the Pacific. (2022). “UNESCAP-World Bank Trade Cost Database.” Database, United Nations Economic and Social Commission for Asia and the Pacific, Bangkok, Thailand.
World Bank (2021). “Employment in Agriculture (% of Total Employment) (Modeled ILO Estimate) – Peru.” World Bank Data, World Bank, Washington, DC.
———. (n.d.). “Exports of goods and services (%
of GDP).” World Bank Data, World Bank, Washington, DC.
———. (2022). “Tariff rate, applied, simple mean, all products (%) – Peru.” World Bank Data, World Bank, Washington, DC.
World Data. (2022a). “Asylum applications and refugees in Ecuador.” Database, World Data.info, Oldenburg Germany.
———. (2022b). “Countries of origin and destination of refugees, 2021.” Database, World Data.info, Oldenburg Germany.
World Trade Organization. (2022). “Regional Trade Agreements Database.” Database, World Trade Organization, Geneva, Switzerland
Yeyati, E.L., Stein, E.H., and Daude, C. (2003). “Regional Integration and the Location of FDI.” Working Paper, No. 492, Inter-American Development Bank, Research Department, Washington, DC.
Yotov, Y.V., Piermartini, R., and Larch, M. (2016). An Advanced Guide to Trade Policy Analysis: The Structural Gravity Model. Washington, DC: World Trade Organization iLibrary.
The standard GTAP model used in our analysis is a multi-region, multi-sector Computable General Equilibrium (CGE) model with perfect competition and constant returns to scale. A graphical depiction of the structure of the model is shown in Figure A1. While the data underlying the tool has been updated in GTAP10, the
standard model still closely resembles the model used in GTAP7. A detailed discussion of model parameters and setup is discussed in Corong, Hertel, McDougall, Tsigas, and Van der Mensbrugghe (2017).66
Source: Brockmeier, M. 2001. A graphical exposition of the GTAP model. GTAP Technical Paper No. 8.
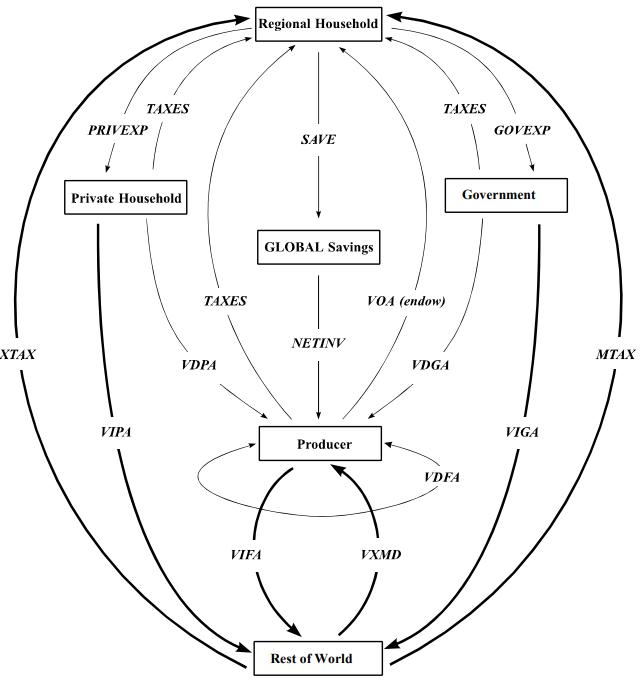
Established in May 2018, the European Union’s General Data Protection Regulation (GDPR) is the global gold standard when it comes to data privacy with dozens of countries subsequently adopting several of its provisions. The GDPR requires businesses to protect the personal data and privacy of EU citizens during any transaction that occurs in an EU member state, meaning the law regulates both whether and how personal data can leave the EU.67 In practical terms, this means that data transfers out of the EU are prohibited unless the data importer is in an adequate thirdparty country, the business has adopted standard contractual clauses (SCCs), or the corporation has had its binding corporate rules (BCRs) approved by the data authority. As of November 2022, only the following 13 territories outside of the EU have been designated adequate third parties by the European Commission, indicating that their data standards are strong enough to allow the transfer of EU citizens’ personal data: Andorra, Argentina, Canada, Faroe Islands, Guernsey, Israel, Isle of Man, Japan, Jersey, New Zealand, South Korea, Switzerland, and Uruguay.68
Companies operating outside of those territories - including those in Peru - must adopt SCCs or BCRs, which allow corporations to transfer data internationally only to subsidiaries within their corporate holding group. Multilateral organizations tend to prefer BCRs to SCCs because they are approved by an EU supervisory data authority, whereas SCCs are based on self-assessments and can be challenged by the supervisory authority at any time.69 Because the EU views data protection as a fundamental right, data standards are not open for negotiation during trade discussions with the EU.70
Similar to the GDPR framework, the Asia-Pacific Economic Cooperation (APEC) created the CrossBorder Privacy Rules (CBPR) System in 2011 to
facilitate privacy-respecting data flows among APEC’s 21 economies, including Peru.71 Like European BCRs, the CBPR System enables crossborder data transfers among entities in the same corporate group. However, unlike BCRs, it also enables a data controller to transfer data to a controller or processor outside the corporate group and located in another country, providing broader latitude than the GDPR.72
While the System was developed and endorsed by all APEC members - with all committing to join - it is a voluntary system and an APEC economy must demonstrate that it can enforce compliance before participating in the CBPR System. Consequently, only nine countries have joined the System so far: the United States, Mexico, Japan, Canada, Singapore, South Korea, Australia, Chinese Taipei, and the Philippines; Peru has yet to put forth a compliance framework adequate enough for participation. If all APEC members, including Peru, follow through on their commitment to join the CBPR System, there may be increased potential for integration with ASEAN countries as seven countries are both APEC and ASEAN members.73
As noted above, Peru does not participate in either the GDPR nor CBPR frameworks. However, it has enforced the Law for Personal Data Protection (DPL) since July 2011, and in March of 2013, Supreme Decree No. 0032013-JUS expanded on existing requirements and provided rules regarding the regulation of personal data. The DPL was further amended by Legislative Decree No. 1353 in January of 2017. Despite revisions to its data standard, the DPL is much less stringent relative to those in other countries and lacks robust obligations for those collecting or processing personal data. For example, there are no mandatory legal requirements for data protection impact assessments, the appointment of data protection officers, or breach notifications.74 In addition, law enforcement agencies are excluded from the data protection laws, even maintaining access to real-time location data without a warrant in some circumstances.75
The DPL allows for cross-border data transfers only if the proposed recipient countries have adequate data protection mechanisms as strong as Peru’s and the transfer is conducted through a formal written binding contract. Even with these protections, transfers may only occur after a business receives prior, informed, express, and unequivocal consent from the data subject, with a handful of exceptions.
Data protection regulations have a positive impact on business models.
Regulations that protect personal data and how it’s handled by companies require a company to evaluate what data they collect and why, resulting in not only better privacy protections for users but more streamlined internal business processes. Also, many customers feel safer purchasing goods and services from a business that they know has high standards for data sharing. In fact, policies that allow companies to store data across different geographic locations increase security and provide flexible access.
Exclusionary data regulations reduce trade in all sectors.
Regulations that are too restrictive, such as data localization or consent requirements, lead to missed opportunities by creating delays that could make products late to market and adding costs. Barriers to cross-border data flows prevent the use of the most efficient and cost-effective technologies, such as cloud computing services used to outsource software and hardware. Without the ability to use cloud-based services, companies are forced to process data in several locations instead of one central location.
Fragmentation of national data protection rules increases the compliance burden.
Administrative and operational compliance costs can prove prohibitive as they require negotiating contracts to ensure data safety, clarifying data ownership, and purchasing external legal guidance. The burden becomes even bigger
when considering the patchwork of varied data policies globally. One study projected that the cost to the U.S. economy for simply reading privacy policies is $365 billion. In the EU, the cost of the administrative burden is 5.3 billion euros with 2.9 billion of that due to fragmentation within the EU.
Overly restrictive data regulations reduce innovation across sectors, including manufacturing.
Companies who engage in research and development (R&D) and are not located in an approved third-party country cannot share data to develop new products or services. For example, a prohibition on cloud services precludes data transfers between different R&D units. Because they cannot move data across borders, some companies have turned to moving developers themselves across borders, which poses new challenges like the cost of moving families and immigration procedures.
Source: GTAP 10 Results; INEI; Authors' Analysis
Source: GTAP 10 Results; INEI; Authors' Analysis

Source: GTAP 10 Results; INEI; Authors' Analysis
Pacific Alliance-South Korea
Source: GTAP 10 Results; INEI; Authors' Analysis
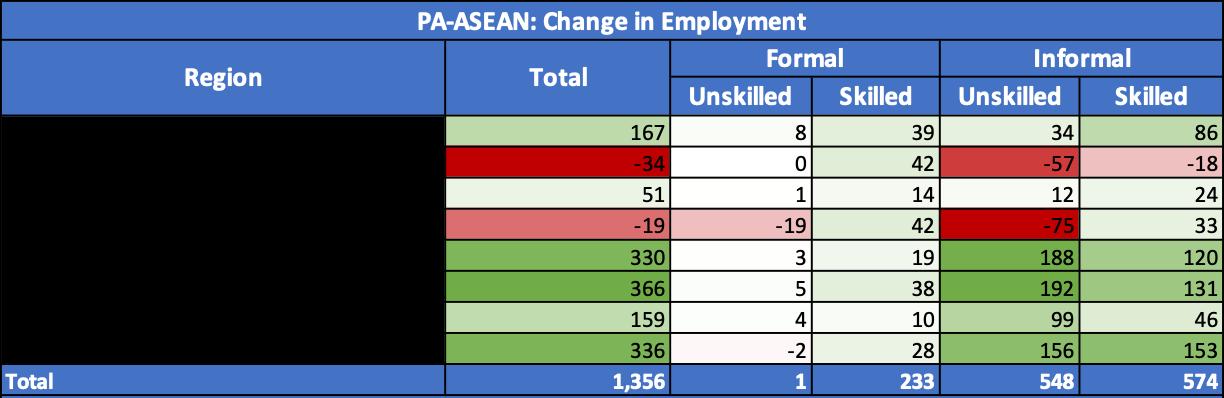
1 Peruvian Ministry of Foreign Trade and Tourism. (2022). “Monthly Trade Report - September 2022”. MINCETUR, Lima, Peru.
2 World Bank (2022). “Tariff rate, applied, simple mean, all products (%) – Peru.” World Bank Data, World Bank, Washington, DC.
3 Peruvian Ministry of Foreign Trade and Tourism (n.d.d.). “Trade Agreements in Peru.” MINCETUR, Lima, Peru.
4 World Trade Organization. (2022). “Regional Trade Agreements Database.” Database, World Trade Organization, Geneva, Switzerland
5 From a presentation by Mexico’s General Director of American Regional Organizations and Mechanisms Efrain Guadarrama Pérez.
6 World Bank. (n.d.). “Exports of goods and services (% of GDP).” World Bank Data, World Bank, Washington, DC.
7 The European Union is not shown separately in the figures in this section because the focus of analysis is at the country level.
8 Grossman, G., and Helpman, E. (1995). “The Politics of Free-Trade Agreements.” American Economic Review 85 (4): 667–90.
9 Hinz, J. (2017). “The Ties That Bind: Geopolitical Motivations for Economic Integration.” Kiel Working Paper 2085, Kiel Institute for the World Economy, Kiel.
10 Eichengreen, B., Mehl, A., and Chițu, L. (2019). “Mars or Mercury Redux: The Geopolitics of Bilateral Trade Agreements.” European Central Bank Working Paper No. 2246, Frankfurt, Germany.
11 Scheve, K.F., and Slaughter, M.J. (2001). “What Determines Individual Trade-Policy Preferences?” Journal of International Economics 54: 267–92.
12 MercoPress Staff. (2007). “Escalating Protests in Peru with At Least Three Dead.” MeroPress: South Atlantic News Agency, July 13, 2007.
13 Dudenhoefer, D. (2018). “As Peru’s Agricultural Production Grows, Smallholders Long for Better Markets”, World Bank Blogs, March 15, 2018.
14 World Bank (2021). “Employment in Agriculture (% of Total Employment) (Modeled ILO Estimate) – Peru.” World Bank Data, World Bank, Washington, DC.
15 U.S. International Trade Administration. (2022c). “Peru – Country Commercial Guide: Agriculture Sectors.” U.S. International Trade Administration, Washington, DC.
16 U.S. International Trade Administration Staff. (2022a). “Peru - Country Commercial Guide: Mining Equipment and Machinery.” U.S. International Trade Administration, Washington, DC.
17 Ibid.
18 Rochabrun, M. (2021). “Analysis: Peru’s Las Bambas Standoff Tests Castillo’s Mining Reform Pledges.” Reuters, October 4, 2021.
19 Korynevych, V. (2022). “Peru’s Struggle to Balance
Foreign Investors’ Rights and Local Communities’ Demands.” Jones Day, May 2022.
20 According to the International Labour Organization, the “informal economy” is comprised of workers who are unregistered and unrecognized by state governments and whose work is characterized by small or undefined workplaces, unsafe and unhealthy working conditions, low levels of skills and productivity, low or irregular incomes, long working hours and lack of access to information, markets, finance, training and technology. For more, see International Labour Organization (n.d.)
21 Fugazza, M., and Fiess, N. (2010) “Trade Liberalization and Informality: New Stylized Facts.” United Nations: Policy Issues in Internality Trade and Commodities Study Series No. 43, United Nations Conference on Trade and Development, United Nations, New York, NY and Geneva, Switzerland.
22 Cameron, M.A. (1991). “The Politics of the Urban Informal Sector in Peru: Populism, Class, and ‘Redistributive Combines’.” Canadian Journal of Latin American and Caribbean Studies 16 (31): 79–104.
23 Peruvian Ministry of Foreign Trade & Tourism. (n.d.c.) “Peru: Anti-Dumping Measures Applied to Textiles of Chinese Origin.” Conjunctural Report No. 004, MINCETUR, Lima, Peru. 24 Post, C. (2016). “Peru: Chinese Imports Devastate Lima’s Garment District.” Peru Reports, September 20, 2016.
25 Isabel, M. (2022). “Peru Apparel Industry Welcomes Tariff Barrier to Block Import Surge.” Just Style, February 10, 2022.
26 National Institute for the Defense of Competition and the Protection of Intellectual Property. (2022a). “Indecopi Imposed Provisional Antidumping Duties on 100% Polyester Plain Weave Fabrics Imported from China.” Press Releases, INDECOPI, August 25, 2022.
27 National Institute for the Defense of Competition and the Protection of Intellectual Property (2022b). “Indecopi Modifies Antidumping Duties on Chinese Footwear to Benefit National Production.” Press Releases, INDECOPI, March 22, 2022.
28 Civicus. (2021). “Communities Impacted by Mining and Oil Extraction Lead Wave of Protests in Peru.” Civicus, December 2, 2021.
29 Merke, F., Stuenkel, O., and Feldmann, A. (2021). Reimagining Regional Governance in Latin America. Washington, DC: Carnegie Endowment for International Peace. 30 La Republica Staff. (2022). “Embassy of China: Trade volume between the two countries exceeded US$ 37,000 million in 2021.” La Republica, June 17, 2022.
31 Ramírez, S. (2013). “Regionalism: The Pacific Alliance.” Americas Quarterly, April 22, 2013.
32 Arbeláez, M. A., Higuera, S., Steiner, R., & Zuluaga, S. (2018). “Protecting “Sensitive” Agricultural Products in Colombia: A Political Economy Approach.” Coyuntura Económica XLVIII (1,2): 153–205.
33 Coqui, B. M. (2021). “Why Mexico’s Relationship with China Is So Complicated.” Americas Quarterly, September 28, 2021.
34 Council on Foreign Relations. (2022). “What is
ASEAN?” Backgrounder, Council on Foreign Relations, Washington, DC.
35 International Monetary Fund. (2022). “Regional Economic Outlook: Asia and Pacific.” Database, International Monetary Fund, Washington, DC.
36 African Development Bank. (n.d.). Asia 2050 Realizing the Asian Century Executive Summary. Manila: African Development Bank.
37 Listiyorini, E., and Raghu, A. (2022). “Food Protectionism Grows as Indonesia Curbs Palm Oil Exports.” Bloomberg News, March 9, 2022.
38 Peruvian Ministry of Foreign Trade & Tourism. (2014). “Ministerial Resolution No. 146-2014.” MINCETUR, Lima, Peru.
39 Where d is the importing country, s is the exporting country, w is the set of all countries in the world, i is the set of industries, x is the commodity export flow, X is the total export flow, m is the commodity import flow, and M the total import flow.
40 Alfaro, L., Kalemli-Ozcan, S., and Sayek, S. (2009). “FDI, Productivity, and Financial Development.” The World Economy 32 (1): 111–35.
41 Rodrik, D. (2018). “What Do Trade Agreements Really Do?” Journal of Economic Perspectives 32 (2): 73–90.
42 Tobias, B. (2022). “Bangladesh Fire: Nearly 50 Killed, Hundreds Injured in Depot Blast.” BBC News, June 5, 2022.
43 International Labour Organization. (2022a). “NORMLEX: Information System on International Labour Standards.” Database, International Labour Organization, Geneva, Switzerland.
44 Engen, L. (2017). “Labour Provisions in Asia-Pacific Free Trade Agreements.” Background Paper No.1, United Nations Economic and Social Commission for Asia and the Pacific, Bangkok, Thailand.
45 United Nations Conference on Trade and Development. (2015). “Foreign Direct Investment: An Important Source of External Development Financing for The Poorest Economies.” News, United Nations Conference on Trade and Development, Geneva, Switzerland.
46 United Nations Conference on Trade and Development. (2022). World Investment Report 2022. Geneva, Switzerland: United Nations Conference on Trade and Development.
47 Yeyati, E.L., Stein, E.H., and Daude, C. (2003). “Regional Integration and the Location of FDI.” Working Paper, No. 492, Inter-American Development Bank, Research Department, Washington, DC.
48 Medvedev, D. (2012). “Beyond Trade: The Impact of Preferential Trade Agreements on FDI Inflows.” World Development 40 (1): 49–61.
49 Bae, C., and Jang, Y.J. (2013). “The Impact of Free Trade Agreements on Foreign Direct Investment: The Case of Korea.” Journal of East Asian Economic Integration 17 (4): 417–45.
50 Duong, M., Holmes, M.J., and Strutt, A. (2021). “The Impact of Free Trade Agreements on FDI Inflows: The Case of
Vietnam.” Journal of the Asia Pacific Economy 26 (3): 483–505.
51 Mildebrath, H. (2020). “The CJEU Judgment in the Schrems II Case.” European Parliamentary Research Service, Brussels, Belgium.
52 Trachtenberg, D.M., and Archick, K. (2022). “U.S.EU Trans-Atlantic Data Privacy Framework.” CRS Report, Congressional Research Service, Washington, DC.
53 The White House. (2022). “Fact Sheet: President Biden Signs Executive Order to Implement the European Union-U.S. Data Privacy Framework.” The White House Briefing Room, October 7, 2022.
54 Anderson, J. E. (1979). “A Theoretical Foundation for the Gravity Equation.” The American Economic Review 69 (1): 106–16.
55 Yotov, Y.V., Piermartini, R., and Larch, M. (2016). An Advanced Guide to Trade Policy Analysis: The Structural Gravity Model. Washington, DC: World Trade Organization iLibrary.
56 Borchert, I., Larch, M., Shikher, S., and Yotov, Y. (2022). “The International Trade and Production Database for Estimation - Release 2 (ITPD-E-R02),” USITC Working Paper 2022–07–A, U.S. International Trade Commission, Washington, D.C.
57 Novy, D. (2013). “Gravity Redux: Measuring International Trade Costs with Panel Data.” Economic Inquiry 51 (1): 101–21.
58 United Nations Economic and Social Commission for Asia and the Pacific. (2022). “UNESCAP-World Bank Trade Cost Database.” Database, United Nations Economic and Social Commission for Asia and the Pacific, Bangkok, Thailand.
59 For more details on the GTAP 10 Database, see Aguiar, et al. (2019).
60 Documentation on the Standard GTAP model can be found in Corong, et al. (2017).
61 A detailed discussion on the use of Computable General Equilibrium models for trade analysis can be found in Burfisher (2017).
62 Peruvian National Institute of Statistics and Informatics (INEI). (2021). “National Household Survey (ENAHO) 2019.” Database, National Institute of Statistics and Informatics (INEI), Lima, Peru.
63 Goutam, P., Gutierrez, I.A., Kumar, K/B/, and Nataraj, S. (2017). “Does Informal Employment Respond to Growth Opportunities? Trade-Based Evidence from Bangladesh.” RAND Corporation Working Paper 1198, RAND Corporation, Santa Monica, CA.
64 References to “manufacturing” in-text as it relates to our employment projections are the summation of a number of categories from Annex 3. They include the following: “Chemical Manufacturing”, “Gas Manufacture, Distribution”, “Other Manufacturing”, “Rubber and Plastics”, “Textiles”, “Machinery Manufacturing”, and “Motor Vehicles”.
65 International Labour Organization. (2022b).
Employment, Wages and Productivity Trends in The Asian Garment Sector: Data and Policy Insights for The Future Of
Work. Bangkok, Thailand: ILO Printing Press.
66 Corong, E., Hertel, T., McDougall, R., Tsigas, M., and Van der Mensbrugghe, D. (2017). “The Standard Gtap Model, Version 7.” Journal of Global Economic Analysis 2 (1): 1–119.
67 Intersoft Consulting. (n.d.) “General Data Protection Regulation (GDPR).” Intersoft Consulting.
68 European Commission. (n.d.) “Adequacy Decisions: How the EU Determines If a Non-EU Country Has an Adequate Level of Data Protection.” European Commission, Brussels, Belgium.
69 McKenzie, B. (n.d.) “Binding Corporate Rules.” Baker McKenzie.
70 Trachtenberg and Archick, (2022).
71 Cross Border Privacy Rules System. (2022). “About CBPRS”, Cross Border Privacy Rules System
72 U.S. Chamber of Commerce, and Hunton & Williams LLP. (2014). Business Without Borders: The Importance of Cross-Border Data Transfers to Global Prosperity. Washington, DC: U.S. Chamber of Commerce, and Hunton & Williams LLP.
73 ASEAN Secretariat. (2020). “ASEAN Member States.” Association of Southeast Asian Nations.
74 Securiti. (n.d.) “What You Need to Know About Peru’s Data Protection Law.” Securiti
75 Rodriguez, K., and Alimonti, V. (2020). “The State of Communication Privacy Law in Peru.” Electronic Frontier Foundation (EFF).
76 National Board of Trade Sweden. (2014). No Transfer, No Trade: The Importance of Cross-Border Data Transfers for Companies Based in Sweden. Stockholm, Sweden: National Board of Trade Sweden.