31 minute read
FRAMING THE PROBLEM


Calling this crisis may feel alarmist to some. Others may believe we are facing another housing bubble, like the one that led to the Great Recession. Personal failure might be assigned by some others to find fault with a person who is struggling to find housing they can afford. The reality is that housing in Michigan and across the United States has reached a critical stage. We are, indeed, in a dire situation.
New Private Housing Units Authorized by Building Permits in Michigan
Federal Reserve Bank of St. Louis
THE HOUSING CRISIS
We simply have not built enough housing to meet demand. Despite a steady increase in the number of housing units built since the Great Recession in Michigan, construction numbers have not reached pre-recession levels. Economists suggest that somewhere between 25,000 and 30,000 new singlefamily homes should be constructed each year to keep up with normal life cycles of aged housing, changing demographics, and population shifts. Yet, an average of only 16,000 homes have been constructed annually since 2016.1 The chart above illustrates that even during prior recessions (gray bars) housing production continued in Michigan until a precipitous decline in 2006. A study conducted on behalf of the National Association of Realtors (NAR) found that when compared to construction levels between 1968 and 2000, the U.S. housing market failed to build 5.5 million housing units over the last 20 years. Accounting for the loss of existing units due to natural disasters, demolition, and functional obsolescence, that number grows to 6.8 million units.2 Home construction in Michigan reflects this national trend of underproduction.
To make matters worse, Michigan's population was the second slowest growing in the nation between 2010-2020, at only 2%,3 but the number of households grew at twice this rate and is expected to increase another 3.7% by 2030.4 The
Housing Price Index and Real Median Housing Income in Michigan

Federal Reserve Bank of St. Louis, Housing Price Index for Michigan (blue) and Real Median Household Income in Michigan, Adjusted (red)
number of households has been increasing faster than total population because the number of people living in a housing unit is declining. For example, a family home now has fewer people in it when children move out to create their own household, or roommates decide to live separately when they can afford to do so. A Michigan State Housing Development Authority report in 2019 projected that Michigan will face a deficit of more than 150,000 housing units by 2045 if current trends continue.5 The lack of housing supply has driven the cost of housing increasingly higher due to rising demand.
The chart above shows the rising housing price index for Michigan over time and the adjusted median household income. Demand continues to rise and incomes have not kept pace, which only exacerbates the problem of maintaining levels of affordability. For example, the National Low Income Housing Coalition estimates the current need for nearly 205,000 rental units for extremely low-income households in Michigan, which comprise 28% of Michigan’s renter households.6
INFLUENCING FACTORS
This perfect storm led us to a red-hot “seller’s market” before interest rates began to climb, where would-be residents competed for scarce supply. If a community has 100 households all looking to buy or rent at the same time, but only five units are available, the price of housing will increase.7 There is greater demand for housing than available supply in many places in Michigan. Yet, there has not been an overwhelming increase in construction activity to meet demand. The combination of the Four Ls, or Labor, Lumber, Land, and Laws all play a role in the current housing crisis.
Labor. From the foundation to the roof, new buildings require many specialized crafts, including plumbers, electricians, framers, drywallers, painters, and more. There is a shortage of skilled tradespeople who can do the necessary work of building and housing rehabilitation. The current labor shortage in the construction industry and related trades can be traced back to the Great Recession. When the housing bubble burst, demand for new homes plummeted. As work dried up, laborers in construction and other trades left the field.8 A report by the Home Builders
Supply & Affordability Crisis
Labor Lumber
Skills Wages Cost of materials & Infrastructure Supply Chain Disruptions
Market Constraints Environmental Conditions
5th & 14th Amendments
Land Laws
Zoning, Codes, & Regulations
Association of Michigan in 2017 reported that between 2000 and 2009, Michigan lost 43% of its workforce in residential construction.9 Many of these workers have not been replaced.
Lumber. The cost of construction materials and their availability has not only made housing more expensive to develop, but also extended project timelines. Building materials prices have risen 33% since the start of the pandemic in February 2020. The price index of services used in home building (including trade services, transportation, and warehousing) have increased 15.2% since the start of 2022, and 39% since the start of the pandemic.10 Infrastructure can also significantly influence housing supply and affordability. A parcel that is not served by sewer, for example, must be large enough (typically at least ¾ of an acre) to accommodate an on-site septic system. However, where sewer and water are available, land can be divided into smaller parcels. Instead of a ¾ of an acre parcel supporting just one home, it could support a dozen townhomes. If that parcel were valued at $75,000, the cost of land could be fully allocated to the one unit with the septic system or divided to be as little as $6,250 for each townhome unit on sewer.

According to the Producer Price Index (PPI) report released by the Bureau of Labor Statistics in March 2022, building materials prices increased 20.4% year over year and have risen 33% since the start of the pandemic.
Land. The availability of land for development can heavily impact housing prices. Commonplace scenarios include an unwilling landowner who stalls the aggregation of property that would make a more cost-effective development site; a desirable property located near a regional center with community amenities being priced at an unreasonable premium; or a site that is encumbered with easements or deed restrictions. Suitable soils can also be an important contributing factor to land availability. Where large portions of a region are impacted by wetlands, river estuaries, or a high-water table, opportunities for new housing can be limited. In high-demand areas, if much of the land area is not buildable, or if the available land is overregulated, this will result in higher prices for the limited land that is buildable.
Laws. The 5th and 14th Amendments of the Constitution ensure individuals the right to “life, liberty, or property,” due process, and the protection of property rights. These amendments and corresponding case law drive the limits of governmental intervention to resolve matters of housing supply. Local laws, however, often directly influence which types of homes (single-family, duplex, townhome, apartments, etc.) and lots are legal to construct and, thus how much the land and house are likely to cost.
Local zoning provisions which set minimum standards for home or unit size, lot size, lot width, or lot frontage will play an important role in determining how many units and lots can be created and what a new homeowner or renter will have to pay. These are typical dimensional requirements. Most ordinances also dictate the housing type that can be constructed in each zone district, thereby pre-determining a community’s housing inventory and selecting the types of housing units a prospective resident can choose from.
Development approval processes can also add substantial time and cost to a proposed project without the guarantee of success. The National Home Builders Association, in a letter addressed to President Biden in April 2022, called for the reduction of “burdensome regulations that account for nearly 25% of the price of building a singlefamily home and more than 30% of the cost of a typical multifamily development.”11 This assertion is supported by a number of welldocumented studies. Delays in approval processes due to neighbor opposition can increase land prices by 12%.12 This, then, creates an incentive for developers to build affordable housing where it is most politically expedient: in existing low-income neighborhoods where a concentration already exists.13 The practice creates a lack of opportunity for low-income individuals to access places that may have better schools, shorter commutes, and needed services.
In addition to zoning, there are other factors that play a role in project feasibility, including the building code, historic preservation review, and private lending criteria.
ZONING, CODES, & REGULATIONS
Zoning Ordinance
Developmental Approval Processes
Dimensional Requirements Housing Types Time Money
Studies and Fees (Public) Lending (Private) Building Code
New or Rehab Requirements Material Types Historic Preservation
Demolition
Building code. Most Michigan communities use the International Building Code (IBC), a state-wide code that has a lengthy amendment process. The IBC places nearly all housing types other than singlefamily into the more expensive commercial construction category; making it difficult for residential homebuilders to comply.
Historic preservation can be important for placemaking and community culture; however, it can also be a method to prevent change. Local historic districts are usually created through grass-roots advocacy, and local commissions have latitude when considering redevelopment proposals. An historic review can mean additional process, including time and fees. Private lending can require site and building improvements that may not be desired by the community or the developer; such as additional parking spaces, in-unit laundry facilities, or walls that separate a new development in a revitalizing neighborhood from its surroundings. Unless the developer and community comply with lender demands, a project may not materialize.
Considerations addressed in this Toolkit are not exhaustive. Key zoning provisions and related development approval processes are the greatest opportunities local units of government can have a significant impact on influencing housing supply and affordability.

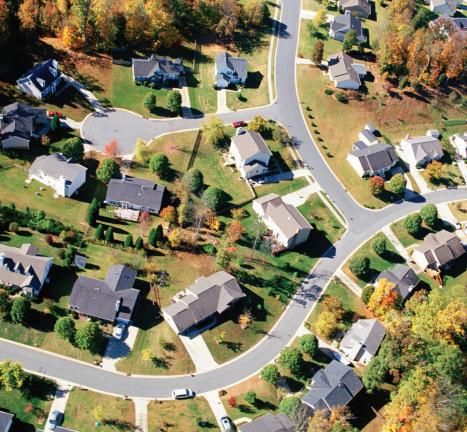
Google Earth
ECONOMICS OF HOUSING
The influencing factors of Labor, Lumber, Land, and Laws have placed unprecedented pressure on a commodity that is also considered a basic human need.14 These factors, of course, are interrelated. Because of labor and materials shortages, the construction cost per square foot for a residential unit has escalated from an average of $150/sq. ft. in 2015 to nearly $250/sq. ft. in many areas of Michigan in 2022. As a result, the very same 1,000 sq. ft. home that would have cost $150,000 to build in 2015 is now costing $250,000 or more. Consider:
• If that 1,000 sq ft home costs $250,000 to build, the cost of the land for that home can play a critical role in influencing whether or not that home is attainable to a family in the region. If the minimum lot size is an acre, and the cost of a 1-acre lot is $75,000 or more, the price of the home plus land is likely to exceed $325,000. Many households will be instantly priced out. However, where the land can be subdivided to create additional buildable lots, the cost of land will be less and the home attainable to more people.
• If the local building community needs to build 100 homes each year, and the local regulatory code requires all new homes to be constructed on large lots with expensive infrastructure, it is very likely that builders will choose to use their limited labor supply to build the most expensive homes first. Those homes will likely be the most profitable because expensive homes can more readily absorb the higher costs of labor, land, and materials. Alternatively, where a builder or developer is able to construct many homes at once, there will be efficiencies in materials, labor, and land costs. These efficiencies can help to justify lower price points for new homes.
• If it takes two years to obtain Planned
Unit Development (PUD) approval from the planning commission and elected body for a housing project request, it may be another year (depending on Labor and Lumber) before housing units are available for sale or lease. If prices continue to increase, estimates at the beginning of the approval process may no longer be accurate, even with contingencies. Two of the three years in this PUD example could be eliminated with a streamlined approval process.
Solving housing needs and need categories across all price points requires changing a “one-size-fits-all” approach. The amount of land required to support a housing unit is not a fixed number. Neither is the number of square feet needed to support a household. The amount of land and built space required for a home is highly variable and dependent upon the number of people in a household, the household’s income, the local regulatory requirements, the availability of public transportation or other viable mobility choices, and more. There is no one magical solution, and therefore it is imperative that local units of government plan and zone for a variety of housing types and price points across their communities. This is, of course, easier said than done.

PROPERTY VALUES
Historically, achieving the American Dream has equated to homeownership. Entire systems have been created to support this idea, and homeownership has become a primary way to build wealth. There is a preponderance of federal and state measures targeted at homeowners, but few programs available for renters.
The largest economic housing subsidy provided by the federal government comes in the form of the mortgage interest deduction on federal taxes. In a recent study, researchers found that the federal government provided over $400 billion in tax subsidies for homeownership between 2017 and 2021. Comparatively, the next largest housing program, the Low Income Housing Tax Credit, which primarily benefits renters, received $72 billion in federal funding over those same five years.15 In Michigan, the Headlee Amendment, Proposal A, and the Principal Residence Exemption have created a distortion in the residential housing market: it makes more sense for people to stay in their homes longer rather than right-size into a smaller home because a move will bring higher taxes. State policy has created a system that makes housing more expensive for renters as they cannot reap the financial savings that the tax benefits provide.16 As rents continue to rise, homeownership becomes a distant possibility for more people who must spend a greater proportion of their income on housing.17
Homeowner bias found in tax policy is also evident throughout local policy-making. William Fischel, an economist, holds that “homeowners are the dominant faction in local government politics. Owneroccupied homes provide both consumer
In 1978, Michigan voters approved an amendment to the Michigan Constitution known as the Headlee Amendment. Property taxes were indexed to the rate of inflation, so that if the assessed value of a local tax unit’s total taxable property increases by more than the inflation rate, the maximum property tax millage must be reduced such that taxes yield the same gross revenue. Homeowners benefit because even if the value of the home rises 15-20% per year (as it has done over the last several years), property tax increases are limited.
The Michigan Education Finance Amendment, referred to as Proposition A and passed in 1994, further limits the increase in taxable value of a property to 5% or the rate of inflation, whichever is less. Only when a property is sold or transferred does the taxable value reset to the State Equalized Value (SEV) and annual taxable values are then capped again. In addition, the Principal Residence Exemption (PRE) provides any homeowner of a principal residence a discount from a portion of local school operating taxes.
In communities where property values have been skyrocketing, the only way to increase tax millage rates that were rolled back during the Great Recession is by a vote of the people. These values cannot be reset to a level where the current value is fully captured because of the caps set by State law. It is worth noting this is becoming the next fiscal challenge for local units who cannot capture the new value created by escalating home prices and must actually lower (“roll back”) their millage rates to be in compliance with the Headlee Amendment because property growth has exceeded inflation. The City of Traverse City, for example, could potentially lose an estimated $4.5 million over the next five years by 2027, according to the City Treasurer.

services (housing) and an undiversified, durable investment (house and land) that is sensitive to what local governments do. As a result, homeowners monitor local government activities and discipline local officials whose actions jeopardize home values.”18 Neighbors are often motivated by a desire to defend their investment and to guard against any type of activity they believe may adversely affect the value of their home. Unfortunately, this has had real impacts on the number of new housing units brought to market.
Recent studies have begun to show that perception is not the same as reality when it comes to the effect of new development on home values. In fact, there is no discernable difference in the rate of appreciation between homes located near higher-density development and those that are not, nor does it create more congestion or crime.19 At the University of Utah Kem C. Gardner Policy Institute, researchers found that overall home values and values per square foot were higher near multi-family development rather than the opposite.20The study found:
• Homes located in Salt Lake County located within a half-mile of a newly constructed apartment building rose by 10% in median value per year between 2010 and 2019. Those farther away rose by 8.6%. • Homes closer to multifamily housing also had an 8.8% higher median value per square foot than those beyond a half-mile away, even though the houses tended to be slightly smaller in size, about seven years older on average, and had smaller lots.21
Properly designed and maintained housing – of any type – in an appropriate context is what matters. For example, The George Washington University School of Business conducted a study of 761 regionally significant, Walkable Urban Places (WalkUps) in the 30 largest metropolitan areas in the United States.22 The group then went on to analyze seven Michigan metropolitan areas in The WalkUP Wake-Up Call: Michigan Metros report to see if the same market-based findings applied. The researchers found:
• Michigan residents have few choices about where to live. Only 8% of the total housing stock is located in walkable urban places, and only 4% of the housing stock built since 1960 is considered to be in places that are walkable. • National polls suggest that 40% of residents would like to live in an
Walkable Urban Place or a Walkable
Neighborhood. • There is pent-up demand across all of
Michigan's metros. For-sale residential homes sell for 56% more per square feet in a WalkUp than in an Edge City.
Multifamily apartments have lease rates that are 28% higher than in drivable suburbs.23 • For-sale housing sells for 56% more per square foot when located in premium walkable urban places, and multi-family rental premiums were 46% higher than in drivable suburban communities. • Walkable urban places performed substantially higher than low-density development patterns in terms of tax base and ability to pay for infrastructure. • The authors cautioned that as pent-up market demand increases, as it has, then affordability will be a challenge.24
Both the University of Utah and George Washington studies identified an unmet demand for affordable, compact, pedestrian-

oriented and transit-accessible housing - housing types that are illegal to build in many places. To have a more sustainable tax base, better health outcomes, and lower transportation costs (which affect affordability), these studies recommend building more diverse housing types in a walkable form, helping to connect residents to jobs, opportunities, and the goods and services that meet their daily needs.25 In other words, the form of development can produce more equitable outcomes for a community’s population.
Paradoxically, many residents want vibrant villages with places to eat and shop, lowcost infrastructure, protected natural resources, and large lot low-density detached single-family housing... all at the same time. Yet, these desires are at odds with one another. Detached single-family units, particularly on large lots, is not an efficient development pattern. It promotes driving over walking, and the monoculture of use does not allow for the vibrancy of a mixed-use environment.
Residential development comprises the largest area of a community, and the way it is configured has a substantial impact on everything else. If we are to diversify Michigan’s housing stock to adequately serve the people who live here, whether it is in a community that is quickly growing, or experiencing vacancies, new housing of varying types is needed. Even in communities with declining populations, housing stock should still be improved or replaced. Aging housing stock creates economic burdens in the form of increased maintenance and inefficiencies in energy; both of which can contribute substantially to the overall cost of housing, particularly for low-income individuals.
HOUSEHOLDS, HOUSING STOCK, AND FINDING THE MISSING MIDDLE
What does a typical American household look like? If you envisioned a married couple with two kids, a dog, in a home with a white picket fence, you might be in for a surprise. The American household today looks very different than when Leave It To Beaver was on television. From household size and makeup to housing preferences, families and communities have been changing.
More people are living alone. People living alone are now the most common type of household. Nationally and in Michigan, people living alone account for approximately 30% of all households.26 Single-person households accounted for only 13% of all U.S. households in 1960.27
George Washington University School of Business study recommendations directly align with placemaking initiatives supported by the Michigan Municipal League (MML) and Michigan State University's Land Policy Institute (MSULPI), and resemble cornerstone housing and economic development policies in the State of Michigan, spanning mutli-party gubernatorial terms within the offices of the Michigan State Housing Development Authority (MSHDA) and the Michitgan Economic Devellopment Corporation (MEDC).

Households are getting older. In 1960, 18% of U.S. householders were 65 years or older; in 2020, 27% of householders were over 65 – that’s more than 1 in 4 households.28 In Michigan, the percentage of households with at least one person aged 65 years or older is approximately 30% or almost 1 in 3 households.29
Multi-generational households are
increasing. There has been an increase in the number of adult children living with their parents, as well as other types of multi-generational households. Between 2000 and 2017, the share of young adults (ages 25-34) living with their parents almost doubled, from 12% to 22%.30 At the same time, the number of Americans living in multigenerational households has increased to almost 20% of the population, up from the lowest share in 1980 at 12%.31
Households are getting smaller.
The second biggest household type is couples living together with no children, which comprise one-quarter (25%) of all households. The average household size in 1960 was 3.29 people. Gradual declines in household size occurred in each subsequent decade. The average household size in the U.S. was 2.51 people in 2020.32 Michigan’s household average is smaller, with 2.45 people per household. Nuclear families, defined as two adults living with children under 21, now represent just one of every five (20%) households.33
Walkable neighborhoods are preferred
by the largest generations.34 Millennials and Baby Boomers desire to live in walkable neighborhoods and not necessarily in downtowns. Walkable suburban neighborhoods have become more popular, especially for Gen Zers and Millennials.
Figure HH-6 Changes in household size
Average number of people per household
4.0
Family households
All households 3.5
3.0
2.5
2.0
1.5
1.0
1940 1947 1960 1970 1980 1990 2000 2010 2021
Source: U.S. Census Bureau, Current Population Survey, Annual Social and Economic Supplements, 1940 and 1947 to 2021.
Baby Boomers would like to age in place.
A report by the AARP, Making Room for a Changing America (2019), found that 77% of people aged 50 or older said they wanted to stay in their current community for as long as possible and 76% want to stay in their current residence as long as possible. Of people aged 65 or older, 86% want to remain in their current community and

home.35 36
We don’t have the housing stock for an
aging population. Approximately 45 million people are age 65 or older today. By 2030, that number will reach 73 million – or 1 in every 5 Americans. Of these, 20% are anticipated to have some sort of physical disability. In an AARP poll, one-third of those polled said they would need to modify their current residence so they could live there if they had physical limitations. Only 54% of homes have a step-free entryway, according to the American Housing Survey.37
38

Homes have been getting bigger. The median size of a single family home completed in 2020 was 2,261 sq. ft.39 Comparatively, the median square footage of a single family home in 1960 was 1,500 sq. ft.40 Minimum unit sizes, required either by zoning or homeowners associations, can price potential buyers out of a market, exacerbating high housing prices.
Zoning has made detached single-family
the only option in many communities. Of the 1,287,000 new housing units completed in the U.S. in 2020, 71% were single-family homes. This number aligns with what is permitted to be developed according to local zoning. A New York Times analysis of zoning across the country found that it is illegal on 75% of residentially zoned land to build anything other than a detached single-family home.41
There is a significant mismatch between our housing stock and household sizes.
Similar to nationwide numbers, nearly three-quarters (72%) of Michigan’s housing units are detached single-family homes. This housing type is typically thought of as family housing, but more householders live alone (30%) than have children under the age of 18 (28%). Housing unit sizes (as determined by number of rooms) don’t align with the reality of our current demographics. Two-thirds of Michigan’s housing stock has 3 or more bedrooms, while only 10% of all housing units are comprised of a studio or one bedroom unit.
Percentage Housing Units Percentage Number of Bedrooms by Type in Michigan | 2020 in Michigan Housing Units | 2020
Mobile home 1 bedroom 5% Studio 9% 1-unit, detached 1% 72% 5 or more bedrooms 4% 2 Bedrooms 4 bedrooms 25% 17%
Graphics on this page from ACS 2020 5-Year Estimates: DP02 | Selected Social Characteristics in the US 3 Bedrooms 44%
20 or more units 5%
5 to 19 units 8% 2 to 4 units 5% 1-unit, attached 5% Mobile home 5%
1-unit, detached 72%
Percentage Number of Bedrooms in Michigan Housing Units | 2020
Studio 1 bedroom 9% Households by Type in Michigan, 2020 1% Households by Type Percent 5 or more bedrooms 4%Household with no spouse/partner present 46% 4 bedrooms 17% Living Alone 30% Married-couple or cohabitating couple 54% Households with 1 or more <18 years 28% Households with 1 or more 65 years + 31%

Neighborhood amenities matter. In 2020, the National Association of Realtors (NAR) Community and Transportation Preferences Survey found that “One in 5 people living in a detached home would prefer to live in an attached home if it meant living in a walkable community with a shorter commute. Only 1 in 10 prefer the opposite trade-off.” The survey also found that people living in walkable communities are more satisfied with their quality of life.42 An AARP poll found that 62% of respondents would consider building an Accessory Dwelling Unit (ADU) on their property for a loved one who needed care, or a family member or friend that needed a home.43
Support to allow Missing Middle44
housing exists. Zillow surveyed 26 Metro Areas and found residents were more likely to support allowing accessory dwelling units (69% supported versus 23% opposed) and duplexes and triplexes (61% supported versus 31% opposed) in every single metro. Most respondents (68%) also said allowing small and medium apartment buildings would have a positive impact on the availability of more affordable housing options, but they split more evenly on apartment buildings in their own backyards: Across all the surveyed metros, 57% agreed they would support a multifamily residence like an apartment building being built in their neighborhood, while 37% disagreed. Renters expressed greater support than homeowners.
Support Allowing in Residential Neighborhoods:
ADU’s Duplexes / Triplexes
Total
Homeowner Renter Gen Z (ages 18 - 27) Millenial (ages 28 - 42) Generation X (ages 43 - 57) Baby Boomer and Silent Generation (ages 58+)
Source: Zillow Research 4/11/2022
69% 61%
66% 55% 76% 72% 78% 69% 79% 73% 71% 60% 54% 46%
Either ADU’s or Duplexes or Triplexes 77% 73% 84% 86% 86% 78% 64%
Given changing demographics and housing and neighborhood preferences, it is clear that existing housing stock does not meet current needs. While Labor, Lumber, and Land are less directly in our control, as local leaders, we can have an impact on Law. Zoning policy can and should be updated to reflect the housing needs of today and tomorrow.45
WHAT IS MISSING MIDDLE HOUSING?
Missing middle housing refers to housing types such as accessory dwelling units (ADUs), duplexes (two-family), triplexes (three-family), fourplexes/quadplexes (four-family), townhouses, and small apartment buildings. It is the range of housing types found between a detached single-family house and a large multifamily complex. These housing types are generally considered to be moderate density. In most communities, these housing types have been banned from zone districts that only allow detached single-family homes. Traditional patterns of development have these housing types woven into residential neighborhoods. Some refer to missing middle housing types as "gentle density" because they can work well in existing contexts and blend nicely with new construction.
See the Missing Middle Housing tool for more information.
ECONOMIC CONSEQUENCES

If Michigan communities are to be adaptable in a world where change is the only constant, then good stewardship is necessary. Towns reliant on a single employer, such as the mining or automotive industry, have seen their fates boom and bust in tandem with the volatility of the market for decades. Resilient communities have diversified their economies to better weather economic storms. We must do the same with our housing stock.
A lack of housing types and sizes that are aligned with today’s households is placing a financial burden on Michigan households. Unit size matters because rent and sales prices are typically determined on a per square foot basis. It is no surprise, then, that 48.5% of Michigan households spend 30% or more of their income on rent.46 Households are considered “cost burdened” at this threshold. HUD defines cost-burdened families as those “who pay more than 30 percent of their income for housing” and “may have difficulty affording necessities such as food, clothing, transportation, and medical care.” Twentythree percent of homeowners with a mortgage fell into this same category. As detailed earlier, Michigan tax law works to benefit homeowners, so this lower rate is to be expected.
A diverse housing stock in a range of price points at the right places can meet the needs of a wide array of households and assist in stabilizing a community’s tax base. When our housing supply is constrained and there are high housing prices it limits the movement of workers. The Home Builders Association of Michigan found that hospitality workers in some Northern Michigan towns face long commutes (averaging 45 minutes each way in one Northwest Michigan community) because they can’t find attainable housing near their jobs.47 Households then have even less room in their budget for other necessities due to the burden of transportation costs. Economic growth requires a new approach that provides more choices than are

currently available. Potential employees can’t relocate to where the jobs are because housing costs have outpaced local incomes. Communities reliant upon service workers have found that local businesses are unable to open or must have reduced hours because housing prices are beyond what employees can afford.
“We’ve missed out on (non-local) candidates because they can’t find a place to live, and we’ve had an employees move out of state because of the lack of affordable, workforce housing. We’re working to get some housing projects shovel ready, but that doesn’t help us out this season,” said Scott NewmanBale, the CEO of Short’s Brewing.48
A lack of housing has not only adversely affected northern Michigan. The National Association of Realtors study found that for every two new jobs created in the DetroitWarren-Dearborn and Grand RapidsWyoming metropolitan areas, only one new housing permit was issued between 20162019.49 Demand has resulted in median listing prices climbing nearly 20% from March 2021 to April 2022 in those markets.50 Throughout the United States, the cost of restrictive land use regulation is estimated to result in at least a 2% loss in overall gross domestic product (GDP).51 52 Ultimately, we are constraining the potential for businesses to grow, reducing the workforce’s upward mobility, and limiting access to new job opportunities. If we were to align labor with location, shorter commuting distances and/or multi-modal options, a variety of housing types, and housing availability at all price points, then it would be easier for workers, businesses, and local economies to thrive.
This housing crisis must be regarded as an issue that all levels of government need to work together to solve. Every local leader should be asking what role their community plays in the larger regional ecosystem. Employees and employers don't care about jurisdictional boundaries. The workforce simply needs to live within a reasonable commuting distance. Thinking another community will shoulder the entire burden of change is unrealistic and will not solve the need for more housing.
In addition, followers of Strong Towns’ Charles “Chuck” Marohn will be familiar with the legacy infrastructure costs that await us because of mandated low-density development patterns in suburban and exurban communities. Rules such as minimum lot sizes and maximum densities have created places that are, or will be, struggling to maintain their streets and pipes, schools and parks, and other community assets. There simply aren’t enough taxes generated by large lots and single-family homes over time to support the costly burden of infrastructure.
SOCIAL CONSEQUENCES
The reality is that during various phases of a person’s life they will have different housing needs. Young adults may be on their own before finding a partner. A married couple may decide to divorce and shared income must now be split into two households. A widower may no longer wish to stay in the home where their family lived. Whatever the context and changing circumstance of a household, many communities have adopted zoning that requires three-fourths of all housing to be the same. The lack of a variety of housing types and price points reduces housing options across all incomes, ages, and household sizes.
Exclusionary zoning methods have been designed to keep out different housing types, people of a lower socioeconomic status, and/or renters because homeowners fear their property values will be negatively affected (despite a lack of empirical evidence to support these fears). Empathy is discarded even though shelter is a basic human need - alongside air, water, food, and sleep.
Nearly a century ago, local zoning was introduced to improve living conditions for the working poor and keep away the noxious effects of industry. Today's codes frequently place less "desirable" housing types, such as apartment buildings, next to major thoroughfares or heavy commercial uses. The working poor have been relegated to the places that zoning was supposed to protect them from.
Past practices of redlining, racial discrimination, predatory lending, and steering away people from certain neighborhoods has created a significant wealth gap between white households and other racial/ethnic minorities. Blacks have a homeownership rate of 46.4% compared to 75.8% of whites. In 2016, white families posted the highest median family wealth at $171,000. Black families, in contrast, had a median family wealth of $17,600.53 Given that a home is one of the largest personal assets a person will hold, it is not surprising, then, that such a significant wealth gap exists. Communities with greater income segregation between neighborhoods typically have more restrictive development regulations. Limiting where the lowerincome families can live limits life opportunities in schooling, employment, health, and support services.54 The consequences of limiting housing choices can be particularly harmful to children, affecting their physical and mental health,
As was mentioned in the Introduction, there is a growing divide between people and places that is exacerbating poverty and seriously affecting health outcomes. This, in turn, is having a detrimental effect on our economy and peoples' lives. Creating places where some people, but not everyone, can fully participate as a member of a community impairs the ability for individuals and families to find success and comfort.
The consequences of our ambivalence to solve the housing problem include increased costs to provide social services, housing assistance, and medical insurance writeoffs, as well as lagging active participation in the workforce, and other externalities. If we are to have a strong and stable communities, then all residents need to be able to live in places that optimize their potential.
Richard Rothstein's book The Color of Law: A Forgotten History of How Our Government Segregated America clearly explains how public policy segregated America, and the cumulative effect of this policy on people of color. The Michigan Association of Planning's Equity Policy provides detail on MAP's position to advance equity. The American Planning Association’s Equity in Zoning Policy Guide (2022) is another excellent resource on what can be done to modify zoning to produce more equitable outcomes.