4 minute read
Pronto Xi Advanced Forecasting


Pronto Xi Advanced Forecasting optimises your inventory management by providing an accurate means of predicting future demand for your products.
You want your forecasting system to be understandable, flexible, simple to use, accurate, robust and integrated. Advanced Forecasting meets all of these requirements.
A number of different factors can be considered for your forecasts, such as entered sales orders, goods shipped and inventory transfers (usage). Using this data, trends and seasonal fluctuations are identified and tracked.
Appropriate smoothing factors are also applied based on a ‘best fit’ method of forecasting, with algorithms including triple exponential smoothing (Winter’s Method) and moving averaging. With triple exponential smoothing, past observations are given exponentially smaller weights as the observations get older. This method provides better forecasts when there are expected or known seasonal variations in the data.
Pronto Xi Advanced Forecasting offers:
• Graphical displays
• Exception handling
• Steady, seasonal demand, averaging and trends
Understandable
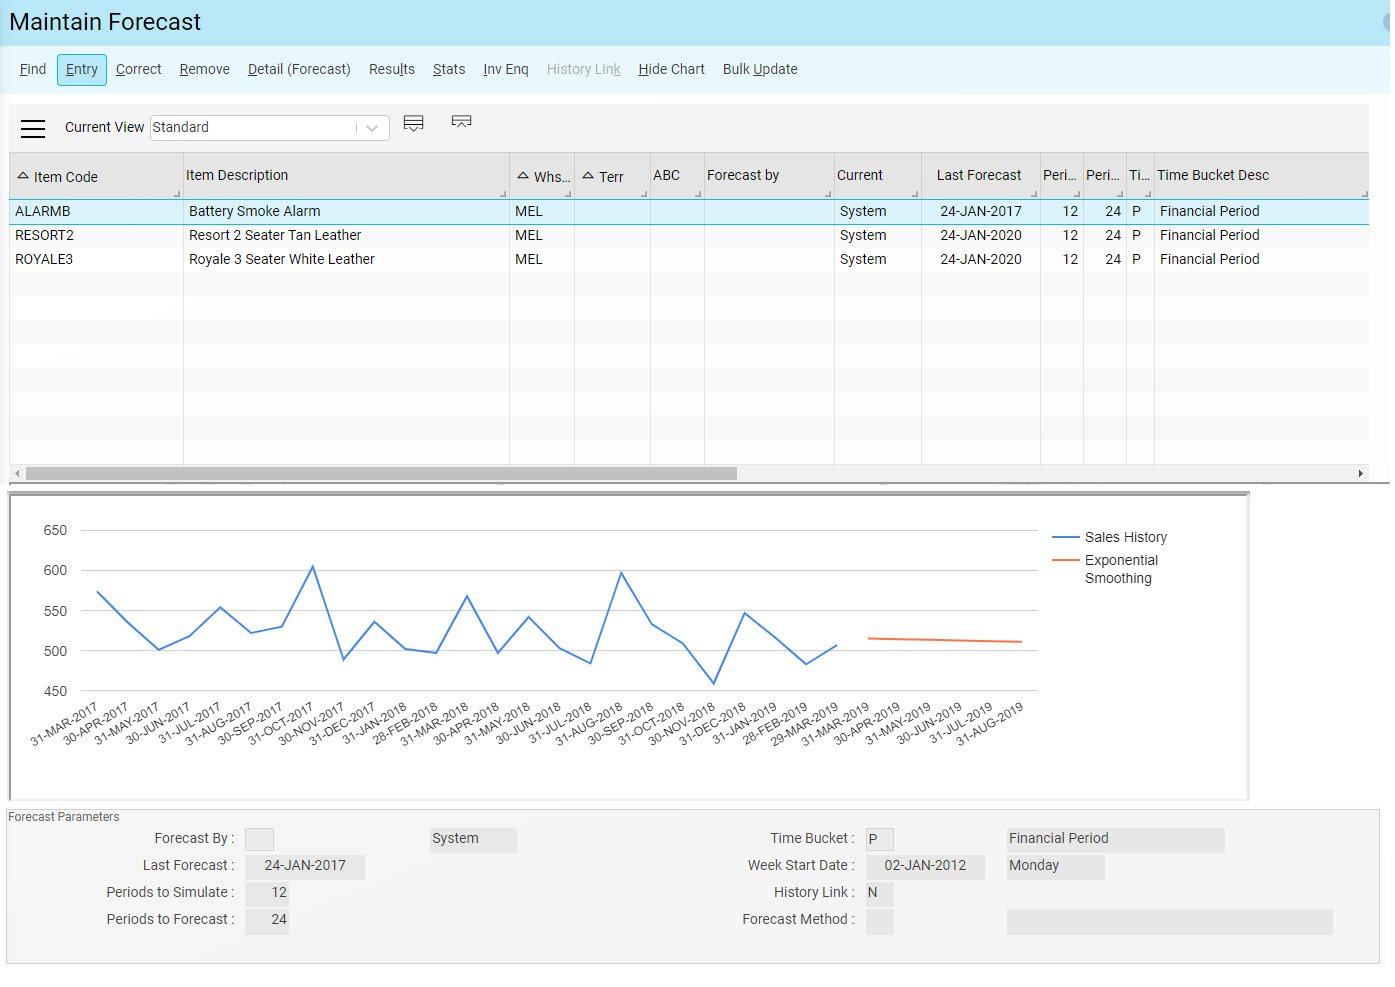
With advanced forecasting, both calculated and manual forecasts are displayed within a chart on the same screen so it is easy for you to see how suitable any forecast method is to the pattern of sales of any item.
Flexible
You can choose daily, weekly, fortnightly, period, and monthly forecast periods.
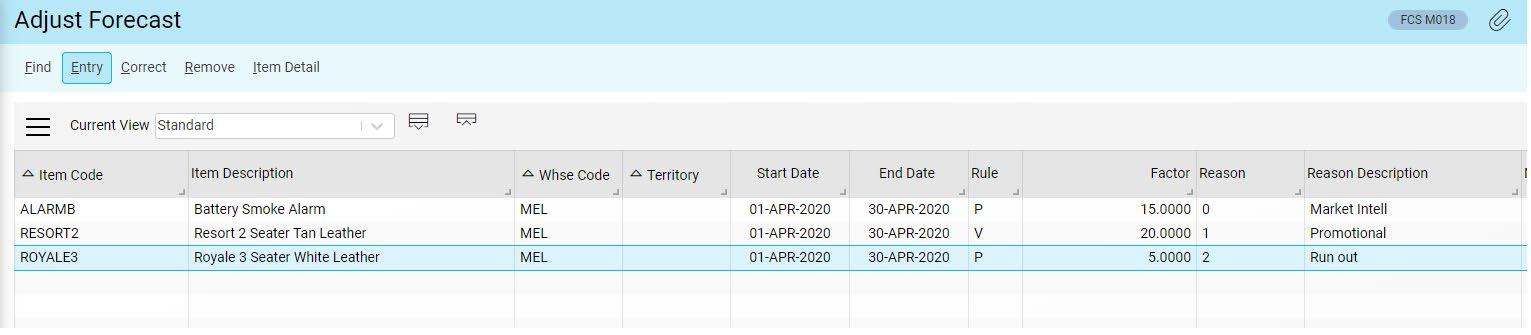
You can take known market events into account, to smooth out unusual events from the past and account for anticipated events in the future.
You can easily forecast a new item with no history by linking it to a similar item with history.
Predict your future sales
Supply Chain
Pronto Xi Advanced Forecasting
Forecast product sales to plan timely warehouse replenishment
Applications Overview Forecast product sales to plan timely warehouse replenishment

Make manual smoothing adjustments to the forecast to enable accurate prediction
Simple
Setup and processing are quite simple and can be automated.
Robust
All of this is backed up by established statistical methods for forecast generation and selection.
Integrated
The data you need to calculate your statistical forecasts comes straight from normal sales operations in Pronto Xi. Once the forecast is published the results are available to all the planning and reorder processes in Pronto Xi.
Additionally, BI Essentials contains a forecast model containing real time information that can be used for your reporting and strategic planning needs.
Create Forecast Master Generate Forecast Publish Forecast Purge Unwanted History
Creating a forecast using Pronto Xi Advanced Forecasting
Supply Chain
Pronto Xi Advanced Forecasting
Applications Overview
Staying on trend
A trend refers to any general change in sales over time. Pronto Xi Advanced Forecasting classifies trends in a number of ways, including:
• Steady demand indicates that the demand for the item is more or less constant over time
• Steady trend indicates that while demand may be increasing or decreasing, the rate of change of demand (the trend) is constant
• Seasonal demand indicates that, while demand may vary over time, demand is more or less constant for the same time period each year
• Seasonal demand with trend attempts to recognise a steady trend in sales superimposed over a seasonal demand
• Linear trend is the amount of increase (or decrease) that is the same over time
• Multiplicative trend is the percentage increase (or decrease) that is the same over time
Advanced Forecasting determines which of these trends is the best ‘fit’ for each inventory item by creating a forecast based on each trend and then comparing them with measured (actual) demand.
Measures of accuracy
Any forecasting system needs to be flexible enough to handle items that do not lend themselves to traditional forecasting techniques. Three statistical analysis techniques are used by Advanced Forecasting to determine the accuracy of the forecast:
• Mean Absolute Percentage Error (MAPE): The percentage by which the forecast differs from the actual sales achieved
• U-statistic: A comparison of the forecast with the ‘naïve’ forecast (which only uses historical data for the short-term horizon forecasting)
• Tracking signal: A comparison of errors in a forecast over time to determine if they are systematic or random
Four steps to better forecasts
The Advanced Forecasting algorithm incorporates actual data as it becomes available to refine the accuracy of its forecasts. There are four key steps:
• Modelling: Develop a model of the sales pattern for each item to be forecast, based on trends, seasonality and random fluctuation
• Forecasting: Using the model, new forecasts are generated
• Feedback: Actual data is added when available to refine the model
• Performance: The accuracy of the forecasts is assessed to further refine the model
Forecast product sales to plan timely warehouse replenishment

Choose a forecasting method to be applied from the various forecast algorithms
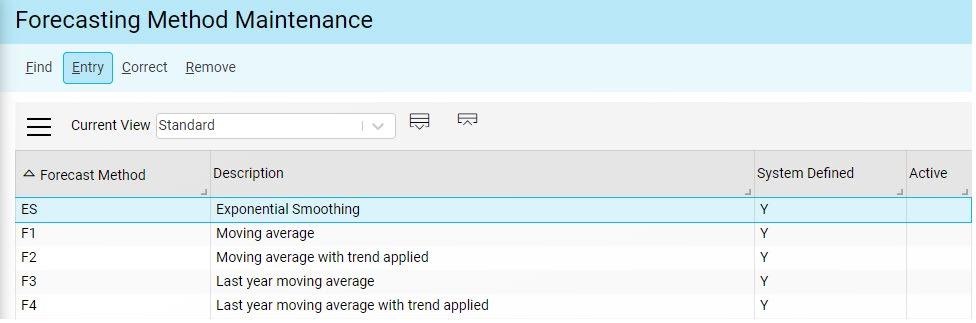
Supply Chain


