
C&I roadmap for heat pump ready sectors

RACE for Business
Research Theme BT2: Decarbonising businesses and supply chains
Industry Report
C&I roadmap for heat pump ready sectors
Citations
Leak, J, Vos, B, Snow, M. (2024).
Prepared for RACE for 2030
Project partners


Acknowledgements

Project team
A2EP
• Jarrod Leak
• Brendan Vos
• Michael Snow
Bridgeford Group
• Jordon Lim


The research team would like to thank the North Sydney Council for their input.
Acknowledgement of Country
The authors of this report would like to respectfully acknowledge the Traditional Owners of the ancestral lands throughout Australia and their connection to land, sea and community. We recognise their continuing connection to the land, waters and culture and pay our respects to them, their cultures and to their Elders past, present, and emerging.
What is RACE for 2030?
RACE for 2030 CRC is a 10-year co-operative research centre with AUD350 million of resources to fund research towards a reliable, affordable, and clean energy future. https://www.racefor2030.com.au
Disclaimer
The authors have used all due care and skill to ensure the material is accurate as at the date of this report. The authors do not accept any responsibility for any loss that may arise by anyone relying upon its contents.
Executive Summary
This roadmap provides a structured approach for decarbonising heating systems in commercial and industrial (C&I) sectors by transitioning from traditional boiler systems to electric heat pumps. The document outlines a simplified testing methodology that helps assess the readiness of a site for heat pump integration, especially in brownfield or retrofit environments where existing infrastructure may pose challenges. The roadmap is designed to offer guidance to stakeholders on two key objectives:
1. Lowering Heating Hot Water (HHW) Supply Temperatures: Reducing HHW temperatures enhances energy efficiency and broadens the range of heat pump technologies that can be applied. The roadmap encourages initiating testing regimes to explore this possibility and ensure the system's performance at lower temperatures.
2. System Capability Testing: The roadmap includes a step-by-step methodology to assess whether existing HHW systems can accommodate lower supply temperatures. This process includes baseline testing, field testing at reduced temperatures, and monitoring system responses such as flow rates and zone temperatures.
The sequence of testing begins with baseline measurements under normal conditions, followed by incremental reductions in HHW supply temperatures (e.g., from 80°C to 70°C and further). Each stage evaluates the heating system's capacity to maintain comfort levels within the building. This roadmap highlights potential efficiency upgrades, including adjustments to heating coils, air handling units (AHUs), and fan coil units (FCUs), which may be necessary if the system underperforms at lower temperatures.
This document also flags that, for more complex or high-risk sites, a more detailed testing regime may be necessary. Such testing is covered in the appendix, where methodologies for more granular data capture and system analysis are outlined. These details are crucial for ensuring that more sensitive sites, with contractual or operational heating requirements, can manage the transition to lower HHW temperatures without compromising performance.
By following this roadmap, stakeholders can gather actionable insights into their site's readiness for heat pump integration, which will inform future decarbonisation strategies, minimize retrofit complexities, and reduce overall system costs.
1 Introduction
1.1 Background
A cornerstone of global decarbonisation lies in minimising the combustion of fossil fuels for heating hot water (HHW) in heating, ventilation and air conditioning (HVAC) systems in buildings. This transition often entails adopting electric heat pumps or similar technologies, yet despite having significant improvements in system efficiency and utility costs, implementing these technologies may not always be immediately feasible due to potential costs and broader system implications. These implications could include the need for significant alterations to electrical infrastructure, structure/footprint constraints or downstream equipment like air handling units, distribution pipework, fan coil units, and heat exchangers.
A pragmatic initial approach could involve simply reducing the temperature output of heating equipment . This adjustment typically enhances efficiency and reduces energy consumption at the equipment level, potentially alleviating peak heating demand. Additionally, it broadens the design options by accommodating a wider range of heat pump products, particularly as the selection narrows with higher heating requirements. However, this change may also trigger downstream effects, including heightened pumping power demands. This means that engineers need to focus more on efficiency and overall energy productivity of the systems, designing HHW systems at lower supply temperatures rather than using the conventional 80°C/60°C supply/return HHW temperature.
1.2
Aim
Acknowledging the significance of reducing heating hot water (HHW) supply temperatures in preparation for electrification, given the potential efficiencies in energy consumption and costs, this report aims to offer guidelines for the following:
• Two testing regimes to consider for lowering HHW temperature
• Potential energy efficiency upgrades to assist
• Procedures to approach electrification of HHW
This document will provide the reader with high-level guidance on how one might approach the task of determining how ‘heat pump ready’ (readiness) a site might be in terms of the sites capacity to accommodate the required changes that are generally necessary / desirable in order to minimise the cost and complexity of any heat pump installation.
2 Electrification in a ‘Brownfield/retrofit’ environment
There are a number of challenges associated with ‘Brownfield/retrofit’ sites which are difficult to quantify due to a number of unknowns relating to how the system was designed originally. It is generally unknown for instance, what design assumptions were used when the initial system and components were specified. It is also often not clear if any of the baseline conditions that would drive the selection of these design assumptions have changed. For example, have floorplates changed, or have efficiency projects, such as double glazing of windows, been completed that would reduce/increase requirements.
As a result, it is often the case that when upgrades or refurbishments are contemplated for major equipment, ‘like-for-like’ systems are specified by designers based on the capacity and features of the existing system because it is known to work, and there is a risk associated with changing this without more data – which is generally not available.
Electrification of heating hot water is one of the most pertinent examples of this problem currently, which is exacerbated because the temperature characteristics between boilers and heat pumps are often mis-aligned –or very costly/complex to align. This is not because of any design related issue, but rather it is related to capability differences between these two technologies. But with a pragmatic testing regime, these challenges can be rationalised to enable an optimal heat pump specification based upon what your site actually requires.
The following premise is key to this approach;
- Many heating hot water systems are oversized and have at least some capability to operate effectively at a reduced capacity (lower flow temperature and temperature difference between water supply and return temperatures (temperature delta, dT)).
o This is predominantly due to conservative design estimates and sizing calculations, although may also be a result of organic uplift of the building and spaces that has occurred over time from other energy efficiency-based measures (example, draught sealing / air tightness) that will have the effect of reducing baseline heating requirements.
o Optimising a heat pump design capacity to what the building needs to operate reliably, which may be smaller than the current installed capacity, will ensure the most appropriate technical and commercial outcomes are achieved by any retrofit.
It is noted that the above premise will not be accurate in all cases and careful consideration should be given to your particular site as you proceed with the testing approaches detailed herein.
This document will provide a simplified testing approach to follow to determine if alterations can be made to the system parameters to better accommodate what can be provided by a heat pump. This is set out to ensure
that even sites with low levels of data collection and logging capability will be able to commence exploratory testing and it includes details regarding common risks associated with this testing that will need to be considered, and if necessary, controlled with suitable mitigations.
KeyTakeaways;
1 – Youcanelectrifythesiteatconventionaltemperatures,howevertheloweryoucanoperatethesiteHHW systemintermsofflowtemperature,andthesmallerthetemperaturedifferentialbetweentheflowand return(dT) – themore(andgenerallylowercost/complexity)designoptionsyouwillhaveavailableforyour heatpumptechnologyselection,and;
2 - Ifyoucanalsoreducepeakcapacityrequirementsunderelectrification,thetotalsystemcostsandcomplexity will reduce further.
2.1 Heating system fundamentals.
It is important to understand how heating in buildings is different to cooling for the most part. Fundamentally, ‘things’ (i.e., people, equipment etc) in a building generate heat when occupying that space.
- In cooling mode, you need to remove BOTH the heat gained from the ambient environment as well as the heat being generated internally to maintain stable temperatures.
Additionally, as the thermal gain from the external sources (sun, ambient etc) increases throughout the day, cooling loads also continue to increase.
- In heating mode, this internal heat load can assist with space heating as you only need to supplement the heat being lost from the building envelope / exhaust (etc).
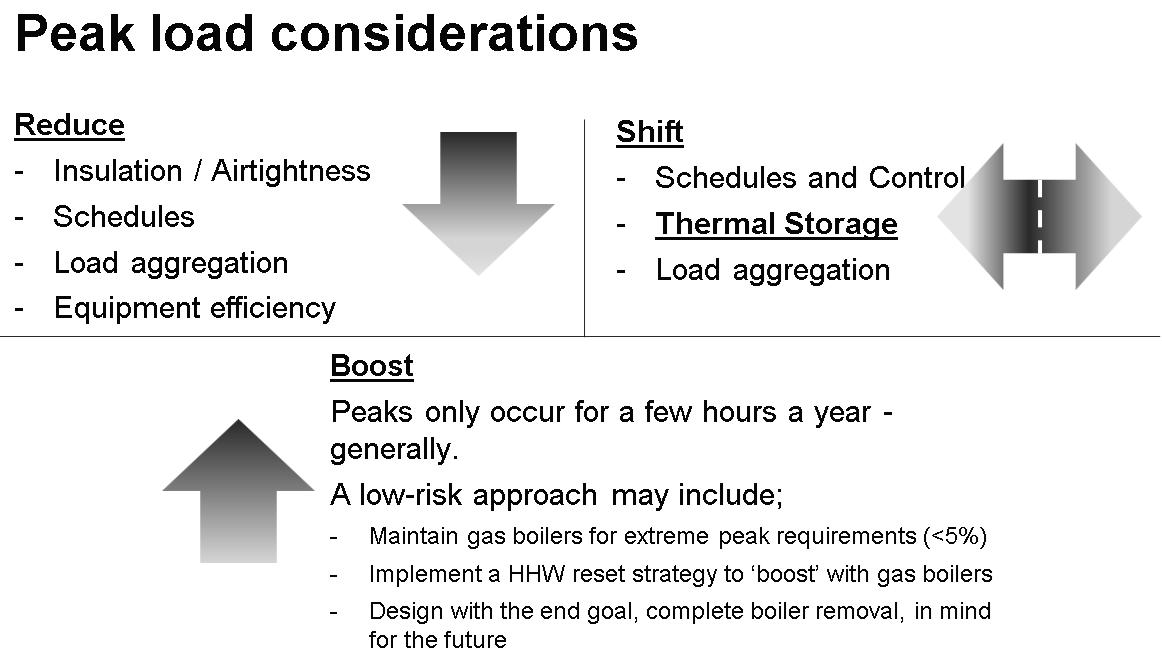
For a well-insulated building in a mild climate, like what is common in Australian capital cities, this typically means the peak heating requirement occurs for only a few hours in the morning (warm up) during colder months.
- For continuously operated facilities ( i.e., 24hr), generally stable and predictable loads occur as there is a reduced need to accommodate a fast warm up cycle each morning.
Buildings have historically been designed to cater for a fast warm up ( i.e., 1-2 hours) under these ‘peak design’ conditions.
- These peak conditions generally only occur for a few hours of the year, on the coldest days. Typically, there is significant excess capacity in the system for the remainder of the time. Further, extending warm up time frames will reduce the peak requirements
Due to the fundamental differences between boilers and heat pumps, electrification under these contemporary ‘peak design’ conditions is often prohibitively costly and complex, involving significant modifications to existing HHW and electrical infrastructure that are not always necessary to complete an effective electrification.
- A typical daily heating and cooling demand profile for a modern building (8am – 11pm operations) may look something like this:
HEATING

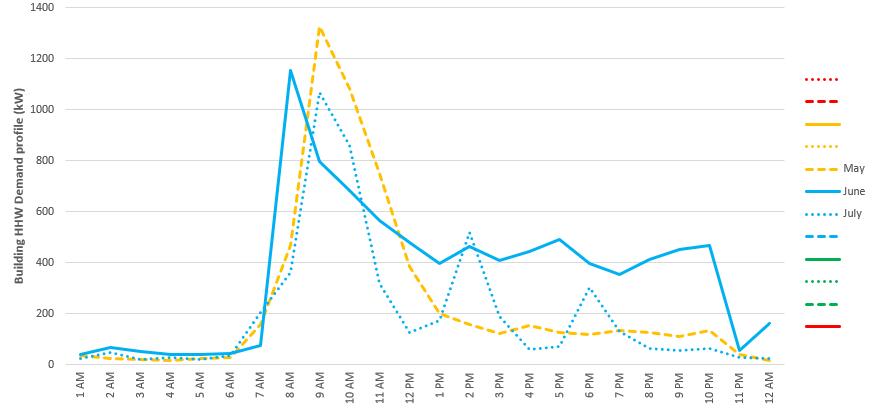
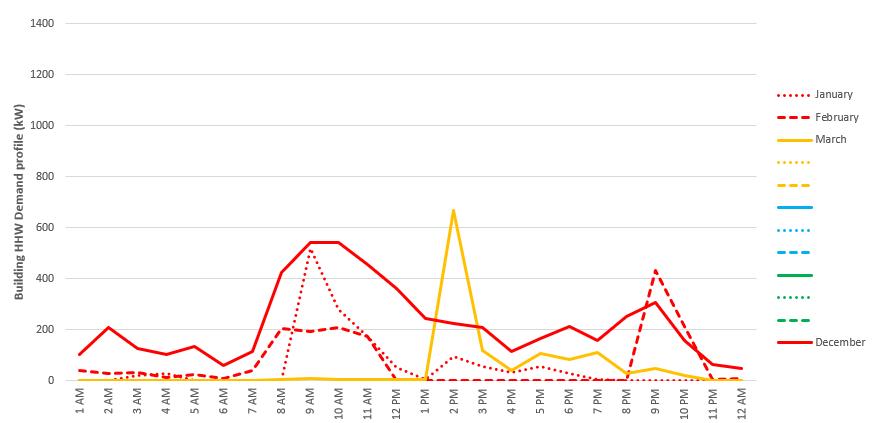
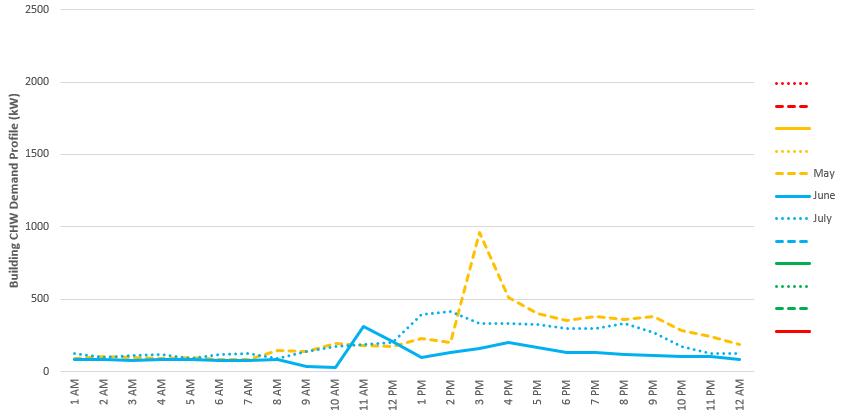
1 . Daily heating and cooling load profiles - example.
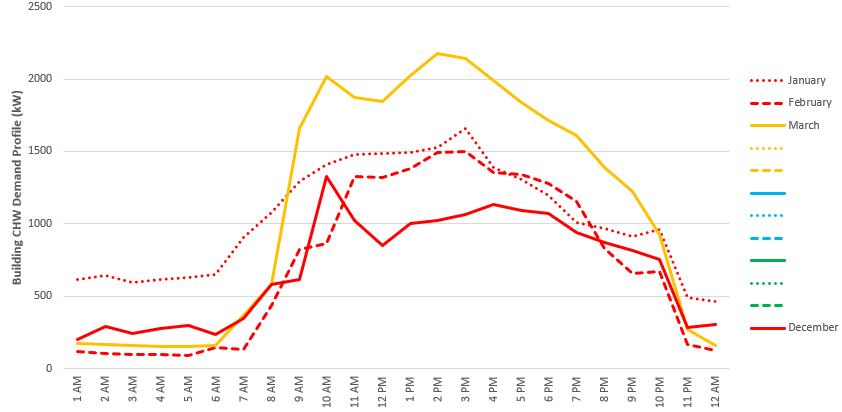

Figure
2.2 Boilers vs Heat Pumps
In the evolution of heating systems, understanding the historical context of heating hot water (HHW) supply temperatures is essential, particularly concerning the transition from traditional fossil gas fired boiler systems to modern electric heat pump technology.
2.2.1 Boilers
2.2.1.1 Technology Description
Atmospheric Boilers and Condensing Boilers are the two predominant types of boilers that are used for supplying heating hot water.
Atmospheric Boiler
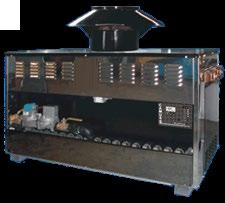
Throughout history, atmospheric boilers have dominated the heating landscape, commonly operating at relatively high supply temperatures. In an atmospheric boiler, combustion occurs at atmospheric pressure without special measures to recover heat from flue gases. The combustion process generates heat, and combustion byproducts are expelled through the flue stack. In commercial settings, supply temperatures typically exceed 80°C, and in larger commercial facilities or industrial applications, they can be even higher. While atmospheric boilers effectively met heating demands, their efficiency was compromised by their inability to capture and utilise latent heat from flue gases.
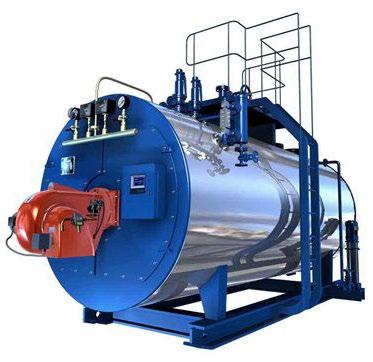
The development of condensing boilers with internal components that recover latent heat from water vapor in flue gas has significantly improved heating efficiency. However, this efficiency gain requires boilers to operate at lower supply and return temperatures. Typically, supply temperatures are around 70°C, and the return temperature must be below the dew point of fossil gas (approximately 55°C) to enable heat recovery through condensation. Therefore,
Table 1: Boiler types used for heating hot water in HVAC systems in buildings
Condensing Boiler
condensing boilers are designed to operate at these lower temperatures to maximise efficiency. Despite this, many condensing boilers are still installed to operate at higher supply temperatures, resulting in minimal efficiency gains.
10oC – 20oC below Supply Temperature
2.2.1.2
Heating Arrangement
The below is an example of a typical heat flow diagram of boiler systems:
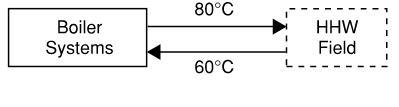
Boiler systems are relatively straightforward. An 80°C supply of hot heating water (HHW) can be delivered directly to the field (to air handling units (AHUs), fan coil units (FCUs) or variable air volume units (VAVs)), with 60°C return HHW coming back to the boiler for reheating after the thermal energy required for heating is delivered. It is important to note that the return temperature does not necessarily have to be 60°C – this is merely the system design parameter for thermal delivery capacity.
Ultimately the actual return temperature observed at site is based upon how much thermal energy stored in the supply HHW is delivered to the field (heating demand). The return temperature can be higher if the building's heat load is lower than the system design capacity.
2.2.1.3
Spatial Requirement
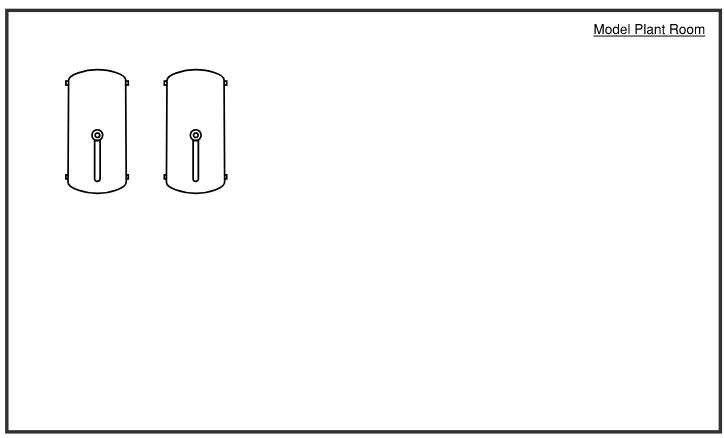
Boiler systems have a relatively small spatial requirement, contributing to their popularity in modern construction, particularly in commercial real estate where maximising the available building footprint for commercial use is prioritised over allocating space for mechanical plant rooms.
Figure 2 . Typical heat flow diagram of a hot water boiler system used in HVAC systems for buildings.
Below is an indicative footprint requirement for boiler systems in a model plant room, showing the relatively small amount of space allocated to the boilers:
2.2.2 Heat Pumps
2.2.2.1 Technology Description
A wide range of heat pump technologies is available in the market, each designed to meet specific applications based on unique requirements. This study focuses on air-to-water and water-to-water heat pumps, as they are the most widely applicable and effective for commercial and industrial settings.
Technology
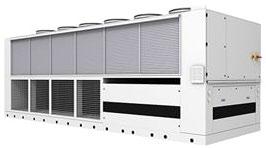
Air - water Heat Pump
Description
An air-to-water heat pump is a type of heat pump system that extracts heat from outdoor air and transfers it to water for heating purposes. It consists of an outdoor unit containing a compressor and a fan to extract heat from the ambient air. This heat is absorbed by a refrigerant circulating within the system. The refrigerant is then compressed, raising its temperature, and the heat is transferred to a water loop through a heat exchanger. The heated water can then be used for space heating, domestic hot water (in some cases), and
HHW Supply
Temperature:
50oC – 80oC
HHW Return
Temperature:
5oC – 10oC below Supply
Temperature
Refrigerant, HHW Supply Temperature, and Load dependent. When HHW supply temperature is ~75 oC:
COP 1.5 – 2.1
Figure 3: Footprint requirement for boiler system in a model plant room
Table 2: Heat pump types used for heating hot water in HVAC systems in buildings
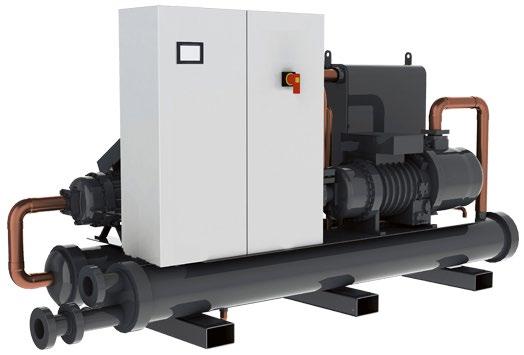
Water - water Heat Pump
other applications. Most of the work is done by the refrigerant system in this cycle.
The supply temperature of air-to-water heat pumps is typically capped at around 75°C, which is when their efficiency is at its lowest. These heat pumps operate more efficiently at lower supply temperatures. In commercial settings, where air-to-water heat pumps are used for space heating, the supply water temperature can be as low as 50°C, provided the coils within AHUs and FCUs can support this temperature.
A water-to-water heat pump operates similarly to an air-to-water heat pump but extracts heat from a water source instead of air. Most of the work is done by the refrigerant system in this cycle.
This technology can generate high supply temperatures, reaching up to 120°C, depending on the supplier and design.
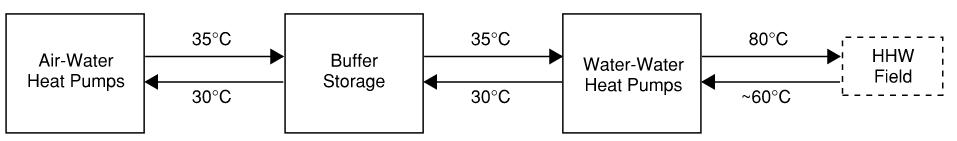
High-temperature water production using heat pumps often involves a cascading arrangement of both air-to-water and water-to-water heat pumps:
• First, cold water is warmed using an air-to-water heat pump (e.g., from ~25°C to ~32°C).
• The warmed water is then further heated by a water-to-water heat pump to achieve the desired supply temperature (e.g., from ~32°C to over 70°C).
The hot water produced is then transferred to hot water coils within AHUs, FCUs, or heat exchangers for distribution.
HHW Supply
Temperature: > 70oC
HHW Return
Temperature:
10oC – 20oC below Supply
Temperature
Refrigerant, HHW Supply
Temperature, and Load dependent.
When HHW supply temperature is ~70 oC:
COP 3.4 – 4.6
When HHW supply temperature is >120 oC:
COP 1.2 – 2
2.2.2.2 Heating Arrangement
It should be noted that for heat pump systems, depending on the HHW supply temperature of the site, heating can be delivered to the field either via a single stage heating arrangement involving only air-to-water heat pumps where HHW supply temperature is ≤ 70oC, or via a cascade heating arrangement where both air-water heat pumps and water-water heat pumps are involved in the heat delivery.
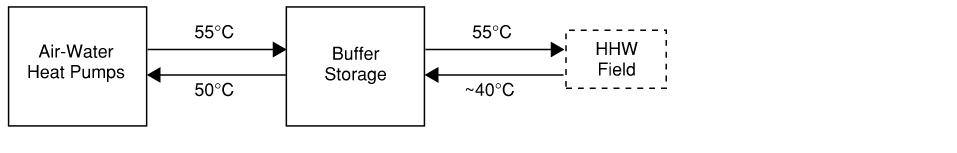
Single Stage Heating
The below is an example heat flow diagram of single stage heating heat pump systems:
Cascade Heating
The below is an example heat flow diagram of cascade heating heat pump systems:
Explaining the specific design and details for each of the above systems is beyond the scope of this document. This illustration is presented to visually represent the different equipment requirements and complexities associated with higher HHW temperature requirements only.
2.2.2.3 Spatial Requirement
Heat pump systems have a higher spatial requirement than equivalent boilers, and hence require significant time investment in engineering during the design stage to develop mechanical designs that could deliver heating most efficiently while minimising the spatial footprint and associated structural, mechanical or hydraulic modifications, as indicated in Figures 6 and 7
Figure 4 : Heat Flow diagram of a single stage heat pump system for low temperature hot water
Figure 5 : Heat Flow diagram of a cascade heat pump system for high temperature hot water
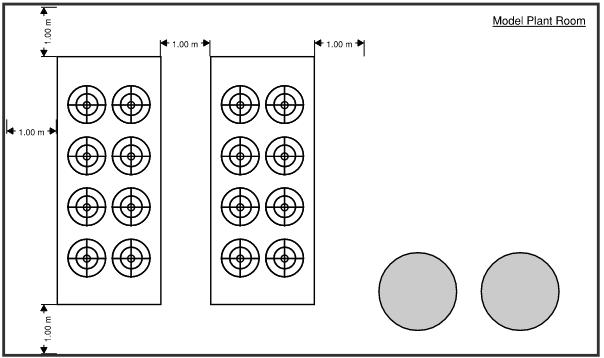
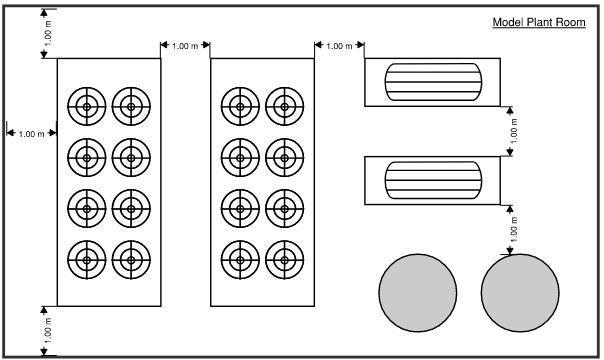
Figure 6 : indicative footprint requirement for single stage heating systems in a model plant room
Figure 7 : indicative footprint requirement for cascade heating systems in a model plant room
3 HHW System Capability testing
The following high-level process is detailed herein for site teams to work through for preparation and actual testing, based on the requirements and risk profile of the site.
Outputs:
- Understanding of critical areas and testing envelope boundaries.
Understand site constraints and Stakeholder communications plan (Section 3.1)
Understand your environment (Section 3.2)
Complete high-level performance Baseline testing (Section 3.3)
Field testing of different HHW temperatures - Planning (Section 3.4)
o i.e., Key risks, mitigations and testing termination conditions
- Stakeholder groups and communications strategies
Outputs:
- Detailed understanding of (and remediation if possible) where existing system efficiency is lacking
- Confirmation of variable/fixed flow characteristics
- Determination of control / logging system maturity
- Confirmation of existing design specifications
Outputs:
- Peak boiler thermal output (kW) – site load
- Min/ Max/ Ave HHW flow and return temperatures
- Zone warm-up characteristics (time/profile)
- Potential areas of concern, i.e., marginal performance under baseline
o Check and remedy if possible (inc Appendix 1)
Outputs:
- Testing timeframe outlined; planning completed
- Risks understood and planned for during this timeframe
OK to Proceed wit testing?
Follow Testing methodology (Section 3.5)
Outcomes:
- Base system design capacity confirmed
Why? Consider what changes are necessary for testing, i.e.
- Additional mitigations for perceived risks?
- Require more monitoring and data capabilities?
- Develop a plan to implement and recommence
- Base system ‘required’ capacity during operation confirmed
- Site response to lower HHW temperatures (HHW and zone warm-up characteristics)
- Understanding of operational limits (based on testing conditions) regarding HHW temperatures
o Lowest flow temperature °C and temperature delta (dT) confirmed
- Areas of concern or areas that performed poorly that require attention during subsequent activities.
- Note that it is unlikely that this testing will definitively confirm a sites suitability for heat pump installation and technology solution, but the information gathered will provide valuable information to engineers for the design process.
Figure 8: high -level process for preparation and actual testing of current site heating requirements.
3.1 Site constraints and Communication with site occupants
Each site will have differing levels of sensitivity/risk when it comes to temperature fluctuations. A site may be flexible/resilient when it comes to minor temperature fluctuations, and this may be easily managed. However, some sites will have critical and/or contractually mandated requirements that need to be considered in testing design.
KeyPoint:Stakeholdercommunicationiscriticalforbuyinandissuediscovery. A communicationplanshouldbedevelopedtoaddressthecontentandfrequencyof communicationsnecessary;
1. Each site should clearly understand the degree of temperature fluctuation that will be able to be accommodated, across each of the conditioned spaces, and the duration that this deviation can occur before recovery.
These conditions and critical areas should be carefully monitored and logged, if possible, with clear escalation and rollback procedures in place to be quickly activated if concerns are observed on site.
2. Be aware that the level of detail that is provided to stakeholders should be carefully considered to ensure that heightened awareness of these activities does not raise the potential for false reporting of concerns.
I.e., Heightened awareness can cause heightened sensitivity.
3. Consider a cascaded approach for communicating to stakeholder groups, and even within these groups, where the detail is appropriately moderated. See examples in section 3.1.1 below.
4. This strategy is highly dependent upon the site, its sensitivities, lease agreements and other relevant requirements and accordingly should be carefully considered on a case-by-case basis.
Whilst each site will be different, it is recommended that the following representatives are involved in the testing (planning and implementation) as a minimum;
- Facilities Manager
- Building Management System (BMS) user / Controls technician
- Mechanical Services Contractor
- Stakeholder representative (internal, such as from your leasing team who is familiar with any contractual requirements relating to space conditions)
- Tenant representatives (if needed - involving the tenant may or may not be advantageous for a site and this should be considered on a case-by-case basis.)
Others may be considered on an ‘as needed' basis based on the complexity of the site and the severity of the risks that need to be controlled for during testing.
Communications guide
Whilst the communications plan will need to be developed for each site based on local constraints and sensitivities, the following items can act as a guide for how to raise awareness in the lead up to, and during testing without causing unnecessary concern or heightened sensitivity to conditions.
Issuereporting
Most sites will have a process for reporting of temperature concerns, i.e., hot / cold calls, with facilities management. In the lead up to testing, consider a campaign to raise awareness of these existing processes so that the process for raising a concern is understood and close at hand. Consider;
- Email mailout
- Lunch and Learn sessions
- Facilities portals (web based)
- Digital signage
- Notice board updates
It is important to include in these communications, details that users can use to resolve the issue for common problems, for example;
- Too Cold? Check for open doors or windows that could be letting the heat out. Don’t turn on portable heaters – as well as wasting energy these can actually make the problems worse within the space!
Cascaded communications
There is no surer way to generate a ‘cold call’ than to tell a space user that you are turning down the heater.
The testing described herein does not actually suggest any reduction of zone set points, however given the complexity of large commercial HVAC systems, this context will be lost on most users. To address this, one approach is to cascade the level of detail for each stakeholder group to tailor for the information that is necessary and no more.
As an example of this approach, the site may want to make users aware of the testing and potential for impacts using a more innocuous term and generalised timeframes. The end users in this approach may simply be told;
- “During the month of August, Facilities Services will be conducting important testing and tuning activities with the HVAC system as we prepare for future upgrades and capabilities. Should you notice any concerns regarding space comfort during this time, please report this to the services desk using the established procedures.”
- Using a date range, and not specific dates, will enable the reporting data to naturally filter out if there are any concerns being raised on days when testing was not being conducted. These findings are very important as they may indicate existing issues with the system that are independent of any HHW temperature reduction
In this same example, higher level users may be involved in the planning, testing and reporting process and be privy to actual dates of testing.
3.2 Understanding your environment and existing heating system
For general energy efficiency, and also to minimise the size of the required heat pump on site for heating, the following needs to be reviewed at a high-level before any testing commences;
3.2.1 System
Efficiency
Are there heat loses or inefficiencies that can be addressed;
- Pipework/storage lagging and insulation – missing, damaged
- Poor air flow within spaces
- Fresh air strategies ( i.e., air changes)
- Air locks for high traffic entrances
- General air tightness of the space (including openable windows)
- Insulation and glazing
These options to increase system efficiency and decrease losses are critical to developing a total system design that is optimised for size (and/or consider issues associated with ‘underheating’. Further details are included in Appendix 1.
Improving ‘total system’ efficiencies as best possible/practicable should be considered as a vital first step in any major plant and equipment retrofit.
Note these issues down as they are discovered if they cannot immediately be addressed.
o This may provide you with options to consider in the event you come across any issues with the current system capabilities during subsequent testing.
3.2.2
Variable flow HHW
Many older systems ( i.e., with 3-way valves etc) have fixed HHW pump speeds and upgrade to variable flow systems will better match thermal delivery to demand and reduce system losses, enabling easier heat pump integration and optimal efficiencies in operation.
3.2.3
Whilst not essential to enable electrification, if variable flow is not part of the system, consideration of this should form a key part of heat pump feasibility as a design option.
Controls / logging - sophistication and maturity
Site capabilities / limitations will greatly influence how you approach the readiness assessment testing and design of any heat pump retrofit.
- Some newer buildings will have extensive BMS control and logging capability which will greatly aid in the speed and accuracy of the preliminary investigations.
- Older sites will likely not have these controls, or they will only have controls on limited systems with low / no visibility.
- More data availability will enable more certainty and fewer assumptions.
Determine where the site sits regarding the maturity of the controls and logging capabilities at site to best coordinate testing activities and understand where uplift or projects to improve performance may be necessary to optimise heat pump sizing investigations. At a high level, determine;
- Can I monitor HHW flow and return temperatures?
- Can I monitor HHW flow rate (L/s) or variable speed drive (VSD) output (Hz)?
- Can I monitor field valve positions (%) – all or just some?
- Can I monitor zone temperatures (°C) - all or just some?
- For the items that I can monitor, can these be logged under the same time series and exported for interrogation ( i.e. , .csv etc, and are there any limitations)?
- If you cannot monitor these with existing systems, you may need to develop a temporary metering scheme or suitable manual processes that allow you to measure the thermal output and flow through the boiler circuit and key zone temperatures over critical times.
o You may need to consider the use other loggers or proxy measurements / indicators to obtain data that will enable the determination of system performance, but this will depend on the system and how critical the site/area requirements are.
3.2.4 Current heating system specifications and design
Determine the ‘design capacities’ for key equipment with a degree of certainty. If this is not documented and clear, suitable engineering consultants may need to assess onsite. The following understanding is required;
What is the designed capacity of the heating system –
- How much heat can be delivered from the boiler to the field reliability?
o Boiler size? Note, sum of the boiler capacities may not be the system capacity if boilers are duty/standby configured.
o Maximum HHW flow rate and temperature differential between flow/return will define the maximum theoretical capacity.
- What flow and return temperatures was the system designed to accommodate?
o As mentioned earlier in this report, it is likely that these temperatures and the temperature delta between flow and return will be different by design to what can typically be provided by a heat pump. Understanding the ‘starting point’ by design is important.
Are there any thermal loads that are easily identifiable as not being capable of tolerating lower than design HHW set points?
- Example; Some sites generate domestic hot water (DHW) using a calorifier or other type of heat exchanger with the HHW circuit. This must be stored at >60⁰C as per AS3500.4. HHW flow temperatures approaching or lower than this temperature will likely be problematic and any such loads on the HHW network will need to be considered further before any testing.
- Important; Before testing, you must understand how these loads will be managed ( i.e., quarantined, supplemented, ignored etc), with suitable plans/procedures implemented.
Are there known ‘problem areas’ for temperature control during the colder months and are the causes of these issues known / can they be fixed?
- Lower HHW temperature testing may exacerbate any problems that you already have.
- Consider heating system efficiency options available to these spaces/systems.
- If efficiency options are not possible there may be existing localised capacity issues – potentially as a result of organic change to the space over time.
o If there are existing capacity issues in some spaces, an ideal time to implement such a capacity uplift is at the same time as the heat pump installation as coil temperatures can be matched.
As your site progresses through the design process, more detailed information regarding the existing system design will be required by engineering teams to optimise design and risk. A detailed checklist for this purpose has been developed and is included in Appendix 2 for your reference and use. Appendix 3 contains detailed explanations of a typical heating system.
Now that the site’s data capture capabilities are known, plans for addressing any shortcomings in this area have been developed, and the system design specifications are understood, it is time to consider testing the resilience of the system under different HHW temperature set points.
3.3 Baseline testing – find the starting point
In the first instance baseline performance should be measured and logged. This testing should be completed without making any changes to the system and should occur on a cold day / week during the heating season to get a clear understanding of the peak loads profiles across multiple days.
The following steps outline a recommended process to follow, noting that this needs to be considered for suitability for each site by engineers or technicians familiar with the site operations and sensitivities.
Table 3: Baseline testing procedure.
STEP Instructions
1 Ensure all data capture and logging is in place for this testing and the date/time is being recorded.
2 Measure the peak thermal output (kW) of the boiler and daily load profile during the period
• Seek to achieve hourly data sets as a minimum but ideally,15-minute intervals or better.
3 Measure HHW flow and return temperatures during the period.
• Seek to achieve hourly data sets as a minimum but ideally,15-minute intervals or better.
4 Measure zone temperatures in critical areas during the period
• Seek to achieve hourly data sets as a minimum but ideally,15-minute intervals or better and an understanding of the warm-up cycle time is key here.
5 Where possible, determine and note;
• Any field valves, pumps or fans (variable only) that operate at 100% for extended periods.
• Any zone temperatures that are not achieving or holding set point.
• Any ‘cold call’ complaints from occupants or heating system control system ‘alarms’ that are recorded.
It is noted that determining these abovementioned items will enable confident decision making and design assumptions moving forward, however;
• If some or all of these cannot be measured ( i.e., not possible/practical), the system performance will still be able to be determined by review of zone temperature and HHW system flow characteristics.
• An understanding of these parameters is very useful in completing heat pump design activities. This will also identify areas where data can be improved upon in the future.
6 Investigate the issues identified in step 5 for simple fixes and efficiency measures (i.e., manual valve settings, filter media changes etc) and fix if possible.
Ifissuesfoundandfixedarelikelytohavehadasignificantimpactonheatingsystem performance,repeattestingfromthestart
• For any that cannot be fixed immediately, take note of these potential areas of concern for increased focus during future testing and consideration of efficiency options as the design progresses.
Once a clear understanding of baseline performance is established, the site should consider simulating heat pump HHW temperatures (i.e., lower HHW flow temperature) in order to determine if lower temperatures can be accommodated and under what basis.
To proceed, using the outcomes from your investigations in this section 3.1 – 3.3, you should determine the testing methodology most appropriate for further testing.
3.4 Field testing of different HHW temperatures (Heat pump simulation)Planning.
In the event that there were no significant areas of concern found during the baseline evaluation (section 3.3), it is reasonable to consider a program of activities to reduce the temperature of the HHW circuit to better simulate what can be provided by a heat pump.
IMPORTANT; This testing must be performed during cold ambient periods that best approximate / approach system design conditions. Given these design conditions are typically ‘extreme weather’, it is noted that it may not always be possible to coincide testing windows with extreme (cold) weather events.
- The coldest time possible should be targeted and engineering assumptions will need to be considered by suitable design engineers to supplement the findings of the testing.
- This testing cannot be completed during warmer periods.
BE AWARE; During this testing, it may be determined that area(s) are not capable of supporting lower HHW temperatures. Careful monitoring must be included by the site supervisor and facilities teams for critical areas that may be sensitive to deviations from control set points – with recovery plans in place to roll back changes quickly in the event that this is deemed necessary. A very clear understanding of your site risk profile (including stakeholder requirements) will inform the planning for these items .
- Know where your high - risk areas are likely to be before testing commences
- Determine if any active risk mitigation measures are required and what these are ( e.g. Dedicated staff and additional monitoring on site / at location)
- Know how these are to be actively monitored, the frequency of this monitoring, and who will be involved to assess any issues that may be experienced in real time.
- Don’t be too quick to roll back, sub-optimal outcomes provide valuable insights if able to be tolerated.
CONSIDER; Given the relatively short and uncertain duration of ‘peak heating season’ each year (1-2 months), the activities need to occur in a relatively short period of time. This would be both site and weather dependant and the best outcomes would be achieved if a time period during the coldest part of the year were chosen for initial HHW temperature reduction.
- More data is always better – so maximise testing to the greatest extent possible.
3.5 A simplified testing methodology
This simplified methodology focuses on making changes to the system and monitoring impacts to the end points (i.e., zone temperatures). Problems in areas are diagnosed by working back through the system and this methodology is quick to implement.
Working carefully with the mechanical services and controls provider(s) at site, a process should be developed to reduce the heating hot water temperature in steps. This should be planned in advance with system control point operation / availability checked and tested ahead of time. As an example, many boilers have manual set points and very simple (local) controls that cannot be configured/altered via BMS (i.e., if rollback is necessary) – these factors need to be considered in the testing / recovery plans.
3.5.1 Testing overview;
- All testing should be done with a suitable ‘hyper care’ service level in place for monitoring and response to temperature issues, where system performance and expected areas of concern are proactively monitored.
- Hypercare is a short period after go-live when you provide extra resources and attention to support your users and business processes. Hypercare helps you make sure that your business can operate smoothly while addressing any initial issues or challenges with the new system
- Ensure personnel are onsite to monitor and respond to issues that may arise during testing It is not recommended to try to administer this testing remotely.
- Using a system with 80°C flow water as an example, one might consider reducing this temperature in 5-10°C steps such as
- Week 1 – 70°C
- Week 2 – 60°C
- Week 3 - 55°C
55°C is a common temperature for HHW heat pumps and will provide numerous design options, carefully consider any need to test below this temperature.
- Noting, duration for testing at each temperature is dependent on both weather and system stability
Do not proceed to the next step (lower temperature) if stability – i.e., ability to achieve and maintain suitable conditions/temperatures - under suitable ambient conditions has not been established.
Lack of stability or failure to achieve required temperatures may indicate ‘underheating’ which should be addressed prior to proceeding.
3.5.2 Methodology:
At each chosen temperature step, completed the following: Table 4: HHW temperature reduction testing procedure.
STEP Instructions
1a Ensure all data capture and logging is in place for this testing and the date/time is being recorded.
1b Lower boiler flow temperature to the chosen temperature and confirm correct operation of boiler
2 Measure the peak thermal output (kW) of the boiler and daily load profile during the period
• Seek to achieve hourly data sets as a minimum but ideally,15-minute intervals or better.
3 Measure HHW flow and return temperatures during the period.
• Seek to achieve hourly data sets as a minimum but ideally,15-minute intervals or better.
4 Measure zone temperatures in critical areas during the period
• Seek to achieve hourly data sets as a minimum but ideally,15-minute intervals or better and an understanding of the warm-up cycle time is key here
5 Where possible, confirm that the system is operating in a stable manner, note;
• Any significant heating hot water temperature excursions from setpoint.
• Any field valves, pumps or fans (variable only) that operate at 100% for extended periods.
• Any zone temperatures that are not achieving or holding set point – especially if this differs from the baseline testing results.
• Any ‘cold call’ complaints from occupants or heating system control system ‘alarms’ that are recorded.
It is noted that determining these abovementioned items will enable confident decision making and design assumptions moving forward, however;
• If some or all of these cannot be measured ( i.e., not possible/practical), the system performance will still be able to be determined by review of zone temperature and HHW system flow characteristics.
• An understanding of these parameters is very useful in completing heat pump design activities. This will also identify areas where data can be improved upon in the future.
6 Investigate the issues identified in step 5 for simple fixes and efficiency measures (i.e., manual valve settings, filter media changes etc) and fix if possible.
Ifissuesfoundandfixedarelikelytohavehadasignificantimpactonheatingsystem performance,repeattestingfromthestart
- For any that cannot be fixed immediately, take note of these potential areas of concern for increased focus during future testing and consideration of efficiency options as the design progresses.
- If there are areas that are NOT reaching an acceptable zone temperature at any step in HHW temperature reduction, this may require a more detailed review of the system sizing and efficiency options for these individual areas which mechanical contractors, controls providers and suitable engineering consultants can provide assistance with.
There are several strategies that can be considered to address any potential ‘underheating’ issues that are discovered prior to considering significant works to increase system capacities.
- Understanding if these issues occur under steady state operation or during peak periods only is critical in developing appropriate mitigation strategies.
7 If you are comfortable that the site is operating in a stable manner, there is no significant ‘underheating’ and the system is providing the required heating under this lower set point, revert back to Step 1 and continue lowering the HHW temperature.
Whilst this testing procedure will provide an indication as to how the site will (or will not) be able to accommodate lower HHW temperatures, this approach does not consider potential upstream impacts of the lower temperatures – i.e., what is happening within the various heating system components.
In the event that the site requires more detailed information regarding what is occurring upstream (for system-wide, or even smaller localised design considerations), more targeted testing may be required to extract data and outcomes at these system levels. Additional testing, and or analysis of logged data, may be necessary in this case.
Any ‘additional’ testing or data analysis methodologies will be different for most locations and based on the site’s specific design/installation and the capabilities as relates to control (sensory environment) and data capture. An example of how one might approach this testing in a much more detailed manner in a modern
and contemporary installation has been included in Appendix 4 for reference should a more detailed approach be sought by the reader.
4 Outcomes and next steps
Following completion of the heating capability testing following the included methodologies, the site should have enough information about the system performance to make reasonably confident engineering assumptions that will enable the progression of a design for an optimised heat pump solution.
The following details will have been determined;
• Base system capacities by design
• Base system capacity requirements during normal operation
o This will ensure heat pump sizing can be optimised.
• How the site and heating systems respond to lower HHW temperatures
o This will confirm if you can lower HHW temperatures without significant impacts to site.
• An understanding if there is a clear operational limit on HHW temperatures.
o What the lowest flow temperature that can be accommodated and importantly,
o What the return temperature is under these conditions - so that the ‘temperature delta’ (dT) can be determined.
Example, temperature can be reduced from 80°C to 65°C with 10°C dT, but if the temperature drops to 55°C we have problems. The heat pump specified must be capable of achieving 65°C / 10°C dT.
o Knowing the lowest possible flow temperature and dT will significantly reduce the cost and complexity of heat pump requirements both in terms of the heat pump equipment and also, any new field infrastructure requirements.
• Details of areas that are of concern or areas that have performed poorly (through data or user feedback)
o These areas should be focused on during heat pump design and any required modifications or efficiency options can be planned and delivered simultaneously.
An engineering consultant should be engaged to assist where site personnel are not confident that they can perform this testing and gather the necessary data to achieve the abovementioned outcomes.
4.1 Points to note about lowering HHW temperatures
- Increases to electrical use in fan/pumps caused by lower HHW flow temperatures are to be expected in most cases – however these increases are often offset by elimination of fossil gas use in the boiler and higher COPs from the heat pump.
- This should be considered and modelled by the design engineer as part of the implementation development planning, which will build from these results.
- It may be prudent to consider retaining an existing fossil gas fired boiler, if possible, at site for peaking use under a HHW temperature reset strategy. This may allow for the specification of a lower temperature and simpler to install heat pump whilst retaining a higher HHW temperature capability at site for use if needed. This would be especially relevant if there were concerns or marginal results obtained during site testing. This should only be considered under the following general design principles;
- Similar to ‘emergency reserve’ generation within the grid, control to activate the boiler through HHW temperature reset should be set to ‘last resort’ parameters.
Ie, this should only operate, by design, for a handful of hours each year under extreme ambient conditions.
Any boiler activation/operation should be reviewed as part of routine and planned building tuning to determine if there are changes to the system, efficiency options and/or control parameters that could be implemented so that boiler operation would not be required in the event that similar conditions are experienced in the future.
- Example – peak demand during a very cold morning exceeded heat pump capacities and triggered the boiler to operate.
o If no efficiency options are possible, review if an earlier start time under these conditions would have enabled temperatures to be achieved in an appropriate timeframe without compromising conditions during occupied hours.
o Put simply: Put a time delay control provision on HHW temperature reset strategy.
- This tuning should be embedded within an installation contractor’s defects liability obligations at the time of procurement if utilised.
- Other forms of electric boost ( i.e., electric element) are also possible, either within system level components (including storage) or for limited/local use ( i.e., electric duct reheats), noting these will likely impact peak electrical loads and should be applied under the same ‘principles’ as above.
- Operation of gas boilers with low leaving HHW temperatures can in some cases result in low exhaust gas flue temperatures and condensation in the exhaust stream. This condensate can be very corrosive and can cause damage to the flue and other system components over time.
- Short term / limited operation should be acceptable under these conditions. However, this should be checked with the boiler manufacturer (or suitable mechanical services contractor) and carefully monitored.
- If the site boiler is not designed to accommodate condensate drainage and low flue temperatures, seek advice from the manufacturer if you wish to continuously operate at lower HHW temperatures.
Appendix 1 – System efficiency options / considerations
The following items can be considered as a means of increasing system efficiency (to minimise heating requirements) and/or to address any areas where ‘underheating’ is identified.
Category Measure Stage
Controls HHW Reset
Can be implemented before HHW
Temperature Testing
Controls Space
Temperature Set Point and Control Bands
Optimisation
Can be implemented before HHW
Temperature Testing
Description
HHW reset strategy dynamically adjusts the supply temperature of heating hot water based on outdoor temperatures and real-time heating demand. Control systems and sensors monitor conditions and use algorithms are applied to optimise the supply temperature, increasing it in colder weather and decreasing it in warmer weather. An example of the HHW reset strategy in action is a commercial office building equipped with advanced control systems. During the winter, when outdoor temperatures drop to 0°C, the system increases the HHW supply temperature to 70°C to ensure sufficient indoor heating. As the outdoor temperature rises to 20°C, the control system lowers the HHW supply temperature to 60°C, reducing energy consumption and potentially heat loads that can address the site’s underheating issue.
Optimising space temperature set points and control bands can contribute to heat load reduction. By adjusting set points such as lowering heating set points in winter and raising cooling set points in summer less energy is required to maintain indoor temperatures, directly reducing the heat load. Additionally, implementing wider control bands allows for greater temperature variation before the HVAC system activates, which decreases the frequency of heating and cooling cycles. This not only reduces the strain on the system but also lowers the overall energy consumption, effectively contributing to heat load reduction. Further, it is not uncommon for ‘setpoint creep’ to occur on a site over time and these issues should be systematically reviewed.
Table 5: System efficiency options.
Category Measure Stage Description
Hydraulic Insulating Pipework
Building Fabric Glazing Improvement via low-emissivity coating
Can be implemented before HHW
Temperature Testing
Often facilities that are undermaintained or aged have insulation that has degraded or is no longer sufficient based on current standards. Reinsulating pipework can contribute to less heat loss across the pipework and can hence retain better heat delivery and flow characteristics.
Building Fabric Insulation
Can be implemented before HHW
Temperature Testing
Low-emissivity (low-e) coatings can be applied to existing glazing to reduce thermal conductivity, offering a cost-effective alternative to replacing windows with expensive glazing materials or double glazing. While not as effective as full window replacements, low-e coatings still significantly reduce both heating and cooling loads, improving energy efficiency and reducing HVAC demand.
Tinting products with darker tints can also enhance a glazing's solar heat gain coefficient (SHGC), helping absorb solar heat during winter and reducing peak heat loads. However, they may slightly increase heat loads during warmer periods. Therefore, careful energy modeling is recommended to balance the benefits throughout the year.
Can be implemented before HHW
Temperature Testing
Air Tightness General Can be implemented before HHW
Temperature Testing
Insulation (wall, ceiling, floor) will retain more heat within a conditioned space. Insulation acts to eliminate/minimise certain heat transfer mechanisms that result in energy, in the form of heat (hot/cold), escaping / entering a space. Less heat loss under heating will result in lower heating requirements and improved efficiencies.
General air tightness measures will stop bulk leakage from internally pressurised systems as well as leakage caused by external pressure excursions (i.e. – high winds). This involves sealing gaps and cracks (even very small ones) that allow air to flow through. These leaks can be detected with ‘blower testing’ and in most cases are reasonably low cost to seal. Permanently sealing openable windows, where these are not necessary for
Category Measure Stage Description
fresh air infiltration, is another strategy to consider as ‘best practice’ to defend against unnecessary energy waste.
Air
Tightness
Air locks and segregation of areas Can be implemented before HHW Temperature Testing
Storage Install thermal system storage Can be considered as part of the design for subsequent installation
It is not uncommon to observe installation where significant quantities of conditioned air is ‘spilled’ to unconditioned spaces – for example, the outdoors through a door or an openable window. The use of doors should be considered in terms of how, and how much, heat is being lost to unconditioned spaces which is wasted and increases capacity requirements and energy usage for heating systems. This can include Automatic closing devices, Airlocks, Air curtains, simple process / behavior change and proper space segregation.
Whilst not technically an efficiency measure, the use of thermal storage can have significant benefits to a HHW system. This is especially the case when it comes to systems with heat pumps and this report would encourage all installations to consider the use of thermal storage in all HHW heat pump retrofits if feasible.
Storage can increase deliverable heat during peak periods (allowing optimal sizing for a heat pump), shift electrical load to more advantageous times (i.e., negative grid pricing) and offer important buffer capabilities to address both heat pump short-cycling and defrost cycle concerns.
Mechanical Air change strategy Can be implemented before HHW
Temperature Testing
Many air conditioning systems operate using inefficient fixed fresh outside air quantities. Fresh air is only necessary to replace ‘stale air’ (odour/CO2 laden) from internal occupants. Modern HVAC systems can remove the requirement for fresh air under conditions when low/no occupancy is detected – generally via CO2 sensors and in many cases they can be retrofitted. This is particularly important during system warm-up cycles when the outside air is coldest and there are generally no/low occupants. Other strategies may also be possible and reducing air changes where viable can significantly reduce both space heating and cooling requirements (peak and total) under most circumstances.
Category Measure Stage Description
Mechanical AHU/FCU Coil
Modification
Implement after HHW Temperature Testing if condition allows
Mechanical Airflow Can be implemented before HHW Temperature Testing
Upon completing HHW temperature testing, testing and recording the parameters of AHUs/FCUs can help identify which coils are undersized or require resizing. If this information is unavailable, resizing may be necessary for all AHUs/FCUs. Impacts to connected pipework need to also be considered in these cases. Balancing cost efficiency is crucial, as modifying numerous coils can approach or even exceed the cost of the heat pumps themselves
Lack of airflow within conditioned spaces and across heating coils (i.e., blocked filters) can impact space comfort and thermal performance regardless of HHW temperatures. Airflow from the registers and flow/infiltration into ‘cold’ spaces should be confirmed and rebalanced if necessary. It is very common for pressure characteristics of a system to change significantly over time in an uncontrolled manner that requires routine correction.
Mechanical Electric Duct Heating
Implement after HHW Temperature Testing if absolutely necessary
After implementing the previously described measures and conducting a second HHW temperature reduction test, if the site still fails to meet heat delivery requirements with lower HHW supply temperatures, there is an option to install electric duct heating at individual VAVs. This option should be considered only if data indicates that specific VAVs deliver supply air at temperatures lower than set-points. If this data is unavailable, the measure is not recommended due to the additional energy required to address localised underheating and the need for individual VAV supply temperatures to be metered.
The following process can be following to consider how to tackle ‘underheating’ based upon whether this is a ‘peak time only’ concern, or if it is something that is observed also once the system has normalised to steady state.
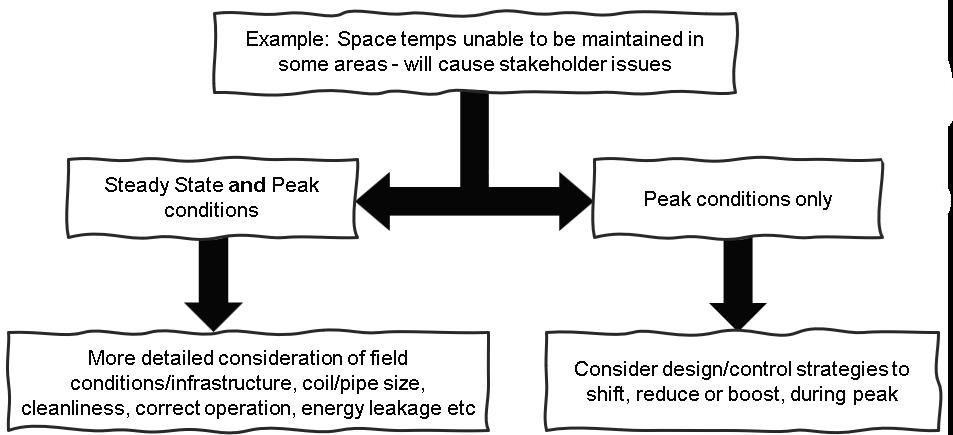
- Steady state concerns – i.e., areas do not reach set point and have no more capacity – present the most significant challenges as this may indicate insufficient capacity to accommodate lower HHW temperatures.
- If these areas are known, strategies and design options to address these areas in line with the heat pump upgrades ( i.e., implement efficiency measures or increase / boost local capacities with electric reheats) can be built into the design and procurement process.
- The testing outcomes may also have revealed areas where system tuning is needed and immediate efficiency gains can be made.
- Peak load concerns can have a number of impacts in the field which need to be considered. Most commonly, peak load shortcomings will translate to a delay in the time taken to achieve system set point upon startup – especially during cold ambient conditions
- This increased time to warm on cold mornings may be acceptable to end users/processes, however if it is not, the following are examples of select considerations that may be applied;
Figure 9: high -level process for consideration of how to remedy space temperature issues.
9: Changes to system/components that may be considered for peak load shortfalls
Appendix 2 – Design / System checklist
Boilers
Boilers
How many boilers are there? Units
Specific specification associated with individual boilers:
• Name/Code of boiler
• Use (space heating / DHW heating / pool heating / etc.)
• Type of boiler (condensing / atmospheric)
• Manufacturer
• Model number
• Serial number
• Heating capacity
> BMS trended? (Yes/No)
> Peak heating capacity observed within one year
> 99th percentile heating capacity
• Max. gas input MJ/hr
> Sub metered or BMS trended? (Yes/No)
> Gas consumption within one year MJ/a
• Supply/Return HHW temperature °C/°C
Figure
> BMS trended? (Yes/No)
> Average supply HHW temperature during heating
> Average return HHW temperature during heating
HHW Pumps
HHW Pumps
How many HHW pumps are there? Units
Specifications associated with individual boilers:
• Name/Code of HHW pump
• VSD controlled? (Yes/No)
• Which boilers does the HHW pump serve?
• Manufacturer
• Model number
• Rated efficiency %
• Pump power kWₑ
> BMS trended? (Yes/No)
> Peak pump power observed within one year (excl. maintenance) kWₑ
> Energy consumption within one year kWh/a
• Peak flow rate L/s
> BMS trended? (Yes/No)
> Peak flow rate observed within one year (excl. maintenance) kWₑ
AHUs/FCUs
AHUs/FCUs
How many AHUs and FCUs are served by the existing system? Units
Specifications associated with individual AHUs and FCUs:
• AHU or FCU
• Name/Code of AHU or FCU
• Manufacturer
• Model number
• Serial number
• Installed year
• Areas served
• Type of fan within AHUs or FCUs (axial, centrifugal, EC fan grid)
• VSD controlled? (Yes/No)
• Total fan power kWₑ
• Name/Code of heating equipment supplying hot water to HHW coil
• HHW coil manufacturer
• HHW coil model number
• HHW coil configuration (counterflow / cascade / crossflow)
• HHW coil design water flow L/s
> BMS trended? (Yes/No)
> Peak flow rate observed within one year (excl. maintenance) L/s
• HHW coil design flow temperature °C
> BMS trended? (Yes/No)
> Average flow temperature within one year during heating °C
> Average entering water temperature during heating °C
> Average leaving water temperature during heating °C
• HHW coil heating capacity kWₜₕ
• Number of column and rows of HHW coils (row | column) # | #
• HHW coil nominal dimension (length | width | thickness) mm | mm | mm
• Name/Code of cooling equipment supplying chilled water to CHW coil
• CHW coil manufacturer
• CHW coil model number
• CHW coil configuration (counterflow / cascade / crossflow)
• CHW coil design water flow L/s
> BMS trended? (Yes/No)
> Peak flow rate observed within one year (excl. maintenance) L/s
• CHW coil design flow temperature °C
> BMS trended? (Yes/No)
> Average flow temperature within one year during cooling °C
> Average entering water temperature during cooling °C
> Average leaving water temperature during cooling °C
• CHW coil cooling capacity kWᵣ
• Number of column and rows of CHW coils (row | column) # | #
• CHW coil nominal dimension (length | width | thickness) mm | mm | mm
• Air flow rate L/s
> BMS trended? (Yes/No)
• Supply air flow rate L/s
> BMS trended? (Yes/No)
• Return air flow rate L/s
> BMS trended? (Yes/No)
• Outside air flow rate L/s
> BMS trended? (Yes/No)
• Air temperature L/s
> Air-on temperature BMS trended?
> Air-off temperature BMS trended?
> Any instance where air-off temperature is below design temperature?
Retrofittability
• Can the existing AHU or FCU be retrofitted with a new HHW coil configured with more rows or columns?
• Can the current CHW coils be repurposed or adapted to function as change-over coils, enabling their use as HHW coils during heating operations?
Condition of coils of AHU or FCU:
• Cleanliness of external surface area, fins, and tubes
• Cleanliness of internal surface area
HHW Pipework
HHW Pipework
Specifications associated with HHW pipework:
• Dimensions (length | thickness | width) mm | mm
• Peak flow rate
• Insulation (R-value)
Condition of HHW Pipework
• Cleanliness
• Insulation
Ductwork
Ductwork
Specifications associated with Ductwork:
• Are electric duct heaters installed? (Yes/No)
• Where are the electric duct heaters installed? (if any)
• Heating capacity of electric duct heaters kWₜₕ
• > BMS trended? (Yes/No)
• > Peak heating capacity of electric duct heaters within a year
• > Energy consumption within a year
• Insulation (R-value)
Condition of Ductwork
• Cleanliness
• Insulation
Appendix 3 – Typical HHW System design / components
To aid in comprehending the HHW system design and the testing contemplated by this document, a typical HHW Schematic has been provided below. This schematic will help illustrate how a typical HHW system operates for space heating purposes:
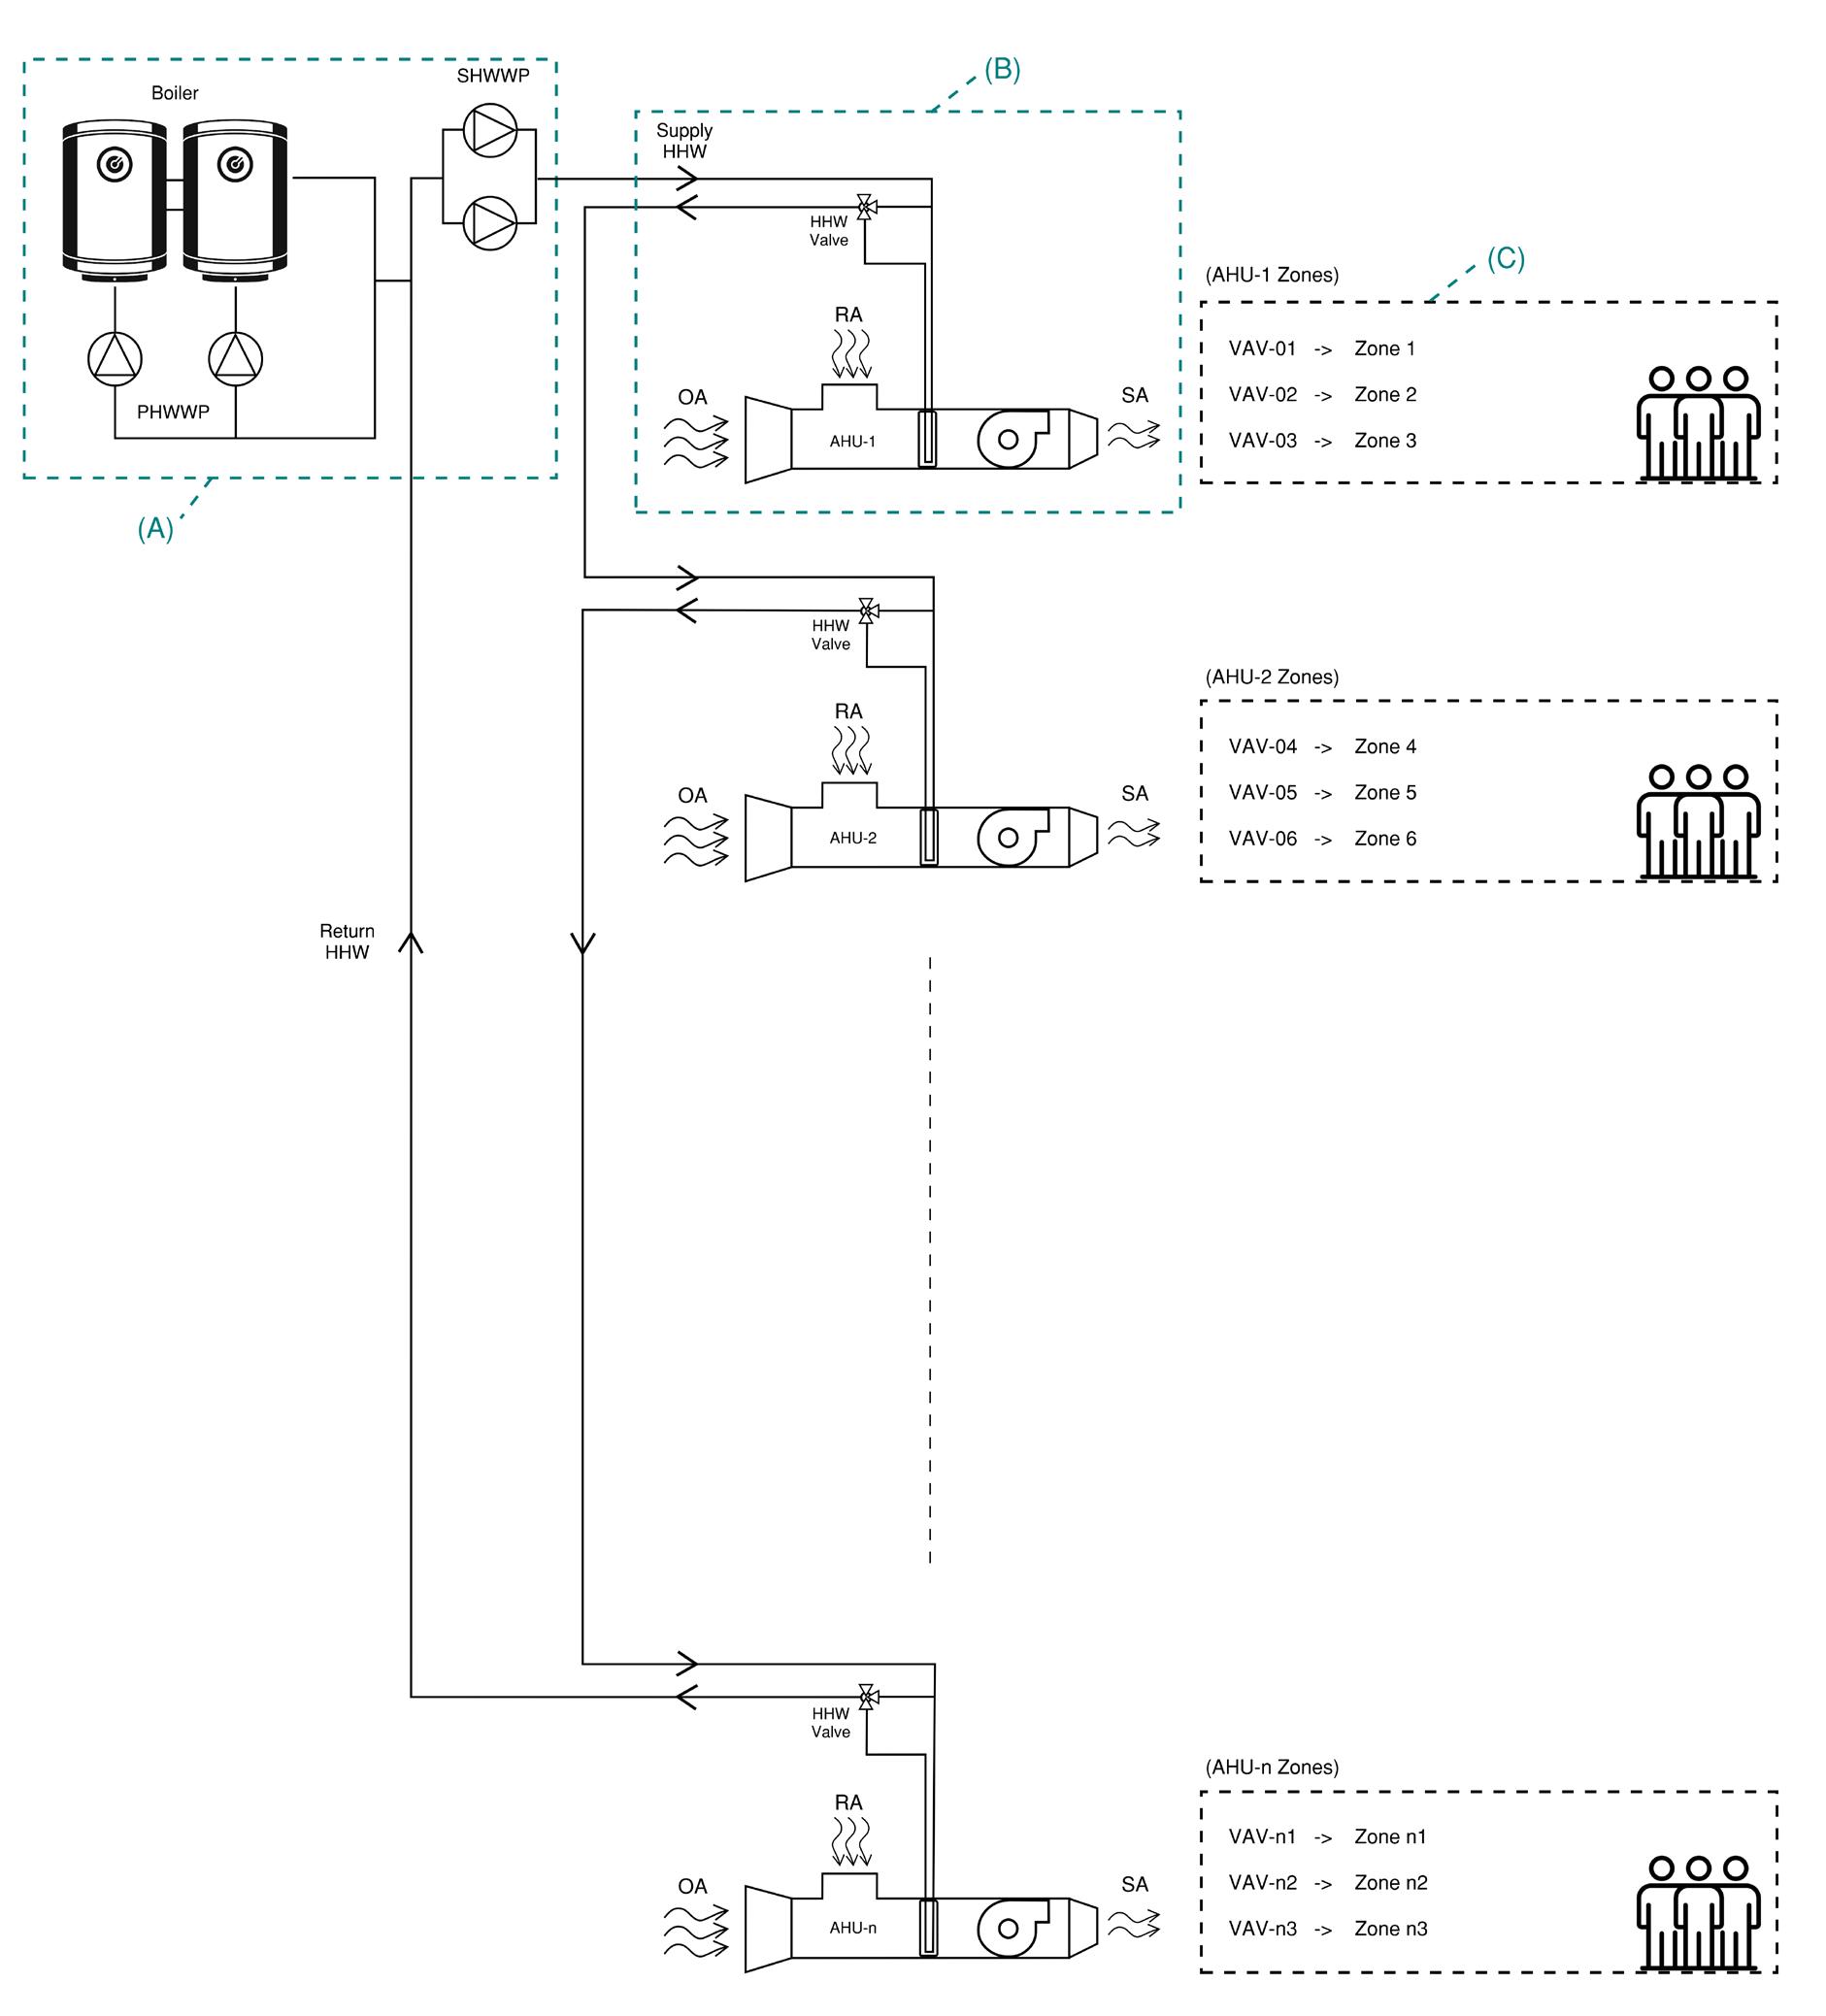
Figure 10: typical HHW / HVAC schematic
The HHW Temperature Reduction Testing Regimes provided herein include various parameters that will be assessed as part of the testing. To simplify understanding, codes have been assigned to different parameters:
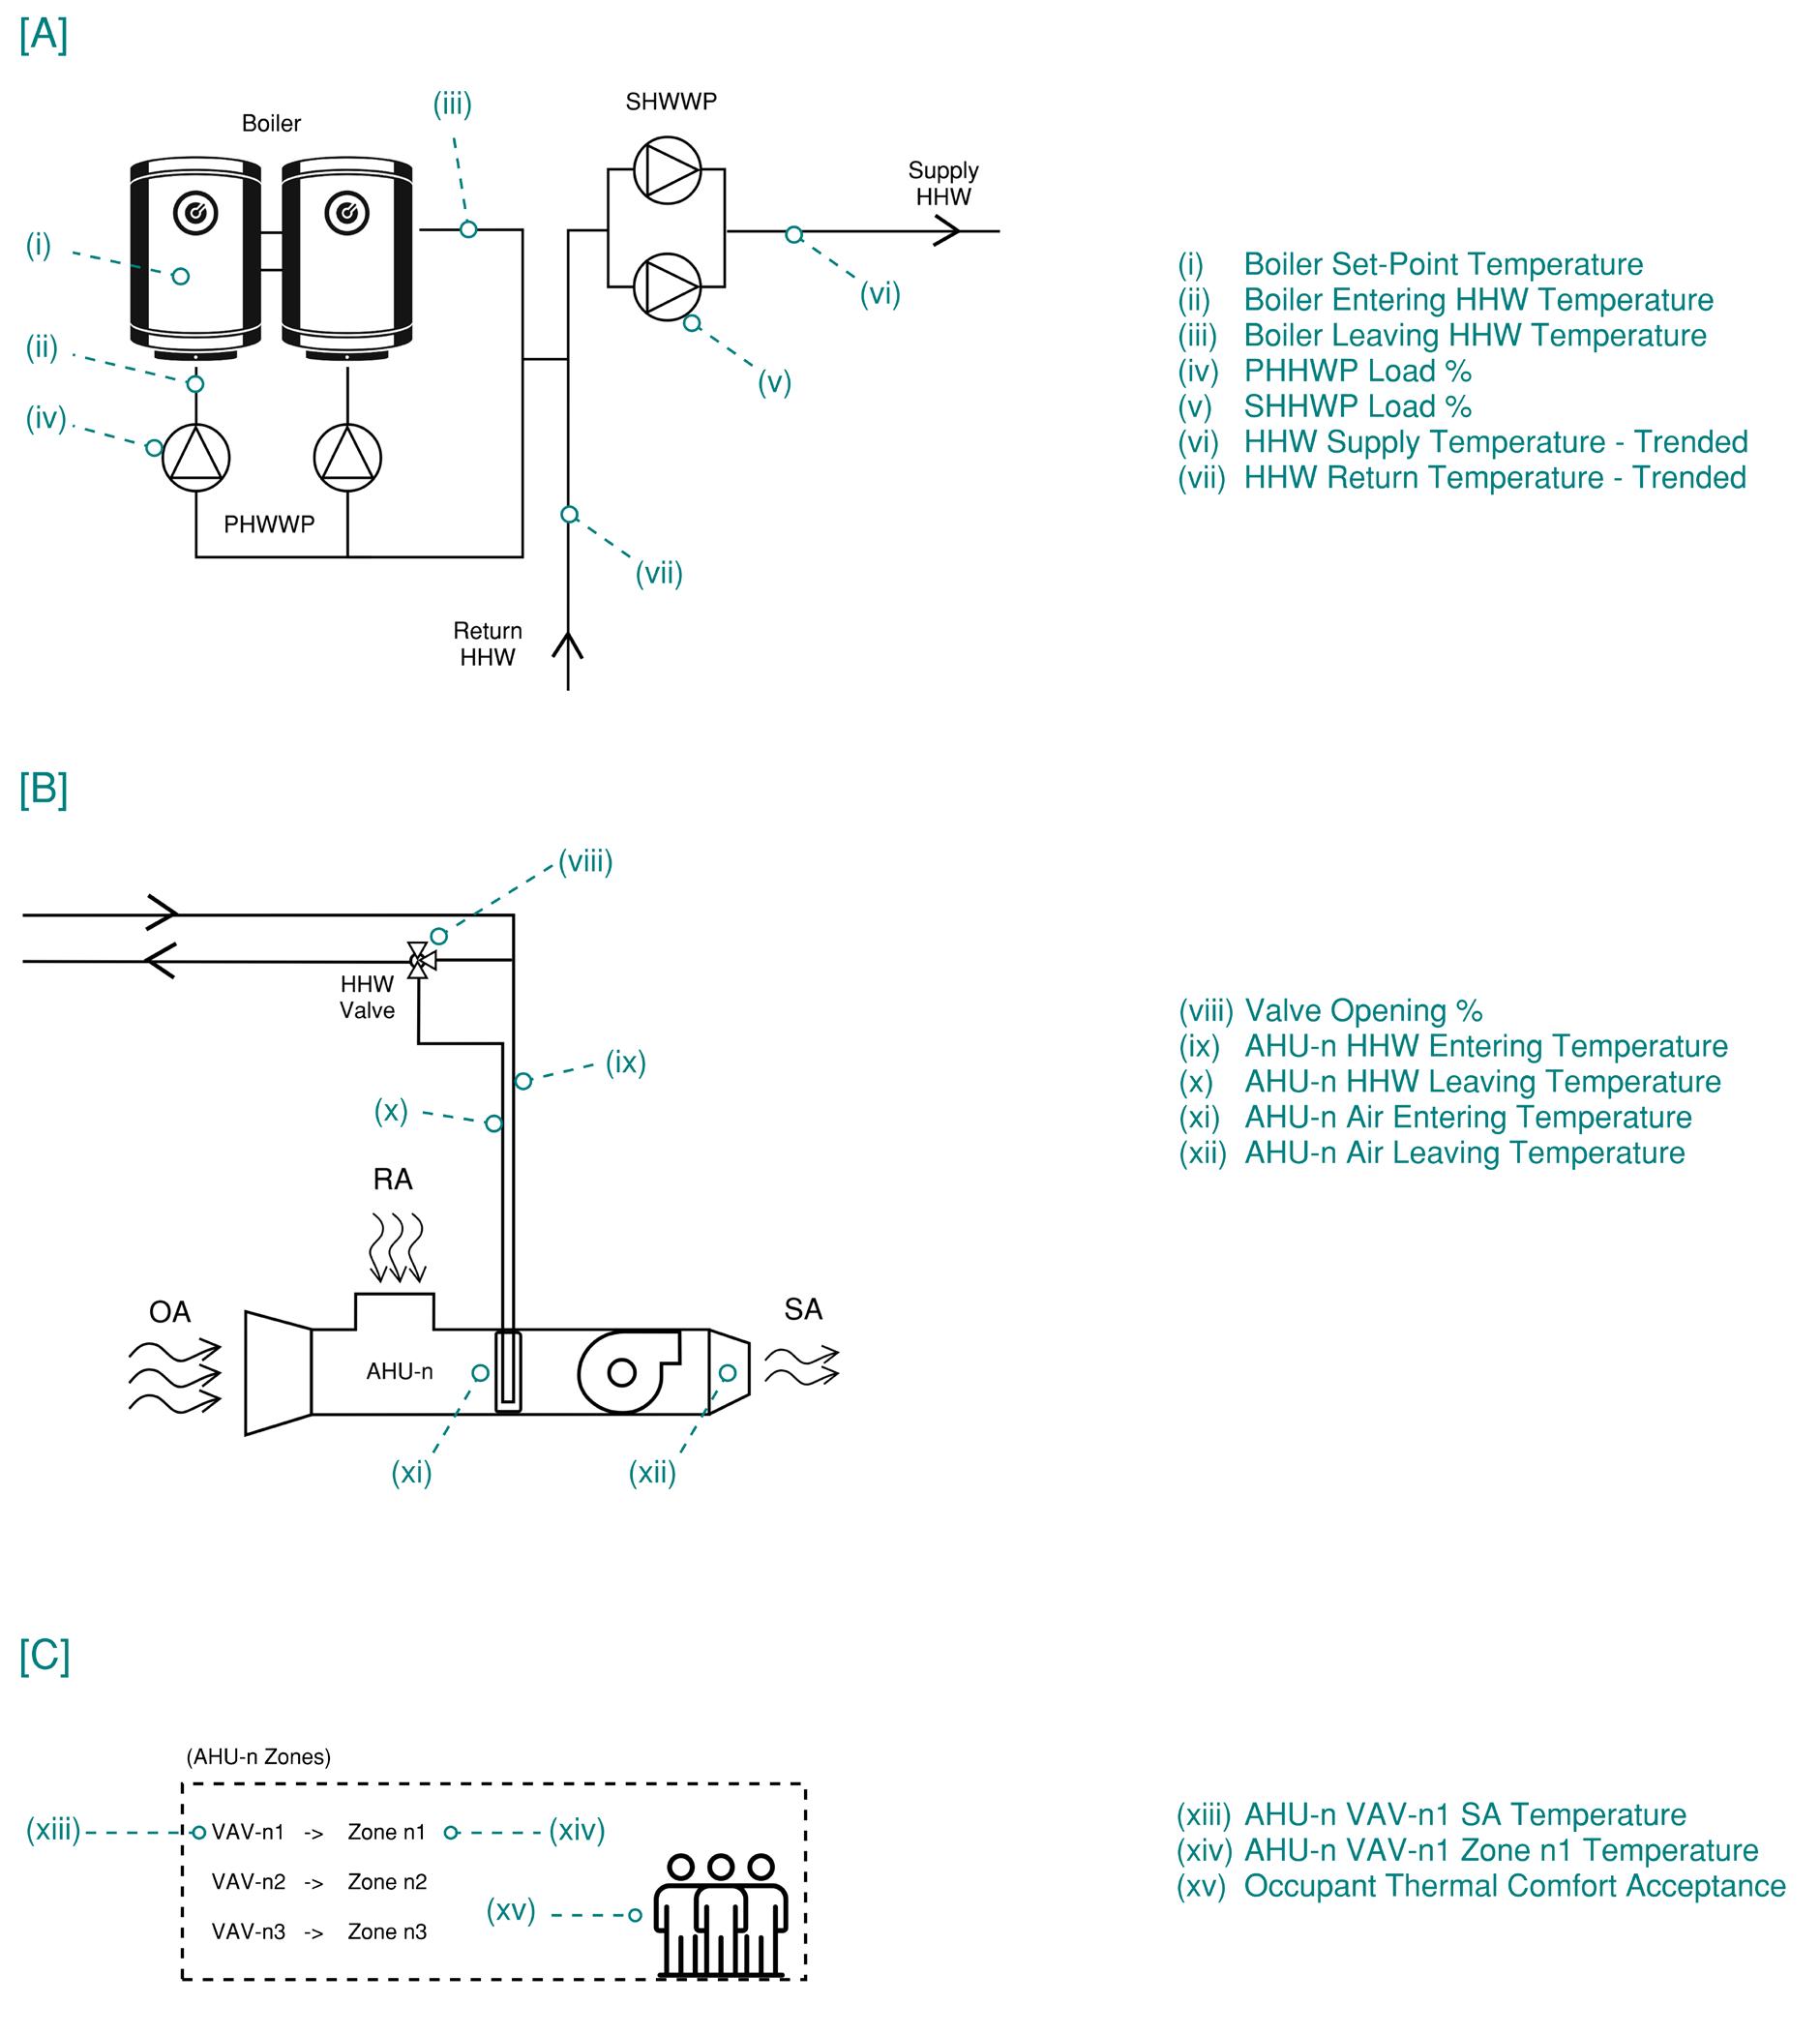
Figure 11: HHW Temperature Reduction Testing Regime Parameters
Appendix 4 – Detailed Testing methodology – example
This more detailed testing methodology focuses on making changes to the system and monitoring impacts to system components first as you work your way down to end points (i.e., zone temperatures). Problems in areas are diagnosed as you work through the system and this methodology requires greater effort and capabilities to implement. Time spend at each temperature iteration is longer for addition data and comfort assurance.
Working carefully with the mechanical services and controls provider(s) at site, a process should be developed to reduce the heating hot water temperature in steps. This should be planned in advance with system control point operation / availability checked and tested ahead of time. As an example, many boilers have manual set points and very simple (local) controls that cannot be configured/altered via BMS (i.e., if rollback is necessary) – these factors need to be considered in the testing / recovery plans
Testing overview;
- All testing should be done with a suitable ‘hyper care’ service level in place for monitoring and response to temperature issues, where system performance and expected areas of concern are proactively monitored.
- Hypercare is a short period after go-live when you provide extra resources and attention to support your users and business processes. Hypercare helps you make sure that your business can operate smoothly while addressing any initial issues or challenges with the new system
- Ensure personnel are onsite to monitor and respond to issues that may arise during testing
It is not recommended to try to administer this testing remotely.
- Using a system with 80°C flow water as an example, one might consider reducing this temperature in 5-10°C steps such as
- Month 1 – 70°C
- Month 2 – 65°C
- Month 3 - 60°C (etc)
55°C is a common temperature for HHW heat pumps and will provide numerous design options, carefully consider any need to test below this temperature.
- Noting, duration for testing at each temperature is dependant on both weather and system stability
Do not proceed to the next step if stability – i.e., ability to achieve and maintain suitable conditions/temperatures - under suitable ambient conditions has not been established.
Lack of stability or failure to achieve required temperatures may indicate ‘underheating’ which should be addressed prior to proceeding.
Methodology
A HHW Temperature Reduction Regime follows the following structure and decision tree:
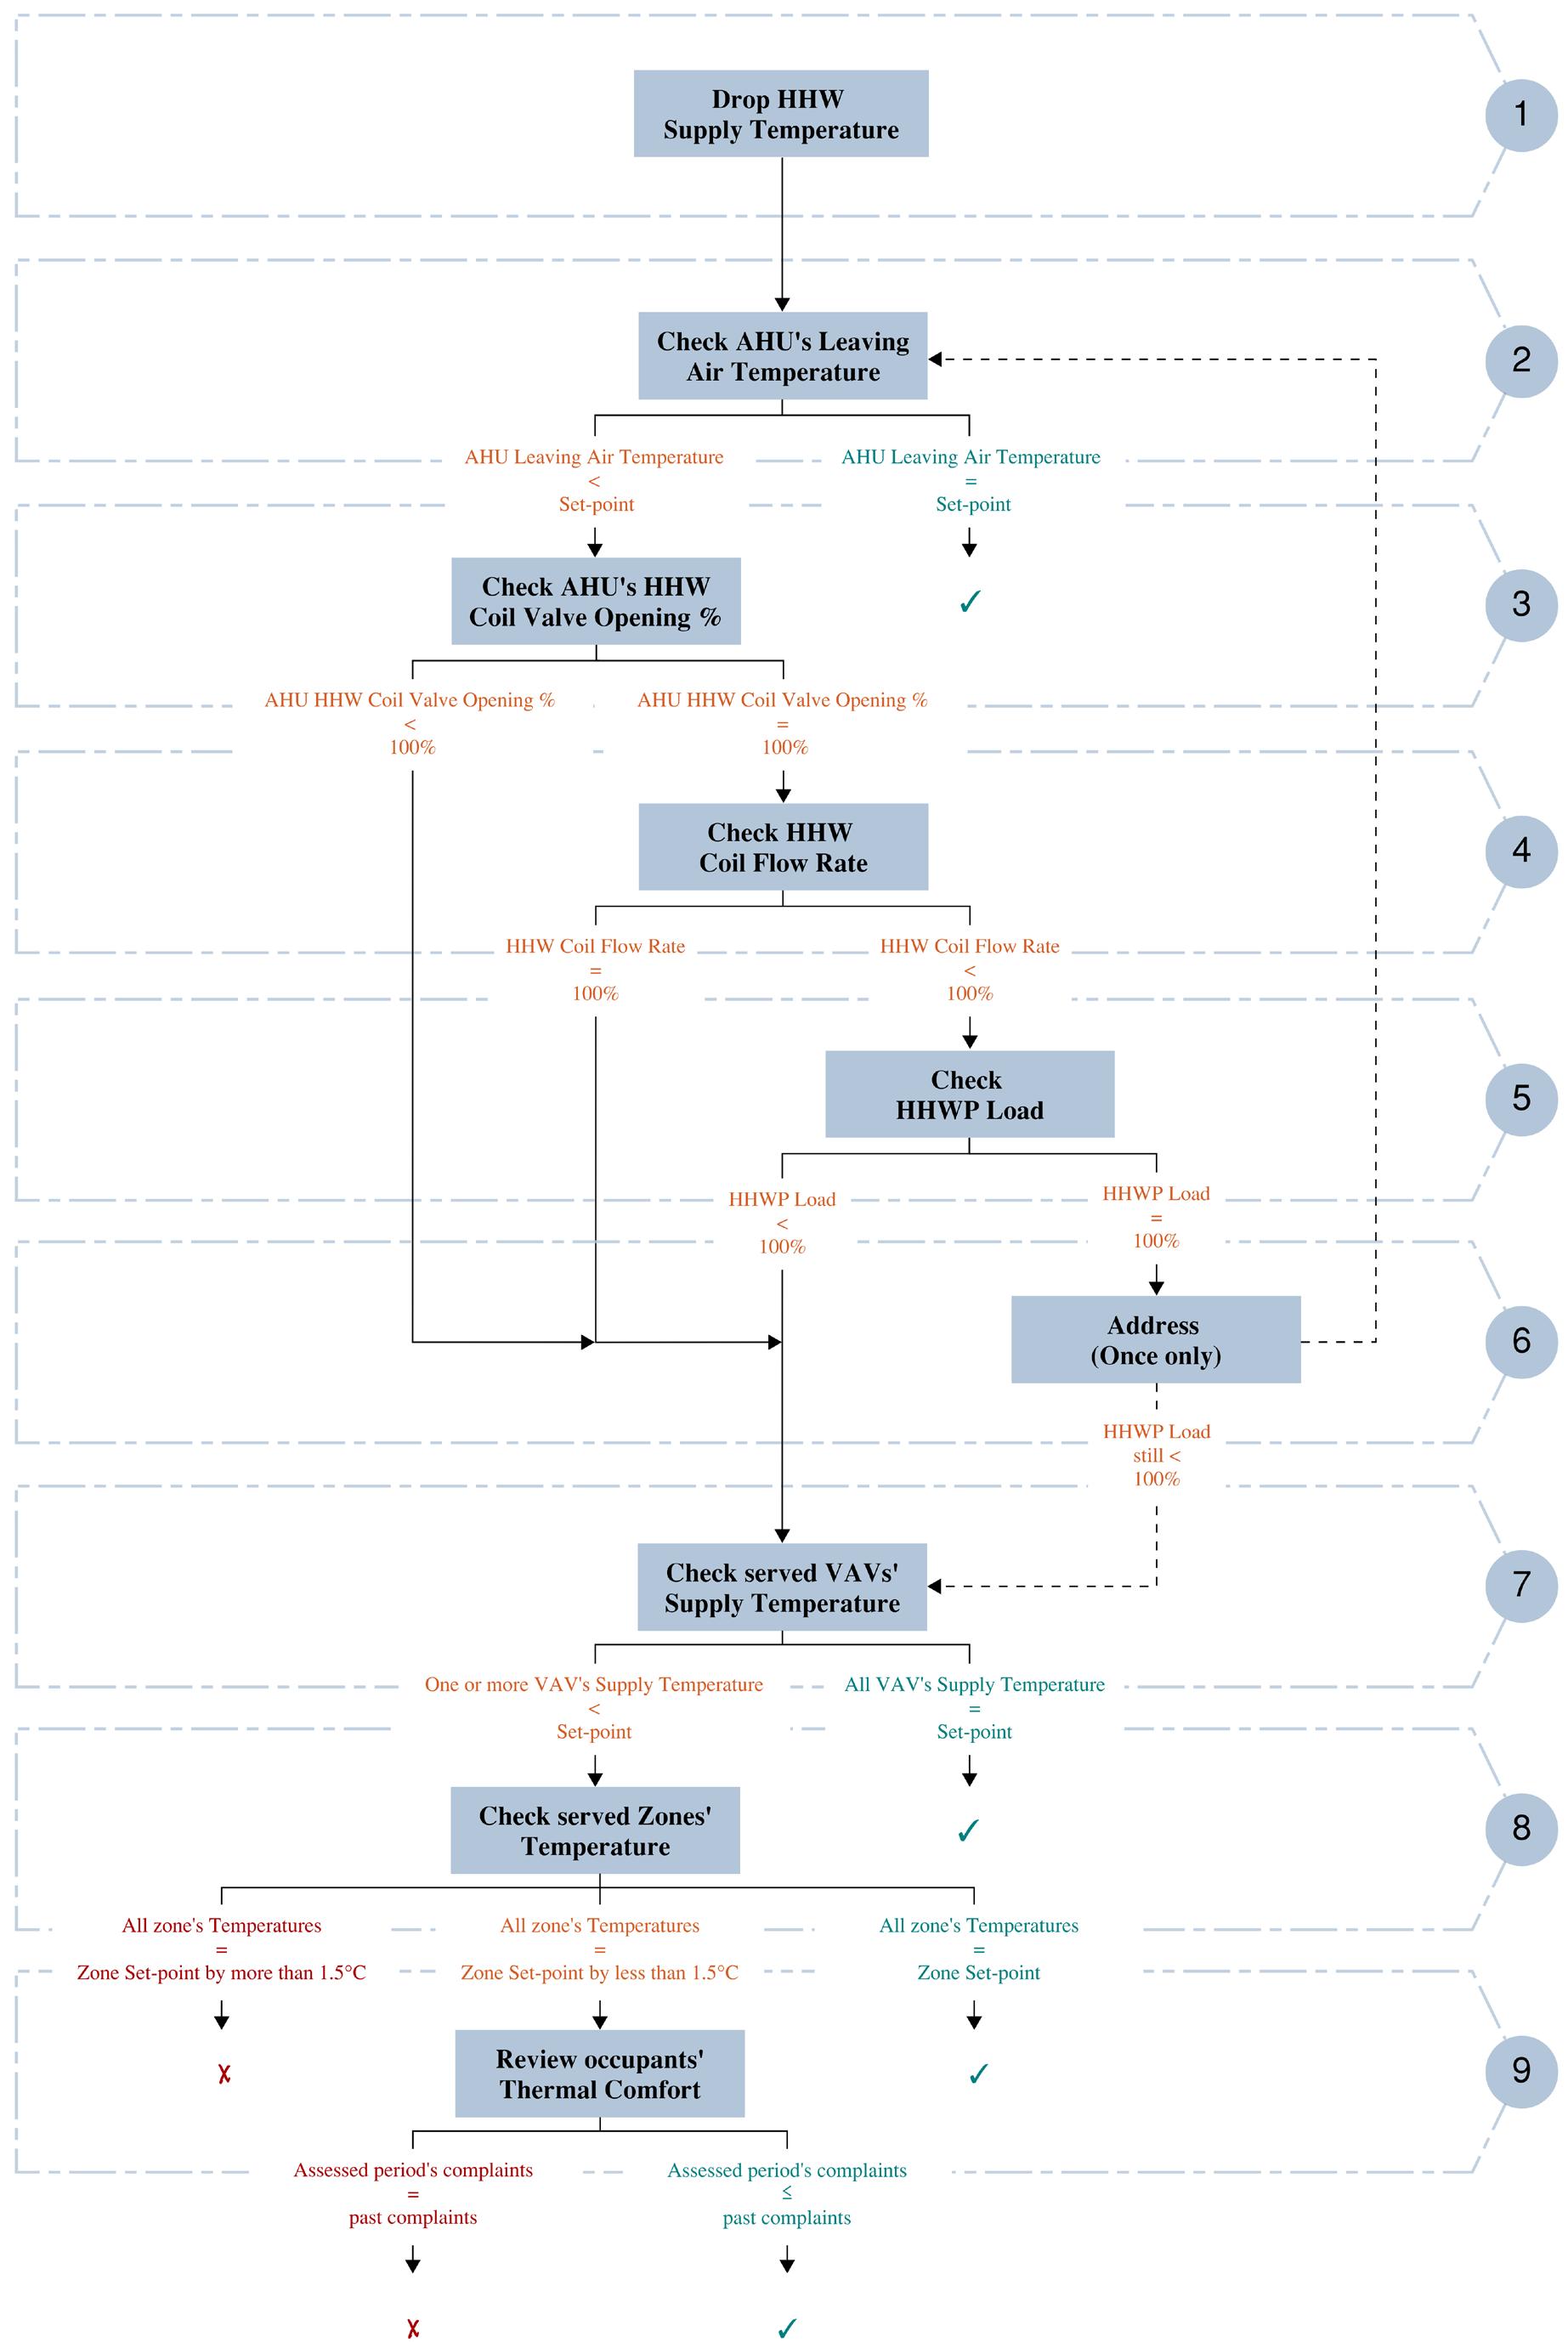
Figure 12: Detailed testing process flow diagram
Table 6: Detailed te sting methodology procedure. Step
Assessed Parameter (Appendix 3)
1a -
1b (i), (iii)
Ensure all data capture and logging is in place for this testing and the date/time is being recorded.
Lower boiler flow temperature to the chosen temperature and confirm correct operation of boiler
Start by reducing the HHW supply temperature by 5-10°C for one month. The size of the reduction (temperature) and the duration will be based on the site characteristics and risk appetite as discussed in earlier sections of this document.
Minimum 15-minute (or better) interval logging of all assessed parameters
Drop of operational HHW Supply Temperature
Facility Manager / Consultant
Confirm in place and operational
Facility Manager / Consultant
Adjust HHW set-point temperature and monitor associated HHW system parameters as advised from Step #2 onwards.
It should be noted that the heat load of a building fluctuates based on ambient conditions and occupancy. This regime can only work if localised heating (i.e. electric duct heating, under desk heating fan) are switched off. Hence, from step 2 onwards, parameters of HHW system should be assessed as an average as well as during peak conditions to aid with navigating with the advised decision tree of the HHW Temperature Reduction Regime above. Each assessment step typically yields one or more outcomes. To meet the criteria, the assessed parameters must achieve set-points or conditions ≥ 90% of the time within an error margin of ± 5%
For example, in Step #2, if an assessed AHU’s Leaving Air Temperature consistently achieves 26.3°C – 27.6°C (with a set-point of 27°C) for 96% of the time during heating conditions, the Leaving Air Temperature of the assessed AHU can be considered to meet the set-point condition.
Check AHU’s Leaving Air Temperature
2 (xii)
Upon dropping the HHW Supply Temperature, if the system has variable flow, the HHWP flowrate may increase to compensate for the reduced temperature and ensure adequate heat delivery.
AHU’s Leaving Air Temperature = Set-point
Facility Management
Record and assess other AHUs
Monitor site for complaints
3 (viii)
HHWP’s associated parameters should be logged as part of the assessment:
• HHWP (Primary & Secondary) Load
• HHWP (Secondary) flow rate
• HHW coil flow rate to each AHU
The Leaving Air Temperature from all AHUs impacts the zone temperature of the served areas within a building.
All zones served by the assessed AHU are unlikely to experience change in thermal comfort since the AHU Leaving Air Temperature’s set-point is achieved.
AHU’s Leaving Air Temperature
< Set-point
Facility Management
Move to Step #3
Zones served by the assessed AHU may experience a change in thermal comfort since the AHU Leaving Air Temperature’s set-point is not met.
Check AHU’s HHW Coil Valve Opening
Parameters associated to HHW Coils are reviewed at this step. The HHW coil valve's opening % indicates the necessary HHW flow rate at the set-point HHW Supply Temperature required to meet the heating demand at that specific moment.
AHU’s HHW Coil Valve Opening %
< 100%
This assumes that the required HHW flow rate within coils at the adjusted HHW Supply Temperature is achieved.
Facility Management
Move to Step #6
AHU’s HHW Coil Valve Opening % = 100%
Facility Management
Move to Step #4
4 (ix), (x)
Check AHU’s HHW Coil Flow Rate
At this stage, the AHU's HHW coil flow rate is assessed to determine whether sufficient heating can be delivered at the peak achievable HHW flow rate within the coils.
HHW Coil Valve calls for peak HHW flow rate within HHW coils to achieve required heating.
Coil Flow Rate
= 100%
If peak HHW coil flow rate is achieved with the AHU coil valve fully open at 100%, yet the AHU leaving air temperature remains below the set-point, this may indicate that the HHW coils in the assessed AHU are undersized for operations at lower HHW supply temperatures.
Coil Flow Rate
< 100%
If peak HHW coil flow rate is not achieved with the AHU coil valve fully open at 100%, this could indicate that the existing SHHWP isn’t sized to operate at the increased flow rate requirement as a result of HHW Supply Temperature reduction.
* Note that this condition is expected to arise only if there are preceding air handling units that have already been assessed. As the HHW loop progresses, the HHW supply temperature is expected to gradually decrease as heat is delivered to the air handling units. This may necessitate an increased HHW coil flow rate for all subsequent units due to the lower supply temperature. If the SHHWP (Secondary Hot Water Pump) is
Facility Management
Move to Step #7
Design Engineer & Implementation Team
Upon electrification, consider replacing the HHW coils within the assessed AHU with suitably sized HHW coils. Otherwise, if CHW coils exist, consider repurposed it as change-over HHW coils during heating.
Facility Management
Move to Step #5
HHW
HHW
sized to deliver a specific flow rate based on the initial HHW supply temperature (before testing was conducted), it may not be capable of providing the required higher flow rate at a lower supply temperature. If this issue was present before conducting the HHW supply temperature testing, it could indicate that the SHHWP was incorrectly sized from the outset.
HHWP Load
5 (iv), (v)
Check HHWP Load
• For systems equipped with both PHHWPs and SHHWPs, the focus should be on the SHHWPs.
• For systems without a primary loop and a secondary loop, the focus should be on the available HHWPs.
This condition assumes that all available field delivery HHWPs serving the assessed AHU are already operating at full capacity.
Facility Management
Move to Step #6
Design Engineer
Electrification of the HHW system may not necessarily come with replacement of the HHWPs. However, if increased flow rate is necessary, higher pump power may be required.
The HHWPs serving the assessed AHU are operating at 100% load. This indicates that the pumps have reached their peak capacity and are not sized to handle higher HHW flow rates.
HHWP Load < 100%
This condition assumes that all available field delivery HHWPs serving the assessed AHU are not operating at full capacity.
The design team needs to be aware that the existing HHWPs have already reached peak capacity. HHW pipework (diameter, pressure, etc.) needs to be assessed if accommodation of higher HHW flow rate is possible to better advise electrification strategy.
Facility Management
The following options should be considered:
• Work with a Mechanical Engineer to assess whether the HHW system can accommodate higher flow rates or operate at higher pressure with the same flow rate.
• If this is not feasible, the HHW temperature reduction regime may need to be halted at this point. Maintain the original set-point HHW Supply Temperature or the last successfully tested
The HHWPs serving the assessed AHU are operating at less than 100% load. This reduced load could be due to an error in the algorithm controlling the VSDs for the HHWPs, or there could be an issue with the system that requires further investigation.
HHW Supply Temperature upon electrification.
• If the HHW pipework can accommodate higher flow rates move to Step #5.
• Move to Step #6 if the above options are not desired or applicable.
6 (iv), (v)
Address HHWP Load issues troubleshooted from Step # 5
When HHWPs are operating at 100% (by design) but the pipework can accommodate increased flows the following options may be considered;
- Consider if it is possible to enable ‘standby’ pumps in parallel to increase flow to the field.
- Consider if changing pump impellors is possible to increase flow from the pumps.
This may help addressing the HHW system’s inability to deliver sufficient heating capacity at a lower HHW Supply Temperature.
HHW flow rate is expected to increase as a result of the changes.
Facility Management
(a) Engage a Controls Engineer to reprogram the HHWPs to operate in a lead/lag arrangement to enable higher flow rates, or, engage mechanical contractor to change pump impeller. Then, repeat Step #2 to Step #5
(b) If, during the second iteration of Step #4, the HHWP load is still less than 100%, proceed to Step #6.
7 (xiii)
Check served VAV’s Supply Temperature
Temperature of air leaving the VAVs directly impacts the temperature of the zones served by the VAVs.
All VAV’s Supply Temperature
= Set-point
Temperature of air leaving VAV is maintained at setpoint or doesn’t change and is stable under lower HHW temperatures.
One or more VAV’s Supply Temperature
< Set-point
Facility Management
Record and assess other AHUs
Monitor site for complaints
Facility Management
Prior to moving to Step #8, consider implementing Zone Temperature Optimization (if this isn’t yet implemented) that can reduce
8 (xiv)
Check served Zone’s Temperature
Temperature of air leaving VAV is underheated. Zones served by the assessed VAV may experience change in thermal comfort.
Zone temperature is the most reliable parameter to assess in determining if the reduction in HHW Supply Temperature affects the thermal comfort of the building occupants. If set-points are maintained, further reductions in HHW Supply Temperature can be tested. If the zone temperature is mildly impacted (i.e., slightly colder), the tested HHW Supply Temperature may still be acceptable, provided it falls within the zone set-point temperature range and is validated by occupant feedback – and – time to warm-up is acceptable. This ensures that even with a slight reduction in temperature, the overall comfort and satisfaction of the building occupants are preserved. All zone’s Temperature
Thermal comfort at zones served by the assessed AHU is maintained.
heating energy consumption and potentially heat loads by tailoring the heating needs of different zones within a building to their specific requirements. (See Appendix 1 for examples)
Facility Management
Record and assess other AHUs
Monitor site for complaints
One or more zone’s Temperature
< Zone Set-point by less than 1.5oC
Facility Management
Move to Step #9
Temperature of some zones served by the assessed AHU is at the colder end of the zone comfortable temperature range.
One or more zone’s Temperature < Zone Set-point by more than 1.5oC
Temperature of some zones served by the assessed AHU is underheated.
Facility Management
Discontinue HHW Supply Temperature
Reduction Testing and adjust the HHW Supply
Temperature back to either the original HHW set-point temperature or the last successfully tested HHW Supply Temperature, whichever is lower.
(xv)
Review occupants’ Thermal Comfort
Step #1 to Step #8 aim to address and track various parameters of the HHW system that are expected to change upon reducing the HHW Supply Temperature. While these parameters may indeed vary due to the testing, the ultimate measure of success is the building occupants' perception of thermal comfort. This perception determines whether the building has experienced "underheating" as a result of the temperature reduction. It is possible that the slightly lower zone temperatures achieved during the testing may actually align with the occupants' comfort preferences, revealing that previous settings may have resulted in "overheating" that went unnoticed.
Assess period’s complaints ≤ Past complaints
Consider options to address underheating issues per Appendix 1.
Facility Management
Record and assess other AHUs
Monitor site for complaints
Thermal comfort of the areas served by the AHU is maintained based on the occupants.
Assess period’s complaints
> Past complaints
Thermal comfort of the areas served by the AHU is compromised based on the occupants.
Facility Management
Discontinue HHW Supply Temperature
Reduction Testing and adjust the HHW Supply Temperature back to either the original HHW set-point temperature or the last successfully tested HHW Supply Temperature, whichever is lower.
Consider options to address underheating issues per Appendix 1.