

1.1 Introduction
A2EP in conjunction with the heat pump industry has been conducting a number of forums for end users and service providers to raise awareness of the opportunity for heat pumps to help Australia meet its climate and energy efficiency goals. One observation from these forums has been the need to reiterate the importance of metering for project success.
While metering is an additional cost to a project, it is recognised as critical for all parties to demonstrate outcomes, provide the basis of claiming money from grants and energy efficiency certificates, capture learnings, and help drive continuous improvements.
Northmore Gordon was engaged by A2EP to prepare a fact sheet on the importance of measurement and verification for heat pump projects, to
• Raise awareness within end users and service providers for the need for metering and measurement and verification plans as part of the project design.
• Enable end users and service providers to monitor results.
• Encourage on-going monitoring services including maintenance and optimisation of heat pump technology.
• Encourage investment in innovation and best practices in the heat pump industry.
1.2 Heat pump process
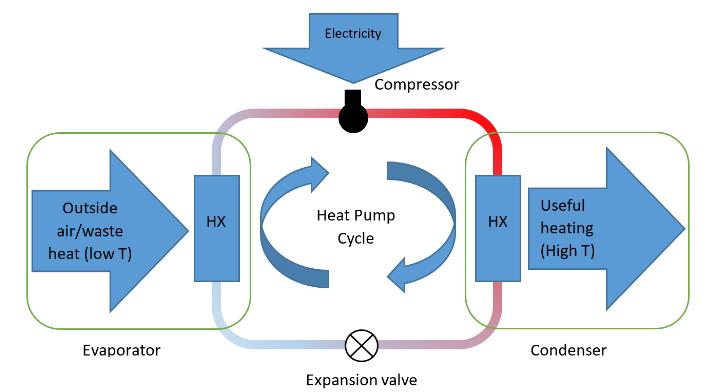
An electric heat pump is a device designed to heat water or other fluids and gases using the principles of refrigeration in reverse Heat pumps use electricity to transfer heat from the surrounding air or another heat source to the water or other fluid, making them significantly more efficient than direct heating.

1 https://automaticheating.com.au/complete-guide-to-heat-pumps/heat-pumps-explained/

1.3 Measurement & Verification process
Without proper metering and subsequent M&V it is not possible to accurately evaluate the outcome of the project or to create revenue from the various certificate schemes.
“Measurement and Verification” (M&V) is the process of planning, measuring, collecting and analysing data for the purpose of verifying and reporting energy savings
Savings cannot be directly measured, since they represent the absence of energy use. Instead, savings are determined by comparing measured use before and after implementation of a project The M&V process also considers independent variables such as production, ambient temperature, water flows etc. The exact variables depend on the individual scenario.
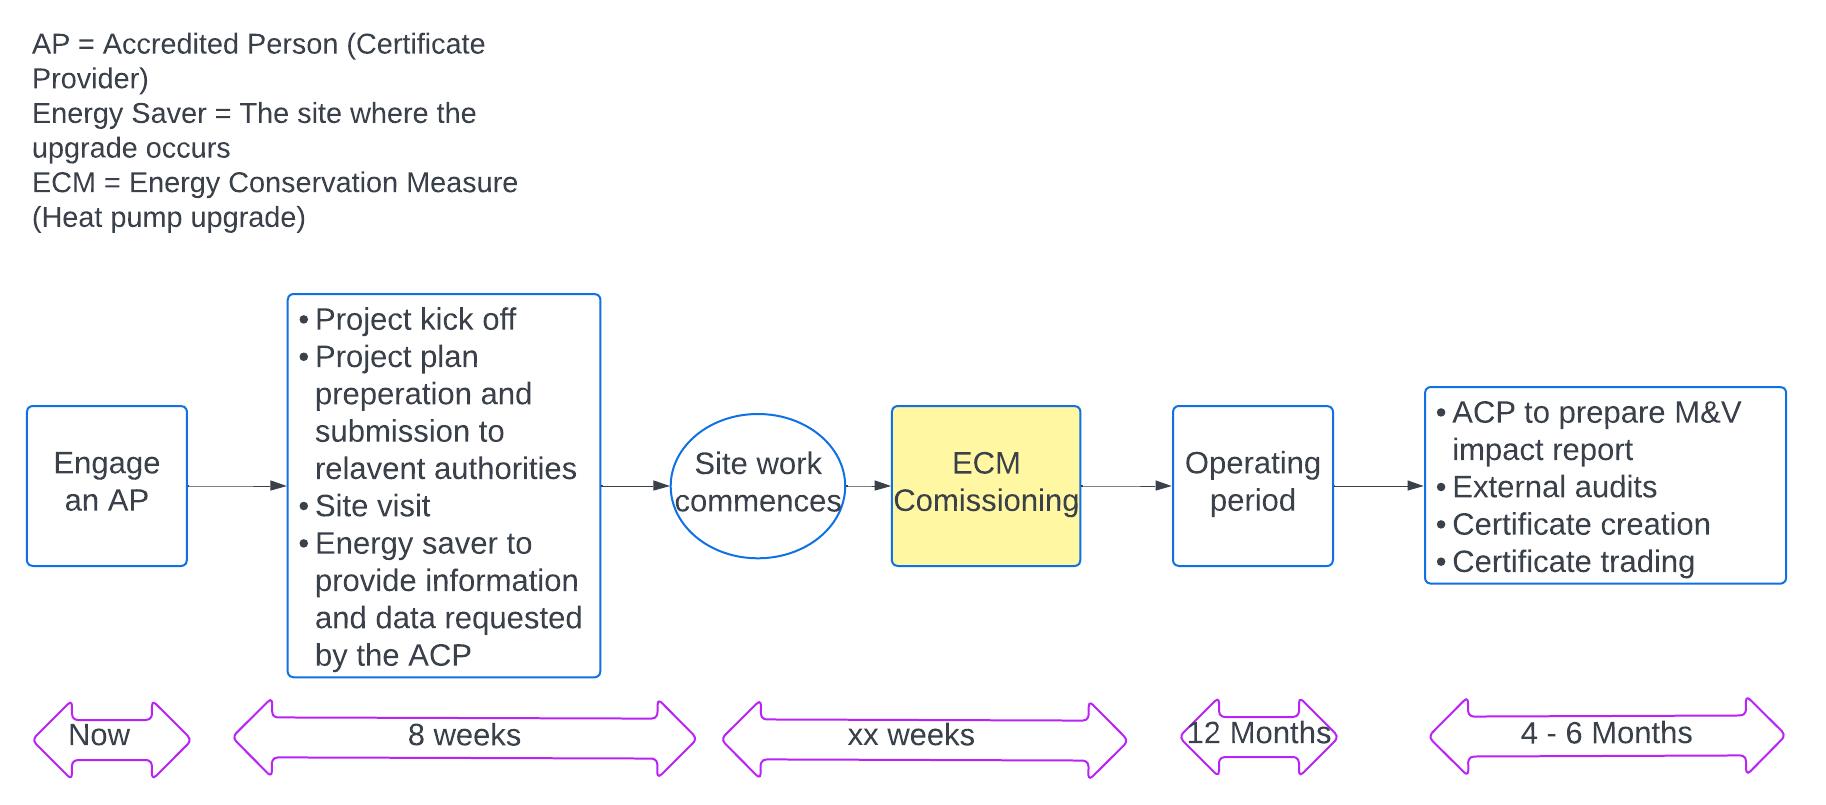
The Project Based Activities (PBA) scheme in VIC and Energy Savings Scheme in NSW use the M&V process to measure and quantify energy savings from complex energy efficiency projects. An indicative timeline for M&V is in Figure 2

Generation of Australian Carbon Credit Units (ACCUs) for electrification projects is technically feasible, however it is unlikely that a project which replaces hot water boilers with heat pumps would generate a sufficient net carbon emissions reduction to make an ACCU project viable
Generally, a minimum of 2,000 tonnes of annual abatement is required to make an ACCU project viable, due to the administrative costs associated with the ACCU generation process.
Figure 3 shows the indicative average thermal demand of the existing boiler and the efficiency gain with the heat pump needed to generate 2,000 tonnes or more of annual abatement


Figure 3: ACCU project feasibility for replacing hot water boilers with heat pumps.
1.4 Data requirements for M&V and certificate creation
Data requirements
Baseline energy use (Before upgrade)
Data frequency Description
Natural gas use 24 hour interval data for 1 year2
Operating energy use (after upgrade)
Electricity use 24 hour interval data for 1 year 2
Natural gas use 24 hour interval data for 1 year
Utility gas meter data, if boilers consumed a significant proportion (<50%) of site use (e.g, aquatic centres and commercial buildings)
Sub metered gas use data of the boilers if boiler consumption is relatively small (e.g, complex industrial sites)
Utility electricity meter data. This can be obtained from the electricity retailer / distributor.
Utility gas meter data
Sub metered gas use data
2 If less than 1 year is available, this might impact the number of certificates which can be created
Electricity use 24 hour interval data for 1 year

Utility electricity meter data, if heat pumps are expected to consume a significant proportion (<50%) of site use (e.g, aquatic centres and commercial buildings)
Sub metered electricity use data of the heat pumps if expected use is relatively small (e.g, complex industrial sites)
*Metering is not needed for certificate creation under deemed methods (domestic and smaller commercial heat pump upgrades)
1.5 Basic principles of metering and monitoring for heat pump projects
D ata captur e
Site level natural gas and electricity data is available from the site’s retailer. The site can choose to sign a Letter of Authority (LOA) which would enable the Accredited Person (AP) to request meter data on their behalf.
Sub-metered natural gas, electricity & other independent variable data need to be captured and recorded in a site’s existing BMS or SCADA systems, with data available in reasonable time intervals (30 minute / hourly) If the site does not have a BMS or SCADA system, an Energy Management & Monitoring System would need to be established to gather and store the necessary data
Data s torage
Sub-metered data which is accessed via a site’s BMS or SCADA systems needs to be saved in a data historian (database). The data historian should store the measured data of the relevant parameters for a minimum of 1 year before the start of the commissioning of the heat pump upgrade This is because the certificate application will need to include natural gas consumption data of the boiler, typically for a minimum of one year prior to commissioning, to maximise the number of certificates which can be created The reason for this is that typically regulators require demonstration of a full operating cycle for the site before and after the upgrade, which for most seasonally dependent processes means a full year. This also applies to independent variables such as production (for manufacturing), ambient temperature, daily employee attendance data (in commercial built environment projects).
Independent variables
Independent variables refer to measurable factors which have a statistically significant impact on energy consumption or energy productivity. These variables are measured during the M&V process, before and after the upgrade, to assess their influence on the dependent variables.
The specific independent variables used in M&V can vary depending on the project, the system or process being evaluated, and the objectives of the analysis.
Examples for independent variables
• Abattoirs – Production related statistics such as kill numbers, tonnes Hot Standard Carcass Weight (HSCW), kL town water supply
• Commercial building – Occupancy data, ambient weather conditions

• Aquatic centre – Ambient temperature, relative humidity, daily attendance
• Dairy – kL of milk production, ambient weather conditions
Dependent variables
Dependent variables, also known as response variables or outputs, are the variables that are measured and observed for the purpose of modelling. They are the variables that are believed to be influenced or affected by the independent variables, and their values depend on or vary based on the values of the independent variables.
Dependent variables are typically electricity or gas consumption for a given model (either natural gas or LPG), but can include other energy sources
Data analysis (including baselining)
The organisation accredited with creating certificates on behalf of the energy consumer for the relevant certificate program is responsible for the data analysis and preparing and submitting the certificate creation application to the relevant regulator. They will create a baseline energy model (before the upgrade) and an operating energy model (after the upgrade) using statistical methods which are then used to calculate the modelled energy savings in a typical year from the heat pump upgrade. These savings are reported at a level of relative precision, which is dependent on several factors, including the precision of metering used, and on how well the independent variables explain changes in energy consumption
1.6 Benefits of metering to drive project success
Unless site level energy consumption data can be used in the M&V process, it is important to ensure that proper submetering is installed in the existing boiler system and the new heat pump for the success of the M&V project, so that the impact of the upgrade can be clearly demonstrated in the data Submetering provides the following benefits,
• Investment in submetering enables the M&V process and subsequently the certificate generation Investing in suitable accuracy class meters ensures that the error in the measurement and verification process is minimal This ensures the business case is as accurate as possible and maximises the potential revenue from the certificates created
• The revenue from the environmental certificates will most likely outweigh the additional cost for metering and data storage
• Submetering will provide more visibility of the sites energy use and assist in the identification of focus areas for efficiency and productivity improvements
• Metering will enable assessment of the performance/efficiency of the heat pump/boiler.
1.7 Thermal load data capture guidance
In addition to metering for the M&V of heat pump projects, it is advised to measure the thermal output of the heat pump and the thermal demand of the system for which it is generating heat. The measurement of thermal output is the amount of heat supplied to the water or other fluid This enables calculation of the efficiency of the unit (output vs input) This is calculated by determining how much energy has been transferred by the heat pump (or consumed by the heating process), according to:
Equation 1

Where:
���� is the heat transferred in or out of the system in kWth (kW-thermal)
���� is the flowrate of water (or other fluid) in kg/s
����2 is the temperature of hot water leaving the heat pump or entering the heating process in °C
����1 is the temperature of cool water entering the heat pump or leaving the heating process in °C
It is important to record and store this measured data in a historian with date and timestamps for extended periods as it will enable analysis of thermal storage requirements, as part of the business case development. Proper understanding of the site’s thermal loads by time of day also assists when establishing renewable electricity procurement contracts, from an emissions perspective.
Typical boilers have a thermal efficiency of ≈ 80%, (i.e. 1 unit of natural gas used in a gas fired boiler provides about 0.8 units of thermal energy to heat up the water) whereas for electric heat pumps, the efficiency, also known as Coefficient of Performance (COP), is about 300% to 400% (i.e 1 unit of electricity used in a heat pump provides about 3 to 4 units of thermal energy to heat up the water).
The COP can be calculated using the following equation:
Equation 2
Where:
���� is the heat transferred into or out of the system (as per Equation 1) in kWth ������������ is the electrical power supplied to the heat pump in kWe (kW electrical)
The following diagrams show the necessary metering parameters to calculate thermal energy supply from the heat pump, along with the thermal energy used by the system With the in and out temperatures and the total flow, the thermal energy is easily calculated. It is recommended that the thermal energy used by the system is metered prior to installing a heat pump, as this will provide key thermal energy demand profile information such as average and peak heating requirements, which will in turn allow correct sizing of the equipment and any thermal storage to optimise capital costs and performance.
For the measurement of flows in the diagrams below, Electromagnetic flow meters are the most suitable as they are cost effective. Temperatures can be measured with standard Immersion Temperature sensors.
1.7.1 Simple heat pump
Figure 4 shows a single heat pump set up. In this option, the thermal energy supplied by the heat pump and the thermal energy used by the system is the same, calculated using F1 and the difference between T1 and T2.


Figure 4: Thermal energy metering requirements for a single heat pump option
1.7.2 Commercial building
Figure 5 shows an example hot water distribution system at a commercial building. In this scenario, the amount of water consumed by all users is calculated by taking the difference between F2 and F1. In an ideal situation, all individual users of hot water would be metered, however this is often not practical due to cost. The thermal energy used by the system is based on the difference between F1 and F2 (the volume of water used) and T2 and T3 (the decrease in temperature of the hot water ring main). Again, the thermal energy supplied by the heat pump is calculated using F1, T1 and T2.

Figure 5: Suggested thermal energy metering for a multiple heat pump ring main e.g. for a commercial building
1.7.3 Abattoir
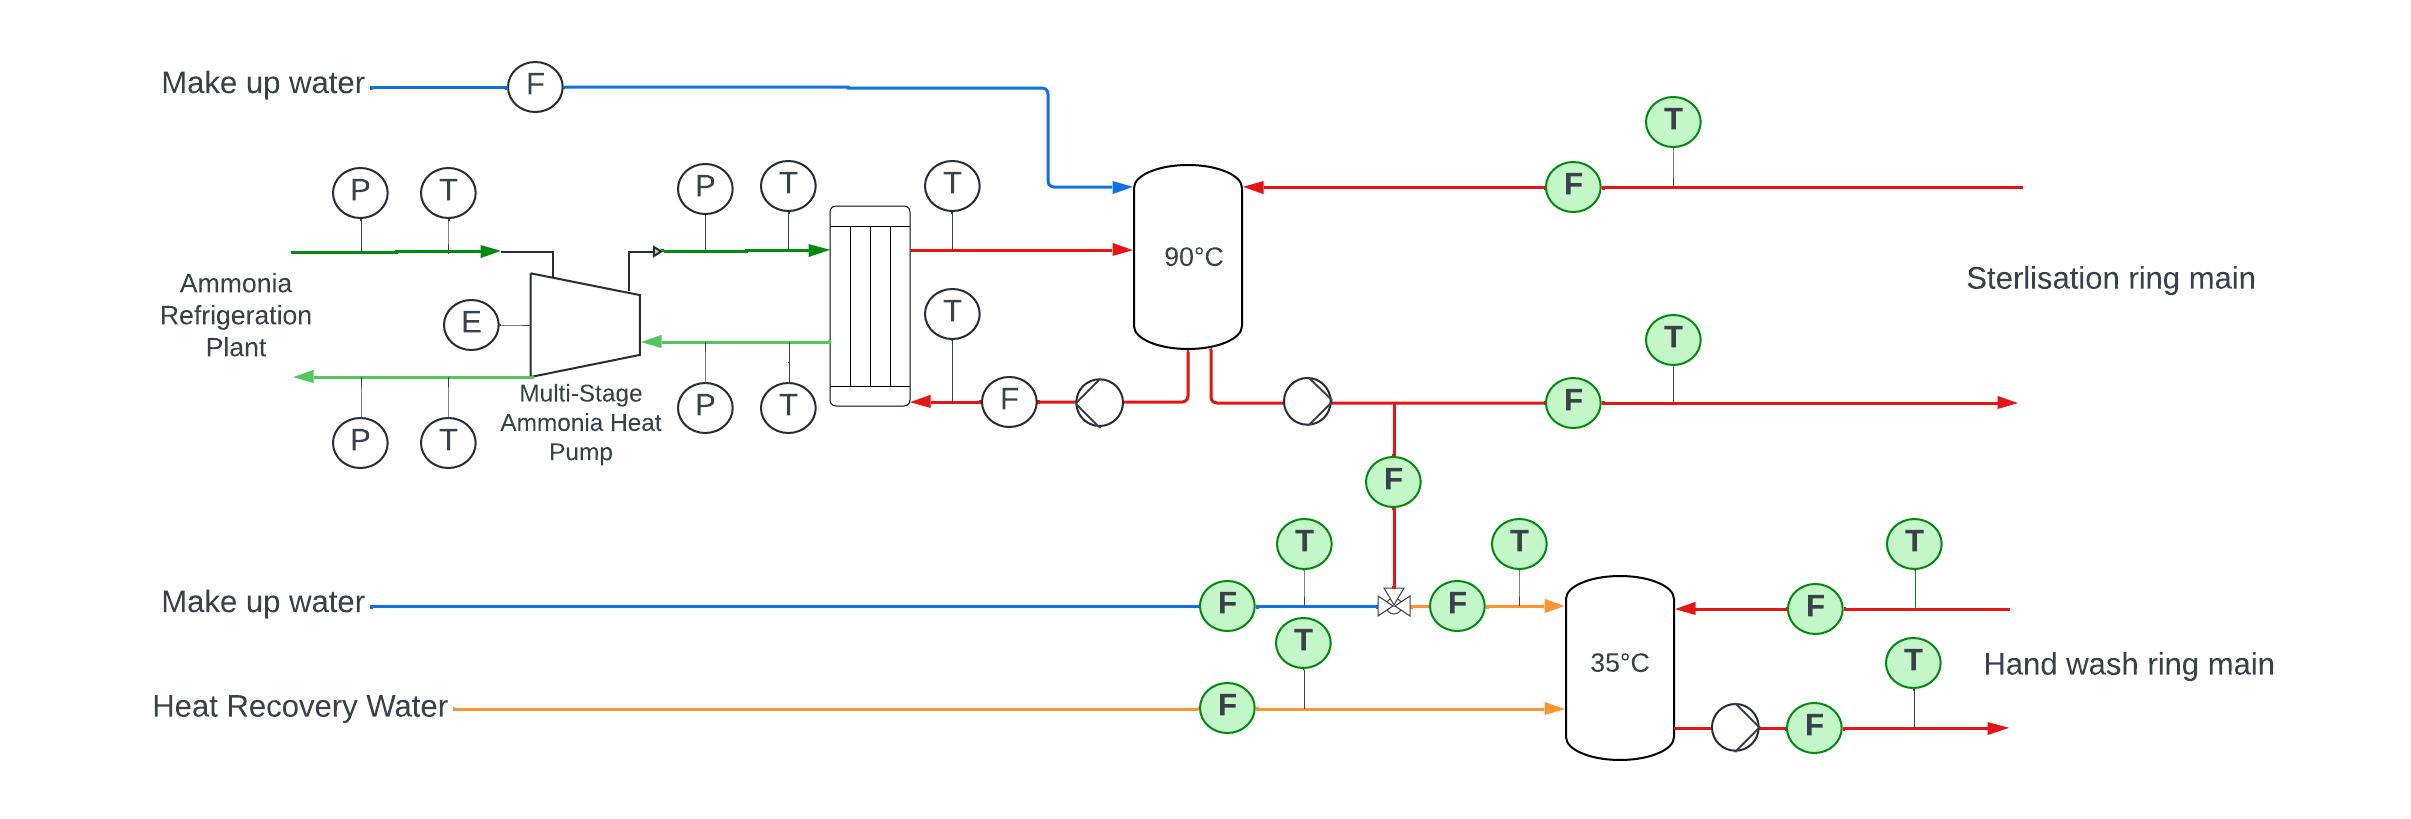
Hot water distribution system layout and the thermal measurement locations can differ based on the facility type, and can be more complex depending on the process. An example of a hot water distribution system at an Abattoir which uses heat rejection from an Ammonia refrigeration system in an heat pump to produce hot water is in Figure 6.
Ideally, it would be better to measure all flows, temperatures and pressures in the ammonia refrigeration circuits as this would enable a better understanding of the heat recovery and hot water generation process. However, if it is only necessary to identify the thermal load from hot water, then the measurement of flows and temperatures marked as F and T with green background colour is sufficient.


6: An example of a heat pump hot water distribution system at an abattoir
1.7.4 Aquatic Centre
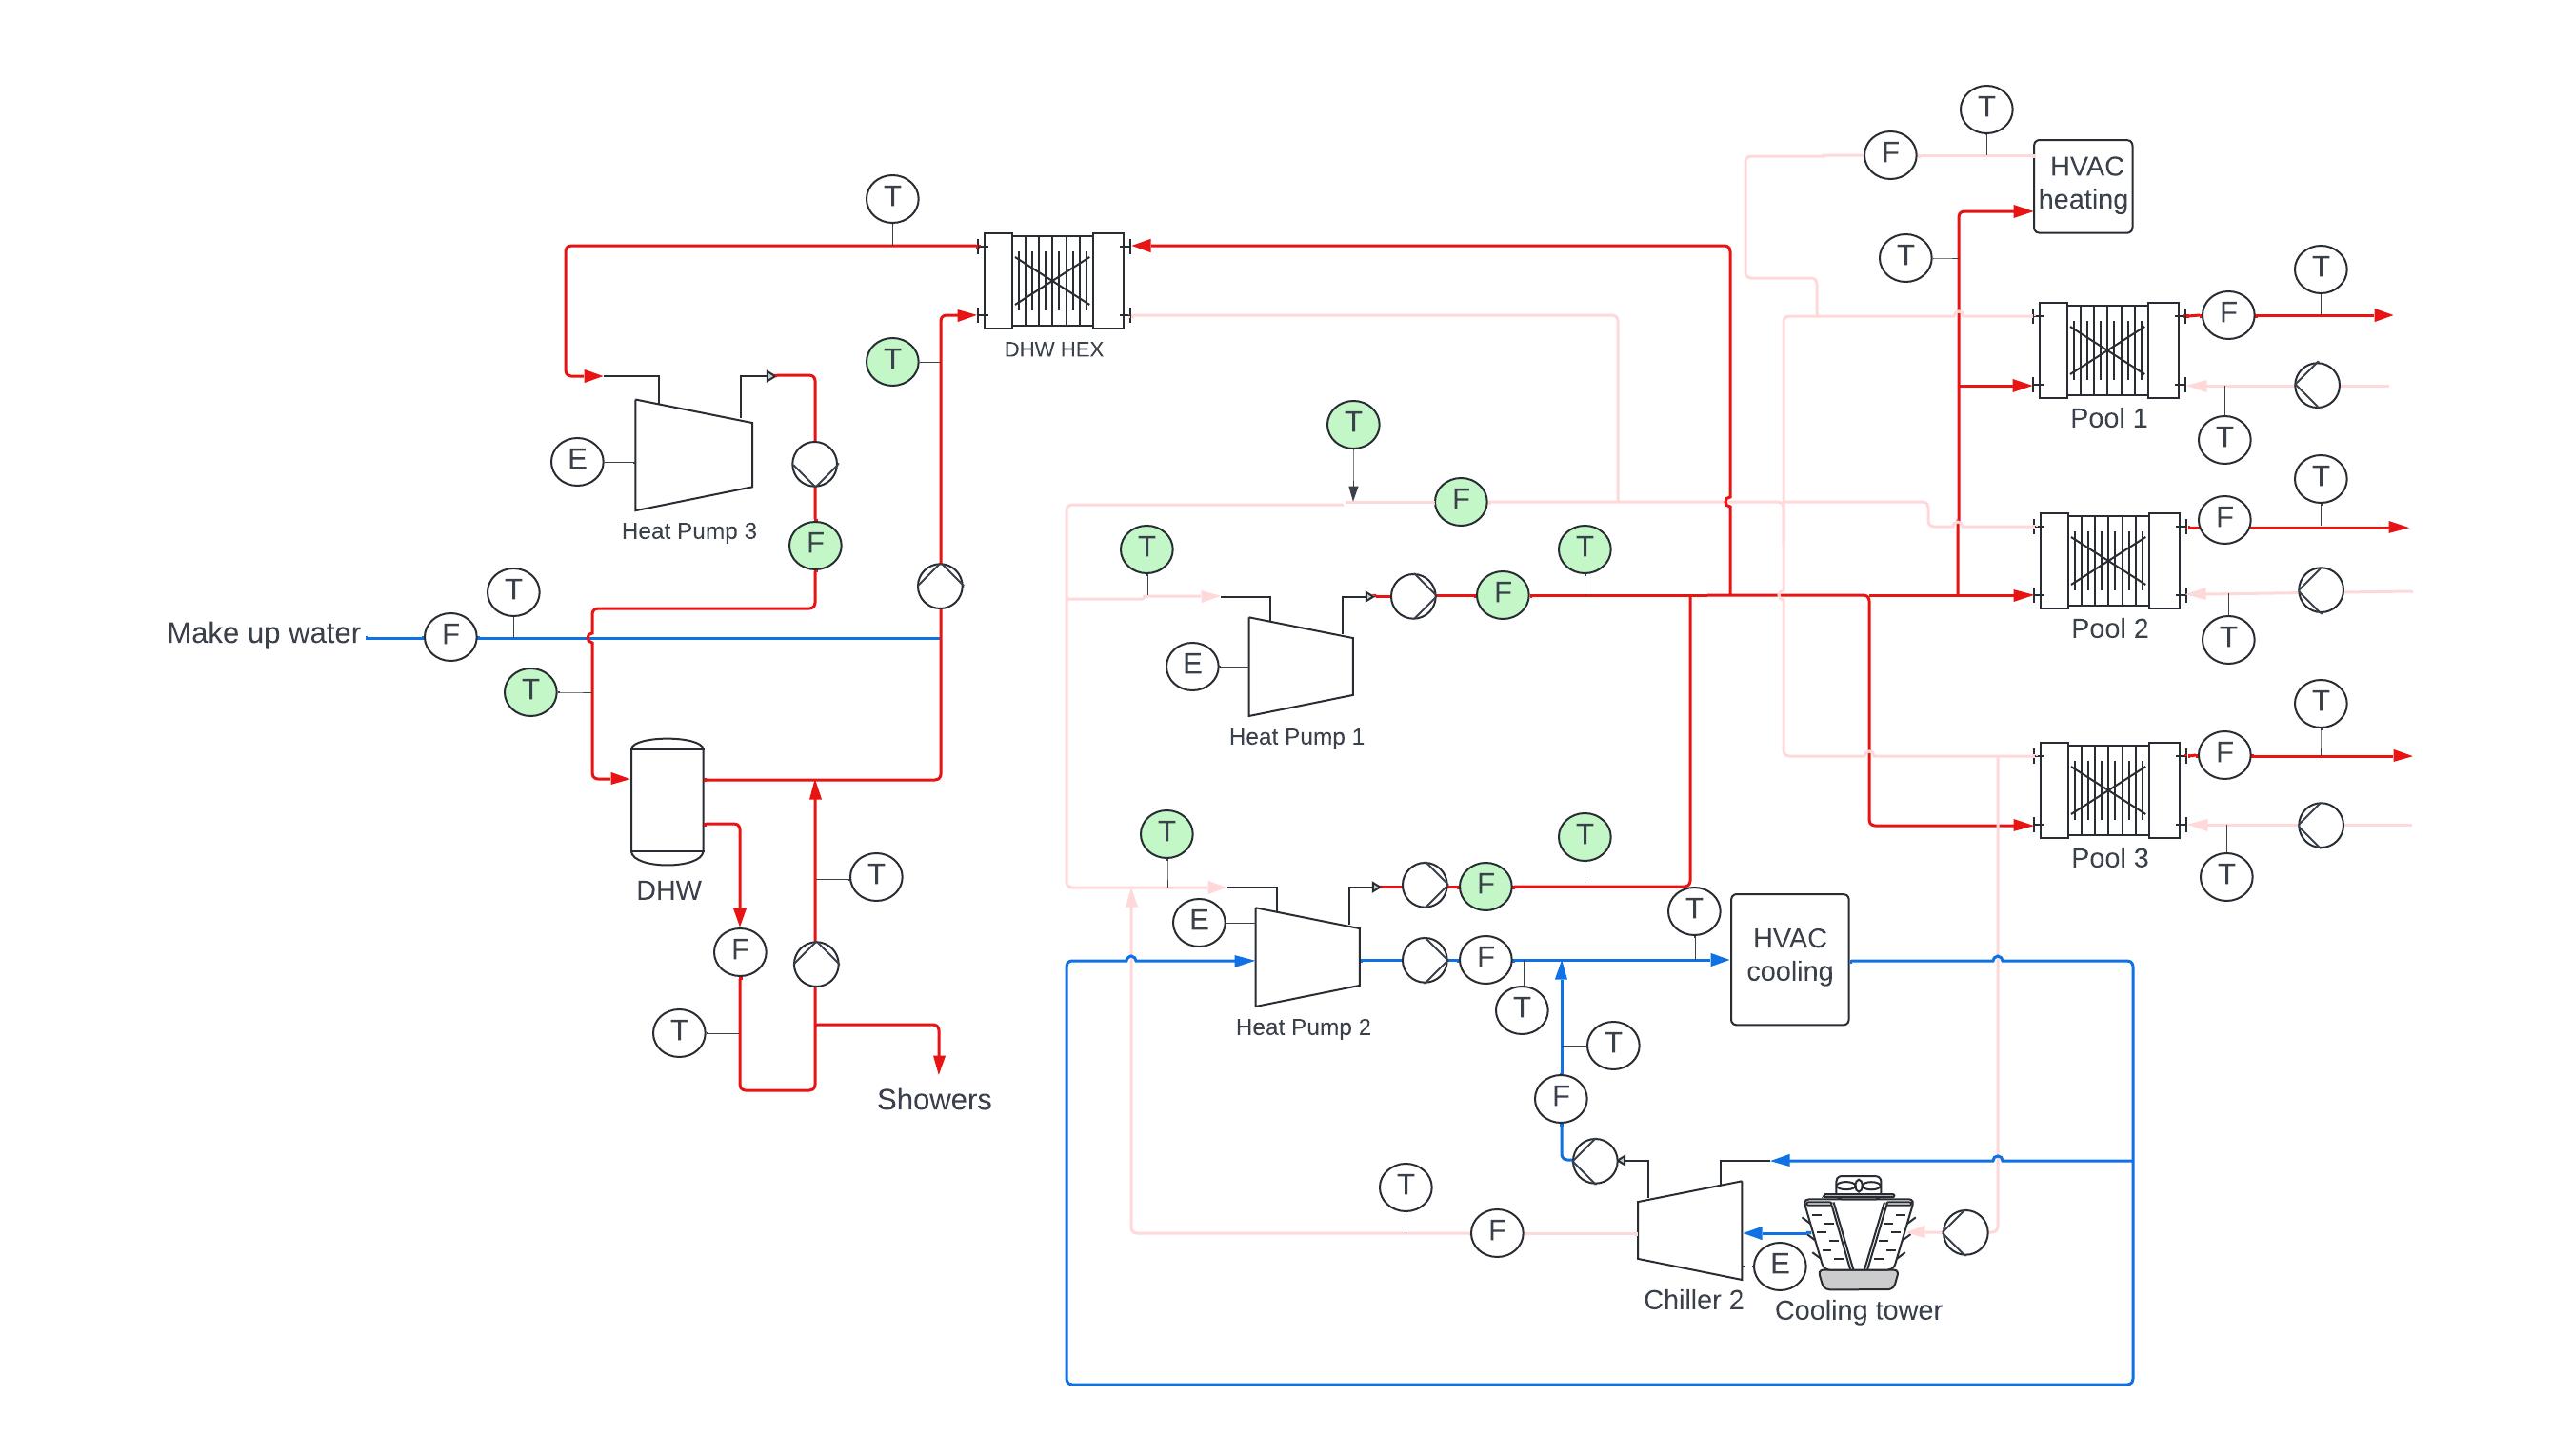
Figure 7 shows an example of a hot water distribution system at an Aquatic Centre. The main hot water distribution system has a standard heat pump (Heat pump 1) producing hot water and a multi-pipe heat pump (Heat pump 2) which is capable of producing both hot and chilled water There is a separate heat pump (Heat pump 3) supplying hot water to the Domestic Hot Water system.
As previously mentioned, the measurement of all flows and temperatures marked in the diagram would enable the identification of thermal load from each end user. However, by measuring the flow and temperature at the locations marked in green would be sufficient to calculate the total thermal demand for hot water generation.

Figure 7: An example of a heat pump hot water distribution system at an aquatic centre

1.8 Risks and Challenges when metering heat pumps
Energy use – Measurement and storage of electricity consumption and gas flow data requires meters with appropriate accuracy class, communications with site’s PLCs, trending in SCADA/BMS and storage in a database Meters must record measured energy consumption; for example, electricity meters must be real power meters recording kWh rather than voltage or current.
Missing data – If there is a problem with the data measurement or storage it can impact the reliability of the business case, eligibility under the certificate schemes or reduce the number of certificates created. When preparing for the project, ensure that the communications from the meters to the SCADA system and database is working, and that timestamps are stored and correct by viewing the meter tags within the SCADA system This should be part of the commissioning process for new meters. Ideally there would be an alert set up within the SCADA system to notify when data is not being recorded.

