5 minute read
6.3.2 BESS and D-PV Volt-VAr curves
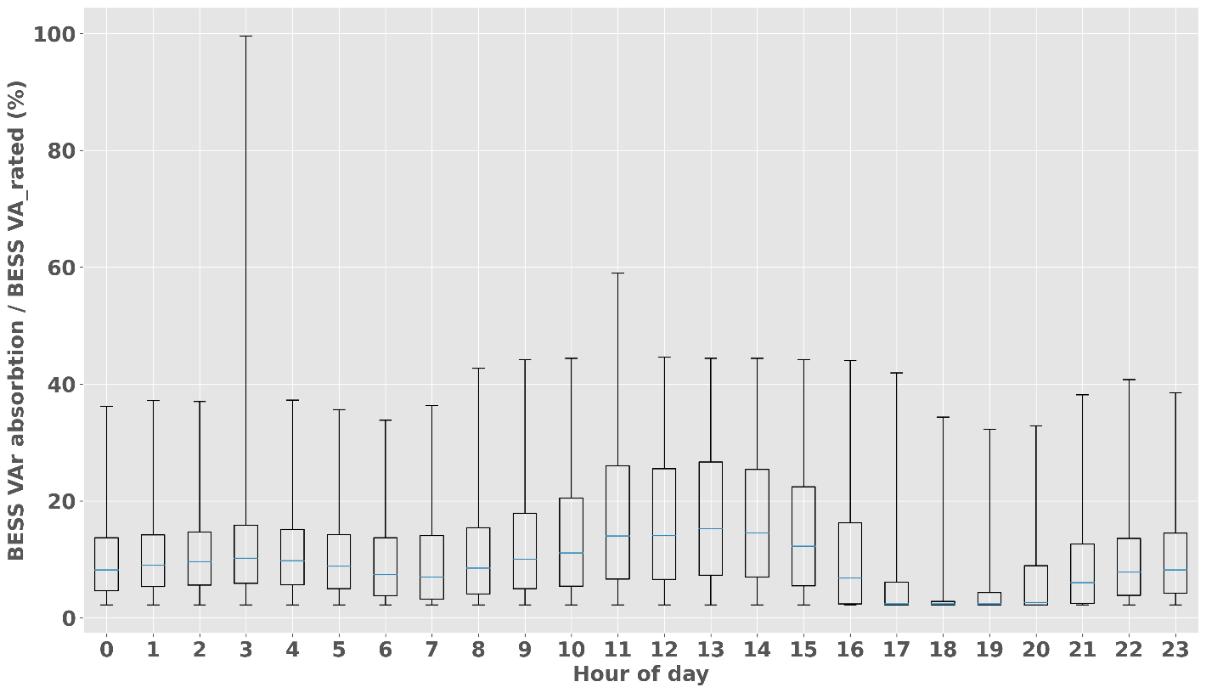
Figure 24 Distribution of BESS VAr absorption across 24-hours from AGL VPP sites
Both D-PV and BESS inverters are expected to inject or absorb VArs based on the experienced voltage conditions according to the rules defined in Australian Standards AS/NZS 4777 (i.e., Volt-VAr settings). The inverter’s VAr behaviour will also depend on its installation date and the respective standard version that was in place at that time, since newer standards have different settings compared to legacy standards (see Figure 9). The AGL VPP dataset does not include any information regarding the inverter settings or the version of the standard that applied at the time of installation. Therefore, it was found useful to investigate scatter plots of the VArs vs. voltage to identify which V-VAr curve each BESS inverter operates according to. Figure 25 shows VAr vs V scatter plots for 12 months from the BESS inverter which had the highest VAr response amongst 996 sites from the AGL VPP dataset. As per the site monitoring sign convention, absorbing VArs are denoted with negative values and injecting VAr are denoted with positive values. It is observed that this BESS mostly operates according to the TS-129 V-VAr curve characteristics (see Table V). It is also seen that there is VAr injection at the 0.08 VAr/VA_rated level across a wide range of voltages which is consistent with the previous finding where BESS injected constant quantity of VAr across the DPV generation window. As voltages go lower than 220 V in winter months, there are higher levels of VAr injection as per the TS-129 V-VAr requirements.
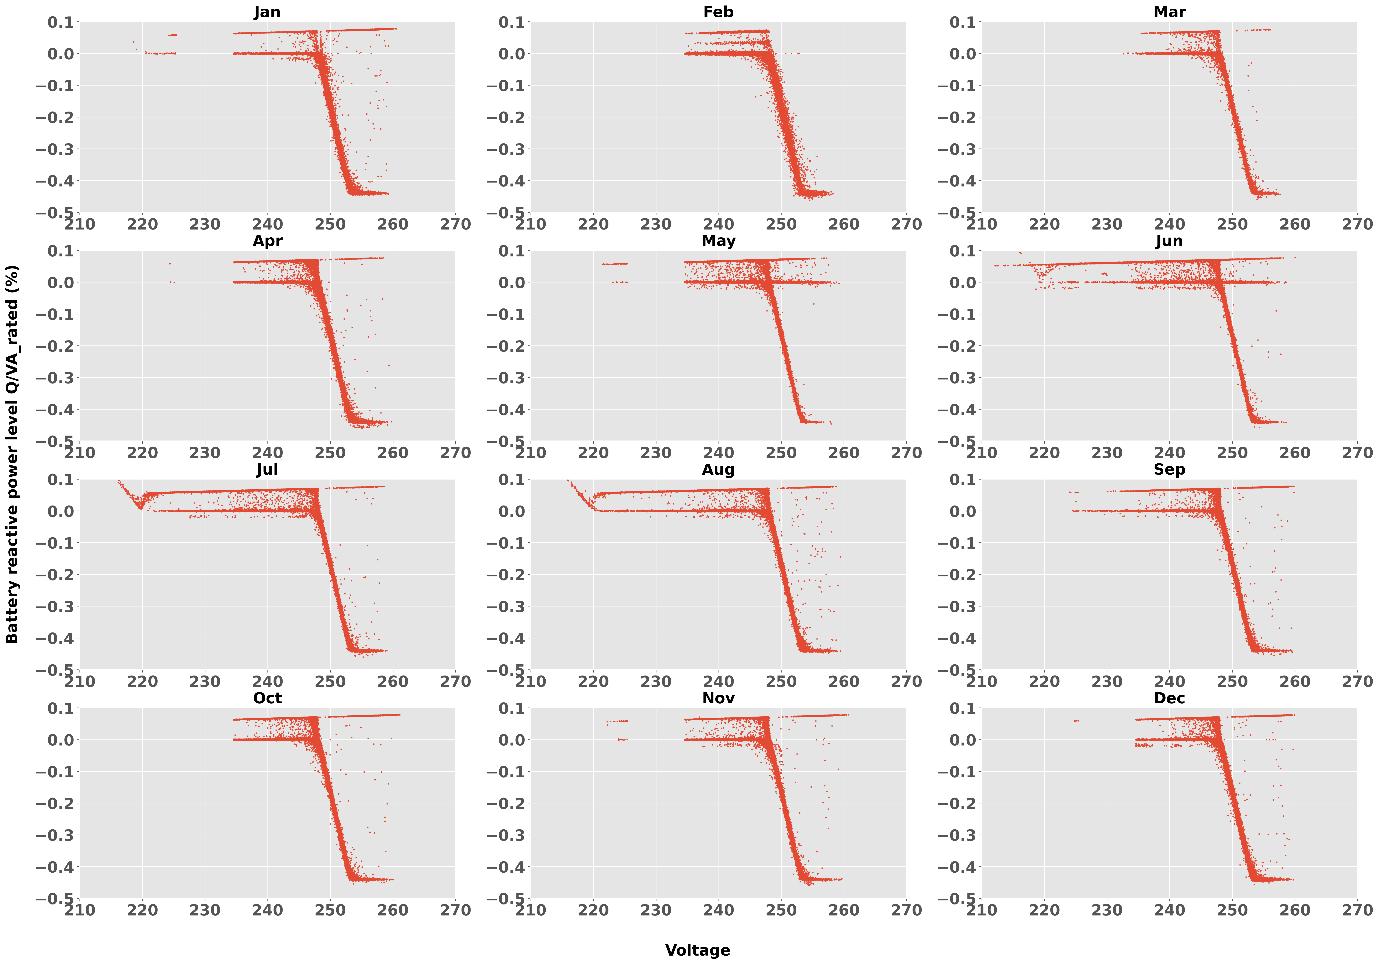
Figure 25 Q/VA_rated (%) vs. voltage scatter plot from the BESS inverter with highest VAr response across 12 months
In contrast to Figure 25, Figure 26 demonstrates a sample BESS which does not show any clear V-VAr response. The BESS inverter injects or absorbs random quantities of VAr across the experienced voltage conditions.
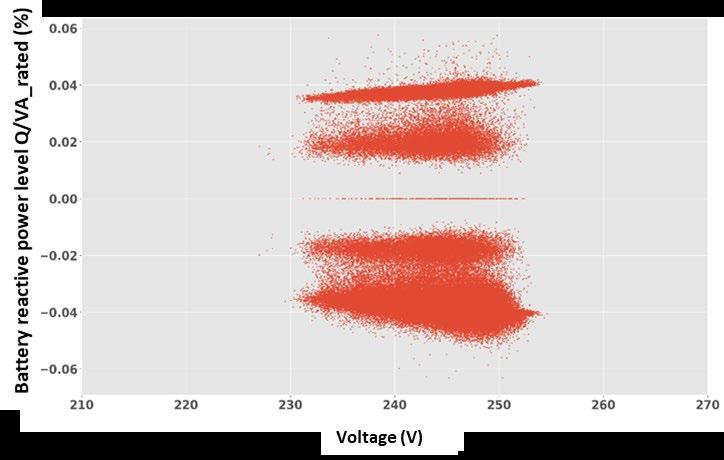
Figure 26 Q/VA_rated (%) vs. voltage scatter plot from a sample BESS inverter with no clear V-VAr response
In fact, the analysis showed that only a small number of BESS inverters showed a clear V-VAr response according to one of the reference V-VAr curves (see Figure 7 ) and the majority failed to inject or absorb VArs during under and over voltage events, instead showing negligible or zero VArs. After consultation with AGL, it was confirmed that most BESS were installed prior to July 2019 after which TS-129 took effect and therefore, even though BESS could be equipped with the previous AS/NZS 4777-2015 V-VAr settings,
they were not mandated at that time to show any V-VAr response. This explains the reason why most BESS didn’t show any V-VAr response. Table VIII below summarizes the results of the V-VAr curve investigation for the AGL sites.
Table VIII Percentage of BESS inverters that show V-VAr response according to one of the reference V-VAr curves or shows no V-VAr response
SAPN TS-129
AS/NZS 4777-2015
ENA 2019 recommendations
AS/NZS 4777-2020 No V-VAr response
Percentage of BESS inverters that are compliant with reference V-VAr curves (%)
7 1 0.4 0 91.6
Similar investigation was carried out for D-PV inverters from the Solar Analytics dataset. It was found that only a small number of D-PV systems showed V-VAr response similar to any of the studied reference VVAr curves. Figure 27 shows an example from the D-PV inverter which showed the clearest V-VAr response amongst the studied Solar Analytics fleet. It is seen that it starts absorbing VArs at 248 V and reaches peak VArs at 253 V as per TS-129 however peak VArs are at the 70% level, much higher than the reference threshold 44%.
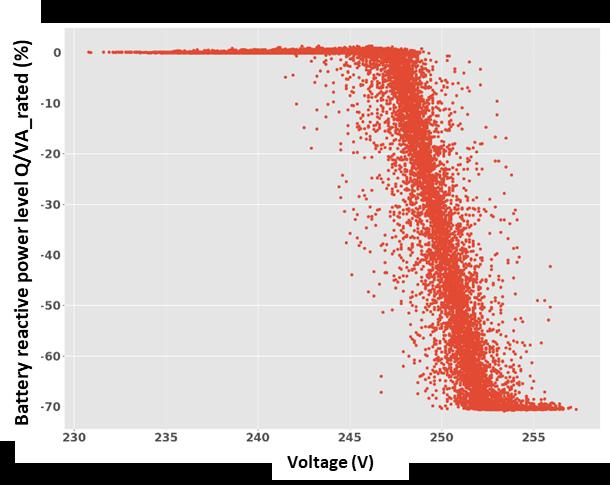
Figure 27 Q/VA_rated vs. voltage scatter plot from the D-PV inverter with most clear V-VAr response
Further analysis has shown that D-PV inverters exhibited different VAr and power factor (PF) characteristics. The majority of the D-PV inverters did not show V-VAr response and operated at unity power factor as shown in Figure 28. Figure 28 a) shows scatter plots for reactive power level Q/VA_rated (%) vs. real power level P/VA_rated (%) with blue dots (left y-axis) and PF vs. real power level P/VA_rated (%) with purple dots (right-y axis). Figure 28 b) shows the scatter plot for reactive power level Q/VA_rated (%) vs. voltage.
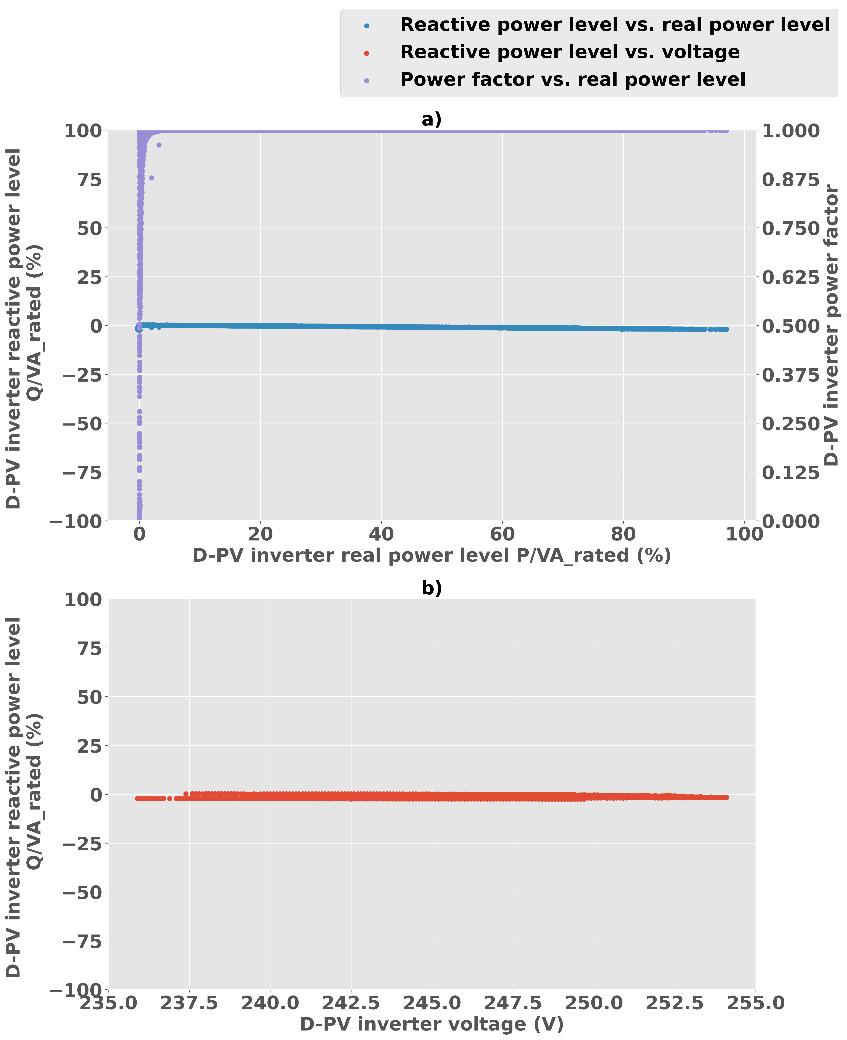
Figure 28 VAr and PF characteristics of a sample D-PV inverter which doesn’t show any V-VAr response and operates at unity power factor
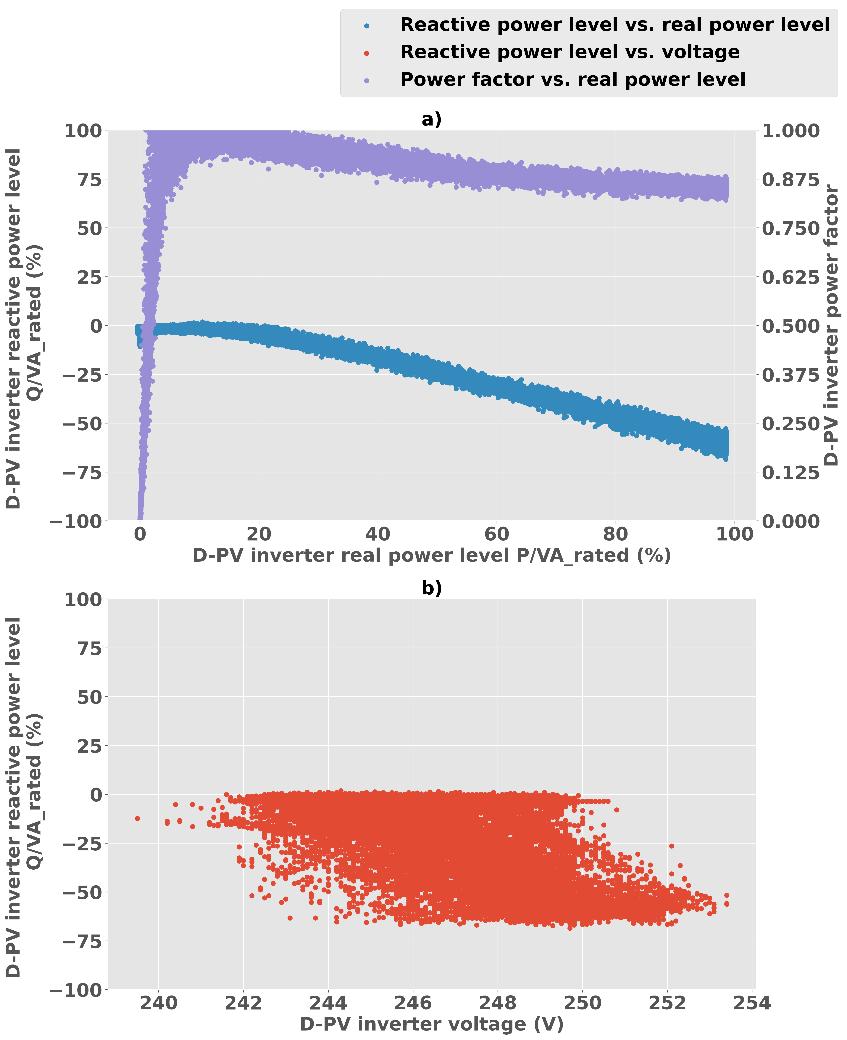
Figure 29 shows a sample D-PV inverter which doesn’t show any V-VAr response, but its PF increases with increased real power. Figure 30 on the other hand shows a different sample of D-PV inverter whose PF decreases with increasing real power due to significant increase in VAr absorption. Daily example operations for this type of VAR and PF behaviour are also presented in Figure 39. A final sample D-PV inverter is presented in Figure 31 which shows varying PF behaviour depending on the real power level: PF increases with real power at lower real power levels and decreases with real power at higher power factor level. D-PV inverter behaviour seen in Figure 28 and Figure 29 is expected given that these had AS/NZS.2.4777 settings in place; however, the behaviour observed in the latter two figures (Figure 30 and Figure 31) requires further investigation. Future project aims to conduct further lab tests and have conversations with inverter original equipment manufacturers to get to the bottom of this observed phenomenon.
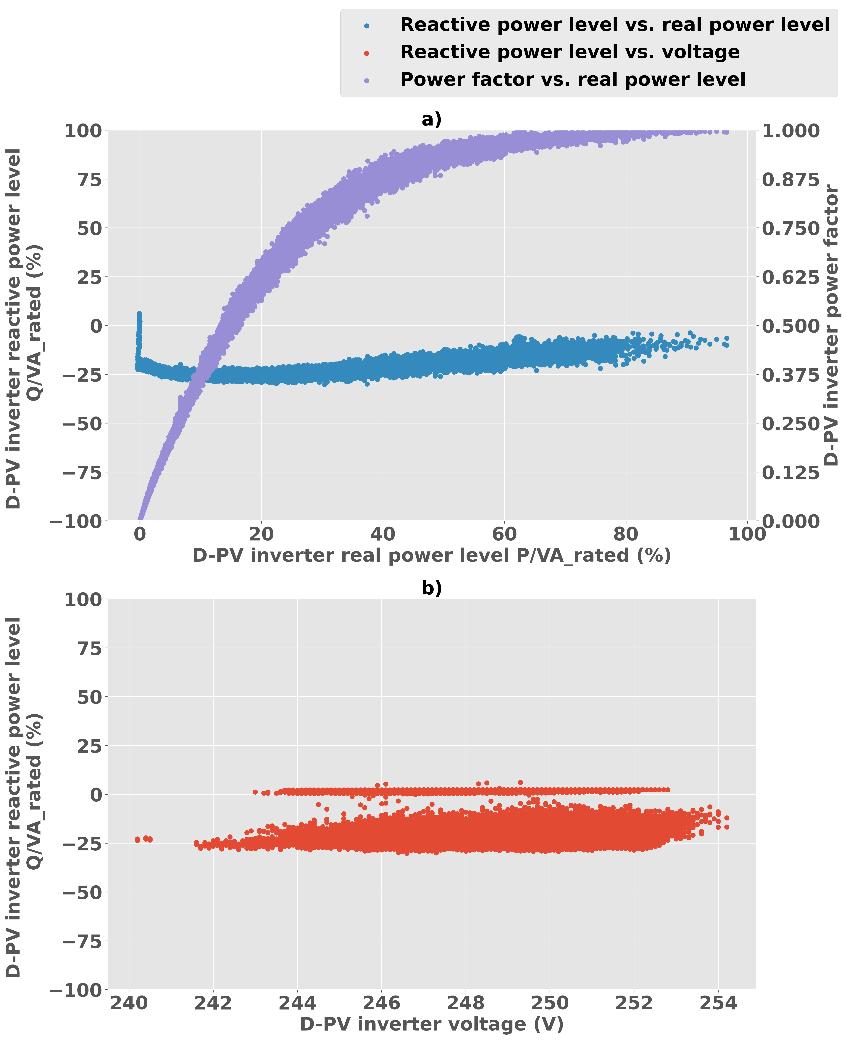
Figure 29 VAr and PF characteristics of a sample D-PV inverter which doesn’t show any V-VAr response and increases PF with increasing real power.
