1 minute read
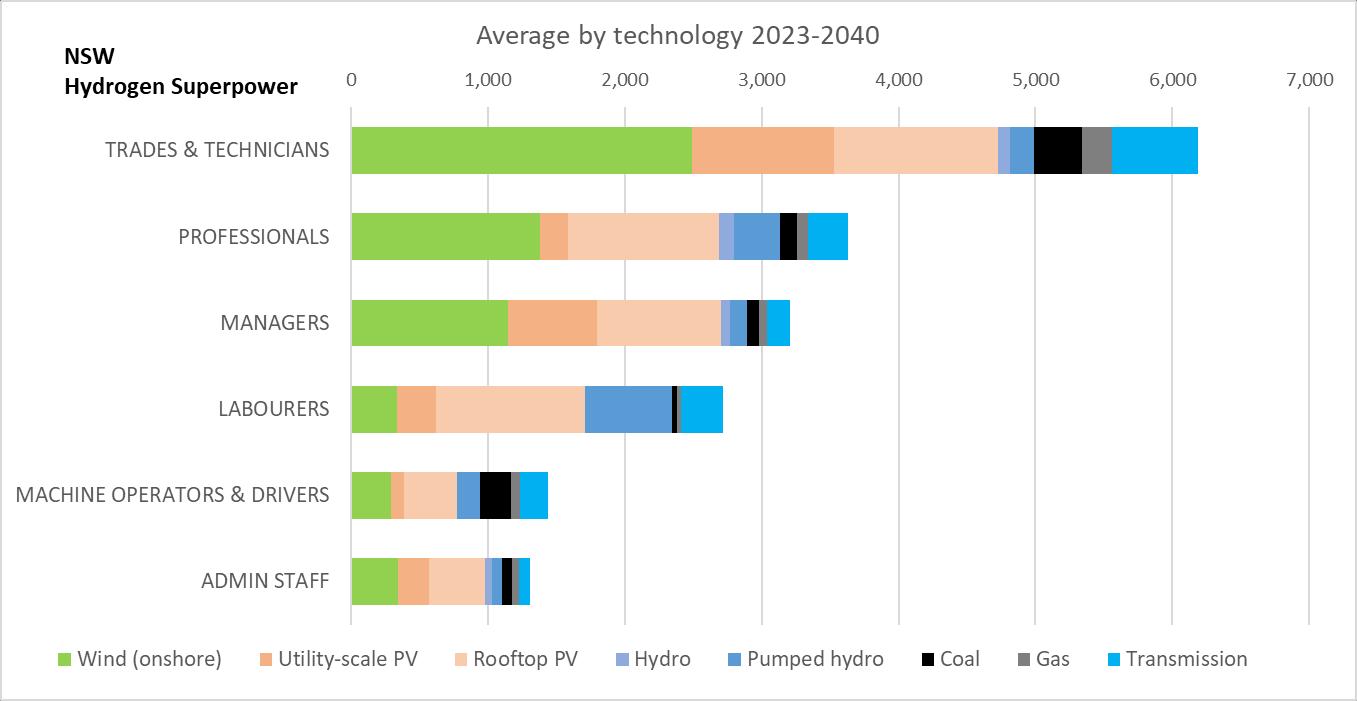
Figure 5 NSW, average occupational structure
from Electricity Sector Workforce Projections for the 2022 ISP: Focus on New South Wales
by racefor2030
3 NSW employment by occupation
Occupational employment trends are important for government, industry, the training sector, and the community to understand what type of jobs will be required as a result of the energy transition. Average annual employment projections illustrate the bulk distribution of jobs between technologies, and the occupations that are most in demand overall. Figure 5 shows the average annual employment demand from 2023 until 2040 by employment grouping: • The largest group of occupations is trades and technicians which average 5,000 jobs per year until 2040 under the
Step Change scenario and just over 6,100 jobs per year under the Hydrogen Superpower scenario. • The next largest groups are professionals at just under 3,000 jobs per year (which includes a wide range of ‘white collar’ occupations such as finance, health and safety, and engineers), and just over 3,600 jobs for Hydrogen
Superpower. • Managers account for 2,500 jobs per year on average under the Step Change scenario, led predominantly by construction managers. Managers account for 3,200 jobs on average in the Hydrogen Superpower scenario. • An average of 2,100 labourer jobs are projected per year in Step Change (especially construction labourers), just under 1,500 jobs for machine operators and drivers (e.g., truck drivers, crane operators) and just over 1,000 jobs for administrative staff. Under the Hydrogen Superpower scenario, there would be demand for 2,700 labourers on average, 1,400 machine operators and drivers, and 1,300 administrative staff.
Figure 5 NSW, average occupational structure


