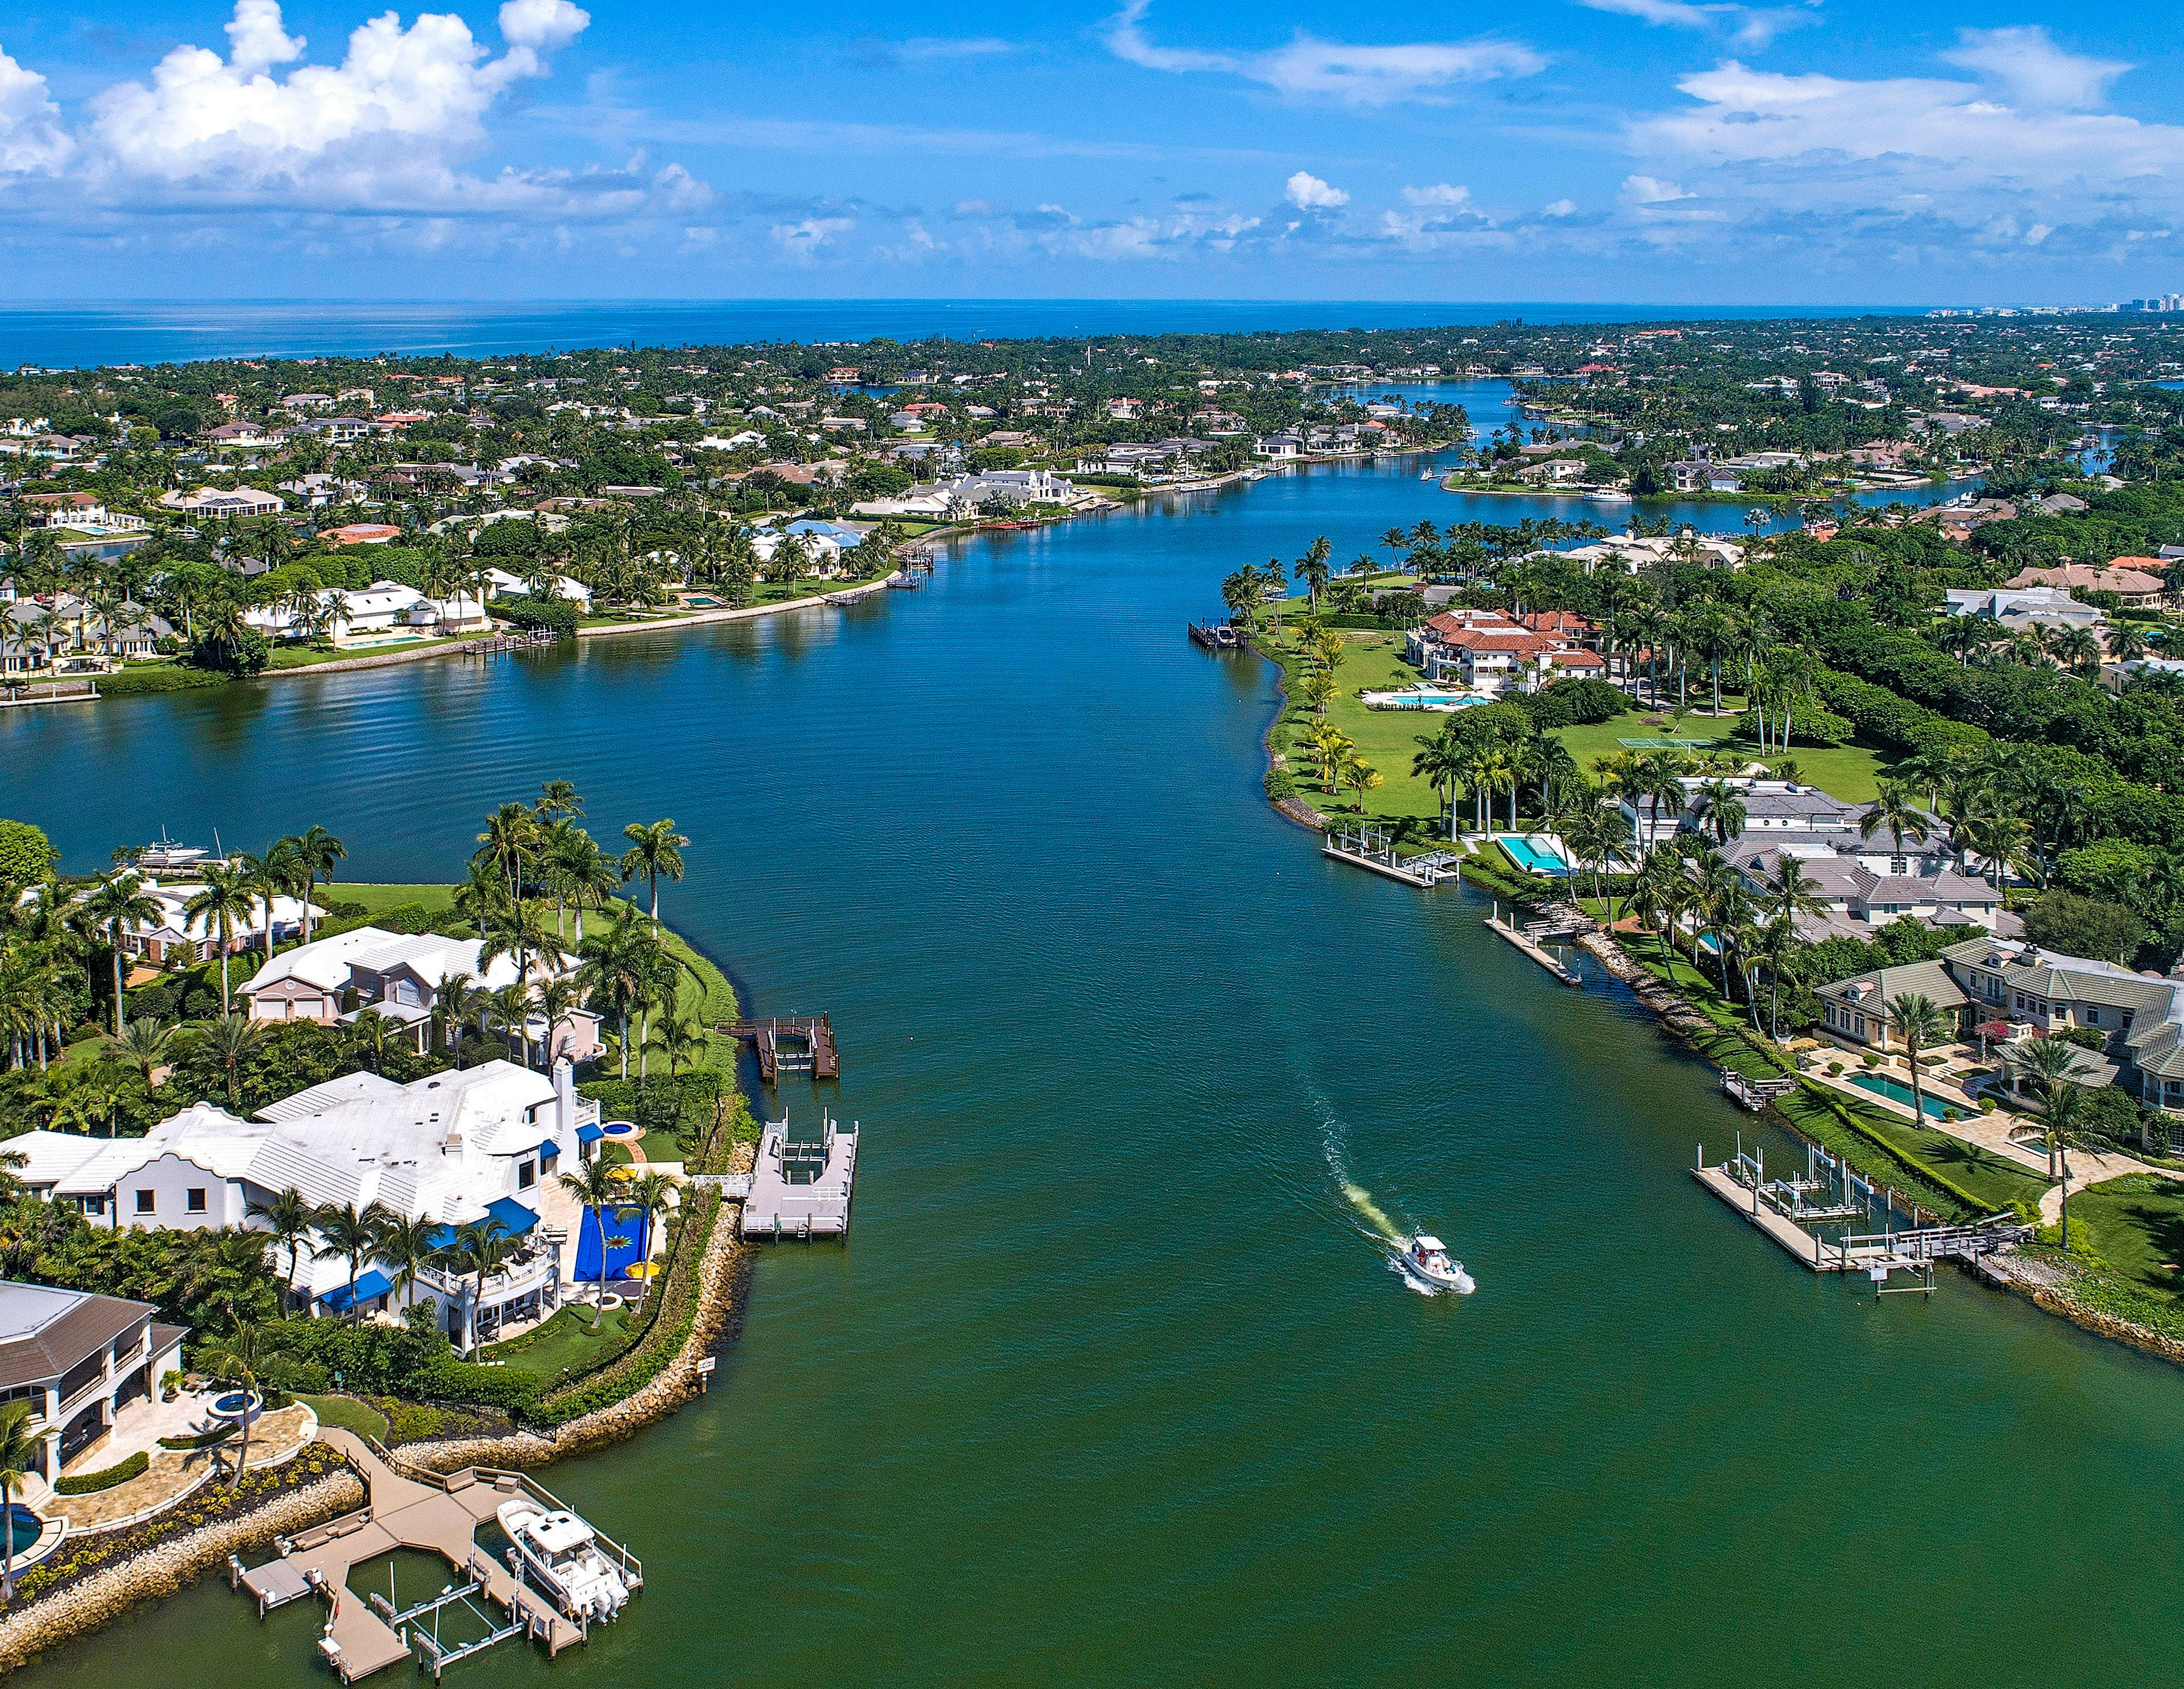
PORT ROYAL AREA


4444 GORDON DR $36,000,000 $40,000,000 7,000 5 Bed 1995 $5,142.86 150’ $240,000 W 0 90% 4/6/2022
3131 FORT CHARLES DR $34,995,000 $34,995,000 10,375 5+Den 2023 $3,373.01 165’ $212,091 E 0 100% 1/26/2022
1700 GALLEON DR $29,950,000 $29,950,000 9,253 6 or More 2007 $3,236.79 207’ $144,685 W 4 100% 12/05/22
1330 GALLEON DR $27,900,000 $27,900,000 8,430 6 or More 2022 $3,309.61 140’ $199,285 W 115 100% 11/22/22
4115 CUTLASS LN $27,367,069 $26,900,000 6,291 N/A 2022 $4,350.19 101’ $270,961 E 8 102% 8/31/2022
885 ADMIRALTY PARADE $23,250,000 $24,000,000 5,886 5+Den 2011 $3,950.05 130’ $178,846 N 22 97% 4/11/2022
3701 NELSONS WALK $22,250,000 $26,000,000 6,200 4+Den 1998 $3,588.71 253’ $87,945 N 115 86% 10/31/2022
3300 FORT CHARLES DR $22,120,000 $22,495,000 6,532 5+Den 2021 $3,386.41 96’ $230,417 W 36 98% 5/5/2022
1676 GALLEON DR $20,250,000 $24,900,000 5,263 4 Bed 1998 $3,847.62 153’ $132,353 W 113 81% 10/11/2022
1351 SPYGLASS LN $20,000,000 $17,900,000 6,884 5+Den 2017 $2,905.29 100’ $200,000 E 3 112% 8/4/2022
625 KINGS TOWN DR $19,900,000 $19,900,000 7,745 5+Den 2022 $2,569.40 96’ $207,292 E 72 100% 7/5/2022
1070 NELSONS WALK $19,400,000 $22,900,000 5,780 4+Den 2016 $3,356.40 145’ $133,793 S 73 85% 1/14/2022
3130 RUM ROW $17,500,000 $17,500,000 8,913 N/A 2017 $1,963.42 105’ $166,667 W 0 100% 2/28/2022
1857 GALLEON DR $17,500,000 $22,500,000 5,073 4+Den 1957 $3,449.64 151’ $115,894 NE 126 78% 4/29/2022
3800 FORT CHARLES DR $17,000,000 $16,950,000 7,357 4+Den 1996 $2,310.72 170’ $100,000 W 4 100% 3/3/2022
3600 GORDON DR $16,000,000 $16,000,000 2,500 3 Bed 1946 $6,400.00 157’ $101,910 W 0 1.00 11/23/22
941 GALLEON DR $15,250,000 $17,900,000 9,517 4 Bed 2001 $1,602.40 93’ $163,978 E 1 85% 5/4/2022
950 NELSONS WALK $14,088,000 $15,800,000 7,653 4+Den 1965 $1,840.85 132’ $106,727 S 48 89% 4/8/2022
275 CHAMPNEY BAY CT $14,000,000 $15,500,000 5,400 4+Den 1987 $2,592.59 255’ $54,902 E 225 90% 5/4/2022
3455 GIN LN $11,000,000 $12,500,000 4,178 5 Bed 1973 $2,632.84 102’ $107,843 E 69 88% 7/14/2022
3175 FORT CHARLES DR $10,500,000 $11,250,000 7,588 6 Bed 1993 $1,383.76 101’ $103,960 NE 75 93% 10/21/2022
3232 GREEN DOLPHIN LN $10,000,000 $10,250,000 4,012 4+Den 1978 $2,492.52 N/A N/A W 17 98% 8/2/2022
336 GALLEON DR $5,900,000 $7,950,000 3,049 3+Den 1956 $1,935.06 100’ $59,000 S 68 0.74 12/30/2022
555 KINGS TOWN DR $23,300,000 $24,900,000 N/A 127’ $183,464
JANUARY 1st - DECEMBER 31st, 2022
This map is an artist’s rendition and is not to scale. It is not warranted or represented that this map or the information shown thereon is accurate or complete and it should not be relied upon as such for any purpose. A buyer should be represented by legal counsel and obtain a professional survey certified to the buyer with respect to any property a buyer intends to purchase. This map makes no representations as to Port Royal Club membership eligibility, if any. Based on information from the Naples Area Board of REALTORS® for the period 1/1/2022 through 12/31/2022, these properties were not all listed or sold by William Raveis Real Estate and were listed or sold by various MLS Participating Offices. These properties may not be all the listed properties in the target area. 1. William Raveis Real Estate exceeds all other brokers in total volume and total transactions in Port Royal according to the SWFLAMLS for the time period 1/1/2022 - 12/31/2022.


