Chapter 12
454
Multiple Linear Regression and
Estimate the quadratic regression equation
scores of four tests. The data are as follows:
PY\x = 3o + 0ix + 02X2. 1 2 . 8 The following is a set of coded experimental data on the compressive strength of a particular alloy at various values of the concentration of some additive: Compressive Concentration, X Strength, y 25.2 10.0 27.3 28.7 15.0 29.8 31.1 27.8 31.2 20.0 32.6 29.7 25.0 31.7 30.1 32.3 29.4 30.0 30.8 32.8 (a) Estimate the quadratic regression equation py\x = 0o + 0iX + p\x2. (b) Test for lack of fit of the model. 12.9 The electric power consumed each month by a chemical plant is thought to be related to the average ambient temperature x i , the number of days in the month x2, the average product purity X3, and the tons of product produced X4. The past year's historical data are available and are presented in the following table.
240 236 290 274 301 316 300 296 267 276 288 261
X]
X2
ak
25 31 45 60 65 72 80 84 75 60 50 38
24 21 24 25 25 26 25 25 24 25 25 23
91 90 88 87 91 94 87 86 88 91 90 89
(a) Fit a multiple linear regression model using the above data set. (b) Predict power consumption for a month in which xi = 75째F, x 2 = 24 days, x 3 = 90%, and x 4 = 98 tons. 12.10 Given the data X
0 l 2 l 4 5
3 3
4 2
5 3
6 4
y (a) Fit the cubic model fiy\x = 30 +0ix+02x2 + 03x*. (b) Predict Y when x = 2. 12.11 The personnel department of a certain industrial firm used 12 subjects in a study to determine the relationship between job performance rating (y) and
y
Xl
X2
11.2 14.5 17.2 17.8 19.3 24.5 21.2 16.9 14.8 20.0 13.2 22.5
56.5 59.5 69.2 74.5 81.2 88.0 78.2 69.0 58.1 80.5 58.3 84.0
71.0 72.5 76.0 79.5 84.0 86.2 80.5 72.0 68.0 85.0 71.0 87.2
X.]
38.5 38.2 42.5 43.4 47.5 47.4 44.5 41.8 42.1 48.1 37.5 51.0
43.0 44.8 49.0 56.3 60.2 62.0 58.1 48.1 46.0 60.3 47.1 65.2
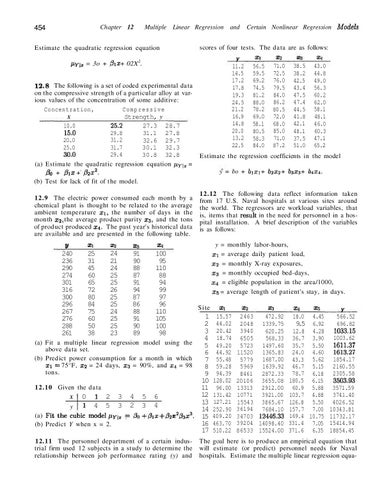
Estimate the regression coefficients in the model y = bo + bixi + b2x2 + b3x3 + &4X4. 12.12 The following data reflect information taken from 17 U.S. Naval hospitals at various sites around the world. The regressors are workload variables, that is, items that result in the need for personnel in a hospital installation. A brief description of the variables is as follows: y = monthly labor-hours, xi = average daily patient load, X2 = monthly X-ray exposures, X3 = monthly occupied bed-days, X4 = eligible population in the area/1000, i s = average length of patient's stay, in days.
X]
100 95 110 88 94 99 97 96 110 105 100 98
Certain Nonlinear Regression A4odels
Site
1 2 3 4 5 6 7 8 9 10 11 12 13 14 15 16 17
xi 15.57 44.02 20.42 18.74 49.20 44.92 55.48 59.28 94.39 128.02 96.00 131.42 127.21 252.90 409.20 463.70 510.22
X2
X3
Xl
X5
y
2463 472.92 18.0 4.45 566.52 2048 1339.75 9.5 6.92 696.82 3940 620.25 12.8 4.28 1033.15 6505 568.33 36.7 3.90 1003.62 5723 1497.60 35.7 5.50 1611.37 11520 1365.83 24.0 4.60 1613.27 5779 1687.00 43.3 5.62 1854.17 5969 1639.92 46.7 5.15 2160.55 8461 2872.33 78.7 6.18 2305.58 20106 3655.08 180.5 6.15 3503.93 13313 2912.00 60.9 5.88 3571.59 10771 3921.00 103.7 4.88 3741.40 15543 3865.67 126.8 5.50 4026.52 36194 7684.10 157.7 7.00 10343.81 34703 12446.33 169.4 10.75 11732.17 39204 14098.40 331.4 7.05 15414.94 86533 15524.00 371.6 6.35 18854.45
The goal here is to produce an empirical equation that will estimate (or predict) personnel needs for Naval hospitals. Estimate the multiple linear regression equa-