
FACILITIES MASTER PLANNING STUDY
Presentation to BOE October 24, 2022

SCHOOL
1
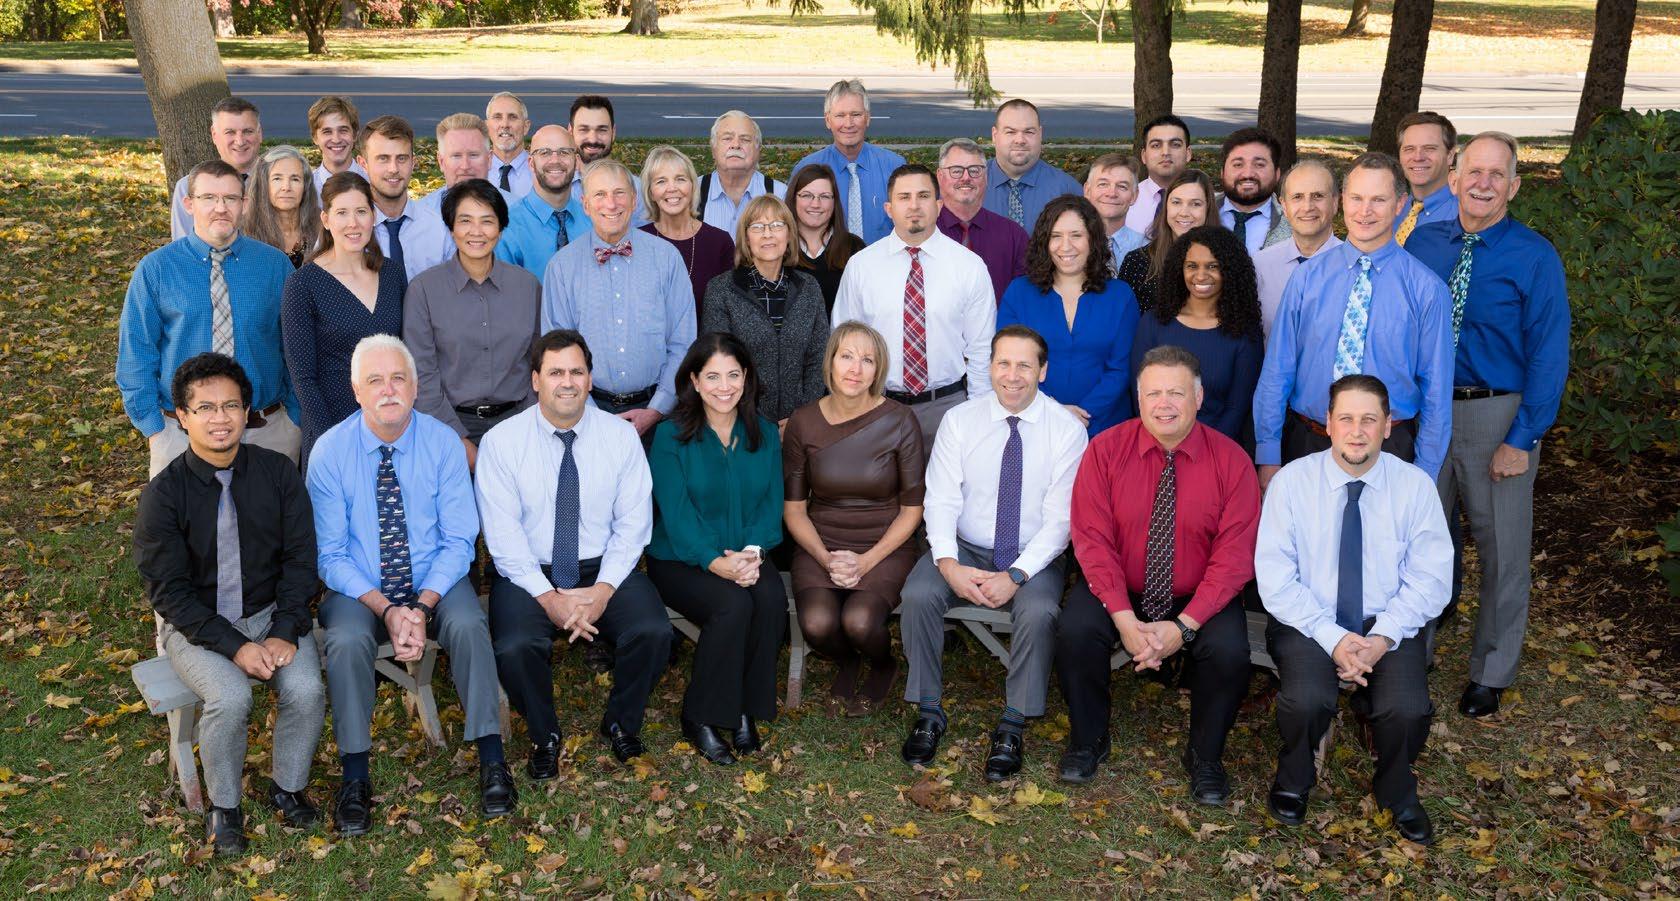


Firm Introductions Registered Architects | Licensed Engineers | Registered Interior Designers | CSI, CDT Accredited Specifications Writers | Building Official | LEED accredited staff
Michelle H. Miller, AIA SP+A Educational Architect
David J. Stein, AIA SPA+A Principal Architect
Peter M. Prowda, PhD Enrollment Projection Consultant
2
Project Objective
1. Evaluate the district’s student enrollment projections in comparison with educational goals
2. Determine utilization of the districts PK-12 infrastructure
• Reassess the High School renovation and/or consolidation concept
3. Determine the programmatic limitations and aligning with future educational goals
4. Evaluate ancillary programs and spaces through town and determine efficiencies and possibilities
• Central Office, Adult Ed, Wallingford Transition Academy relocation
3
K-12 District Projections

4
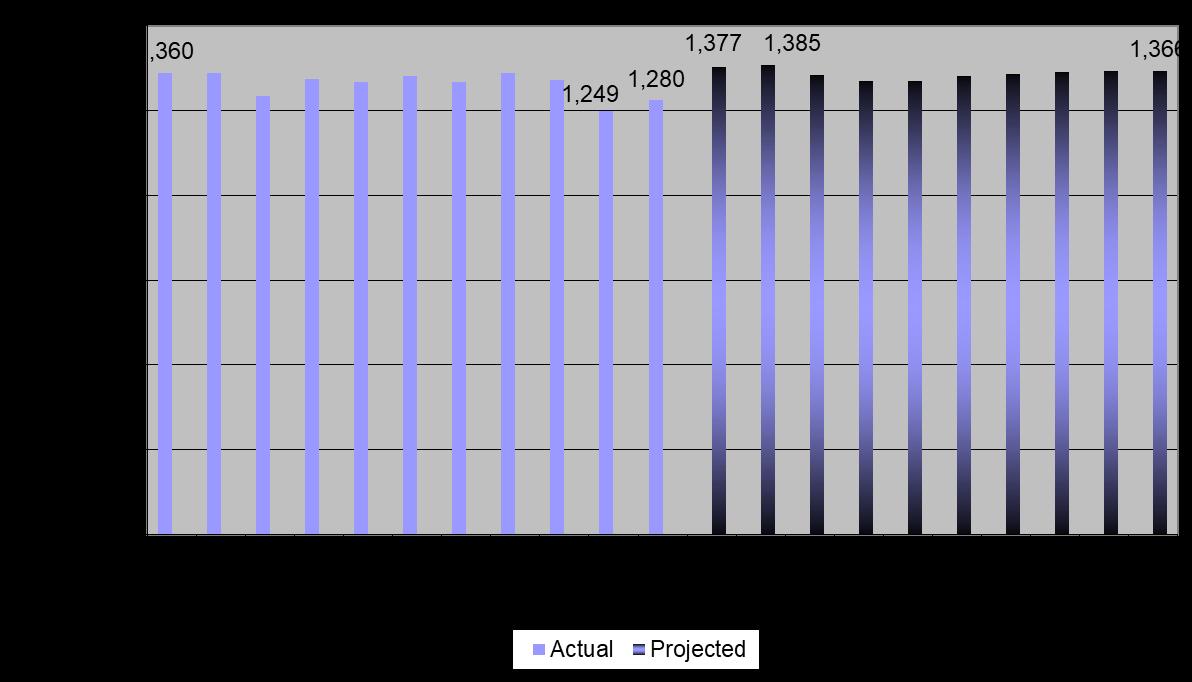
Prowda October 2022 Preliminary Projection
PK-12 District Projections •
• There is a projected decline of 93 students (-1.8%) between October 2022 and 2032 • PK-12 enrollment declined by 964 students (-15.4%) between October 2012 and 2022 6,262 5,2985,2555,205 0 1,000 2,000 3,000 4,000 5,000 6,000 7,000 121314151617181920212223242526272829303132 Enrollment October of Year ActualProjected 5
Grades PK-2 Projections
• PK-2 enrollment declined by 80 students (-5.9%) between October 2012 and 2022
• There is a projected growth of 86 students (+6.7%) between October 2022 and 2032
6
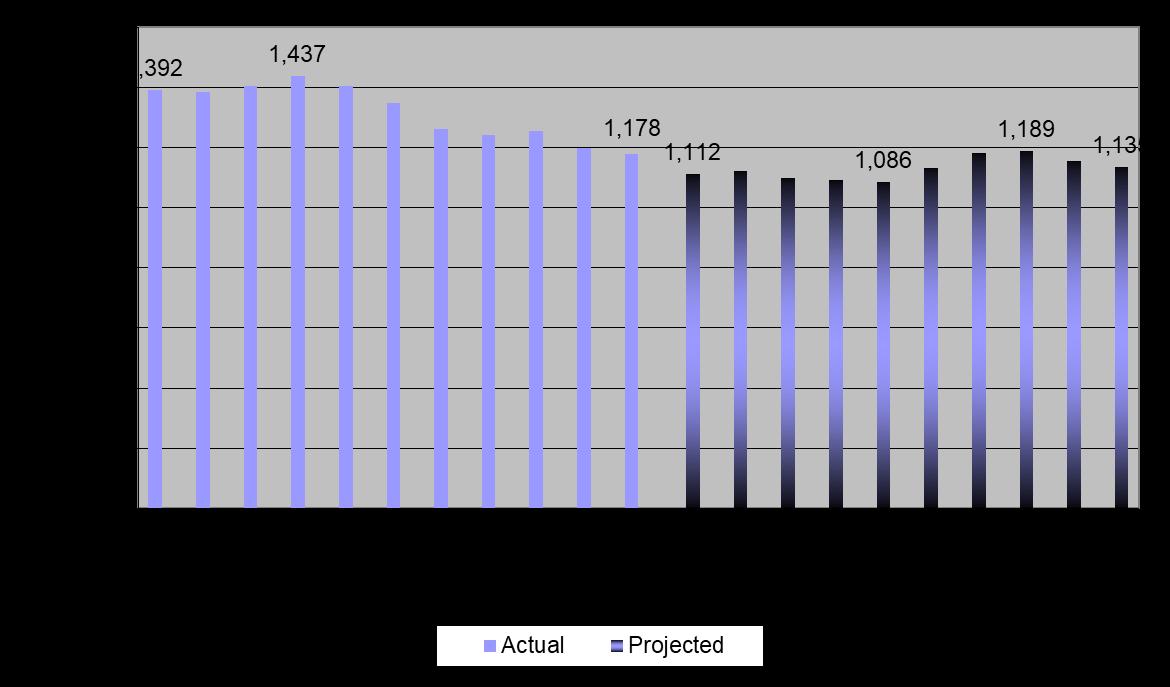
Grades 3-5 Projections
• Grade 3-5 enrollment declined by 350 students (-24.4%) between October 2012 and 2022
• There is a projected growth of 53 students (+4.9%) between October 2022 and 2032
7
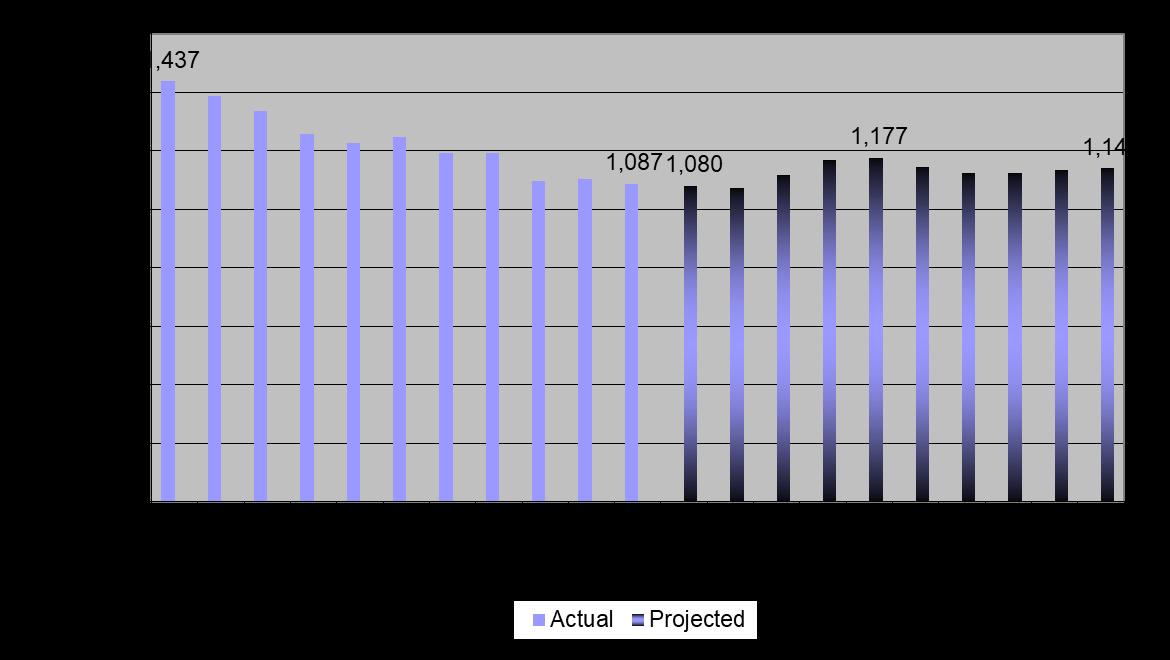
Grades 6-8 Projections
• Grade 6-8 enrollment declined by 214 students (-15.4%) between October 2012 and 2022
• There is a projected decline of 43 students (-3.7%) between October 2022 and 2032
8
Grades 9-12 Projections
•
Resident high school enrollment declined by 350 students (-18.3%) between October 2012 and 2022
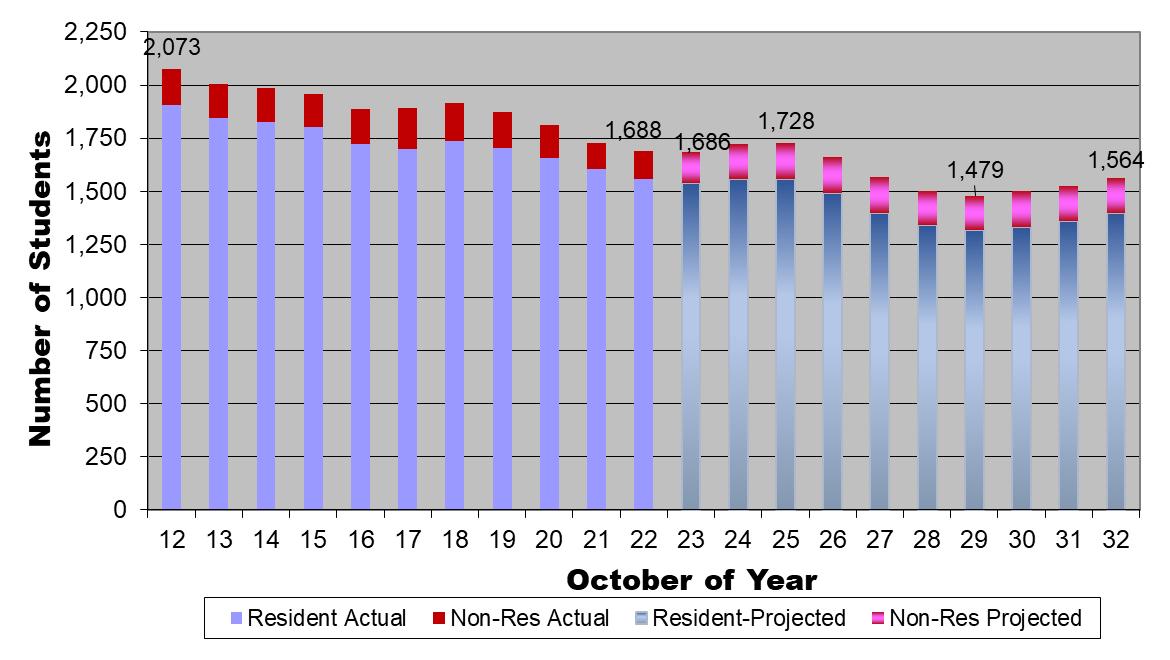
• There is a projected decline of 161 resident students (-10.3%) between October 2022 and 2032
• Future ASTE enrollment can be based on capacity or the trend of sending towns grade 8 enrollment
9
Utilization and Facility Needs
10
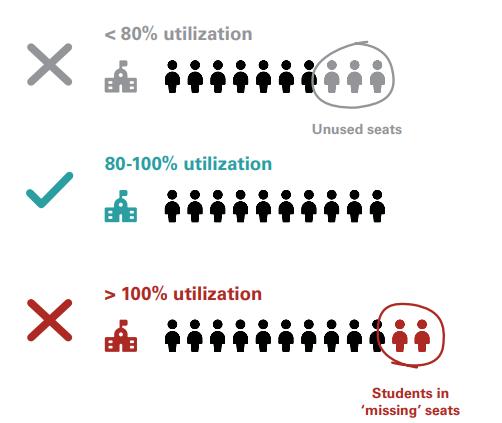
Utilization Methodology Facility utilization is determined by the space requirements of the educational programs Factors considered: • Class size policies • Physical size of classrooms/school • Programs offered by each school • Schedule of uses • Compare with State Standards Information gathered by: • Personnel interview/building tours • Teaching spaces and program usage • Analysis of building floor plans • Analysis of room inventory • Square footage information Wallingford Class Size Policies PreK18 Grades1&221 Grades3-523 Grades6-823 Grades9-1225 11
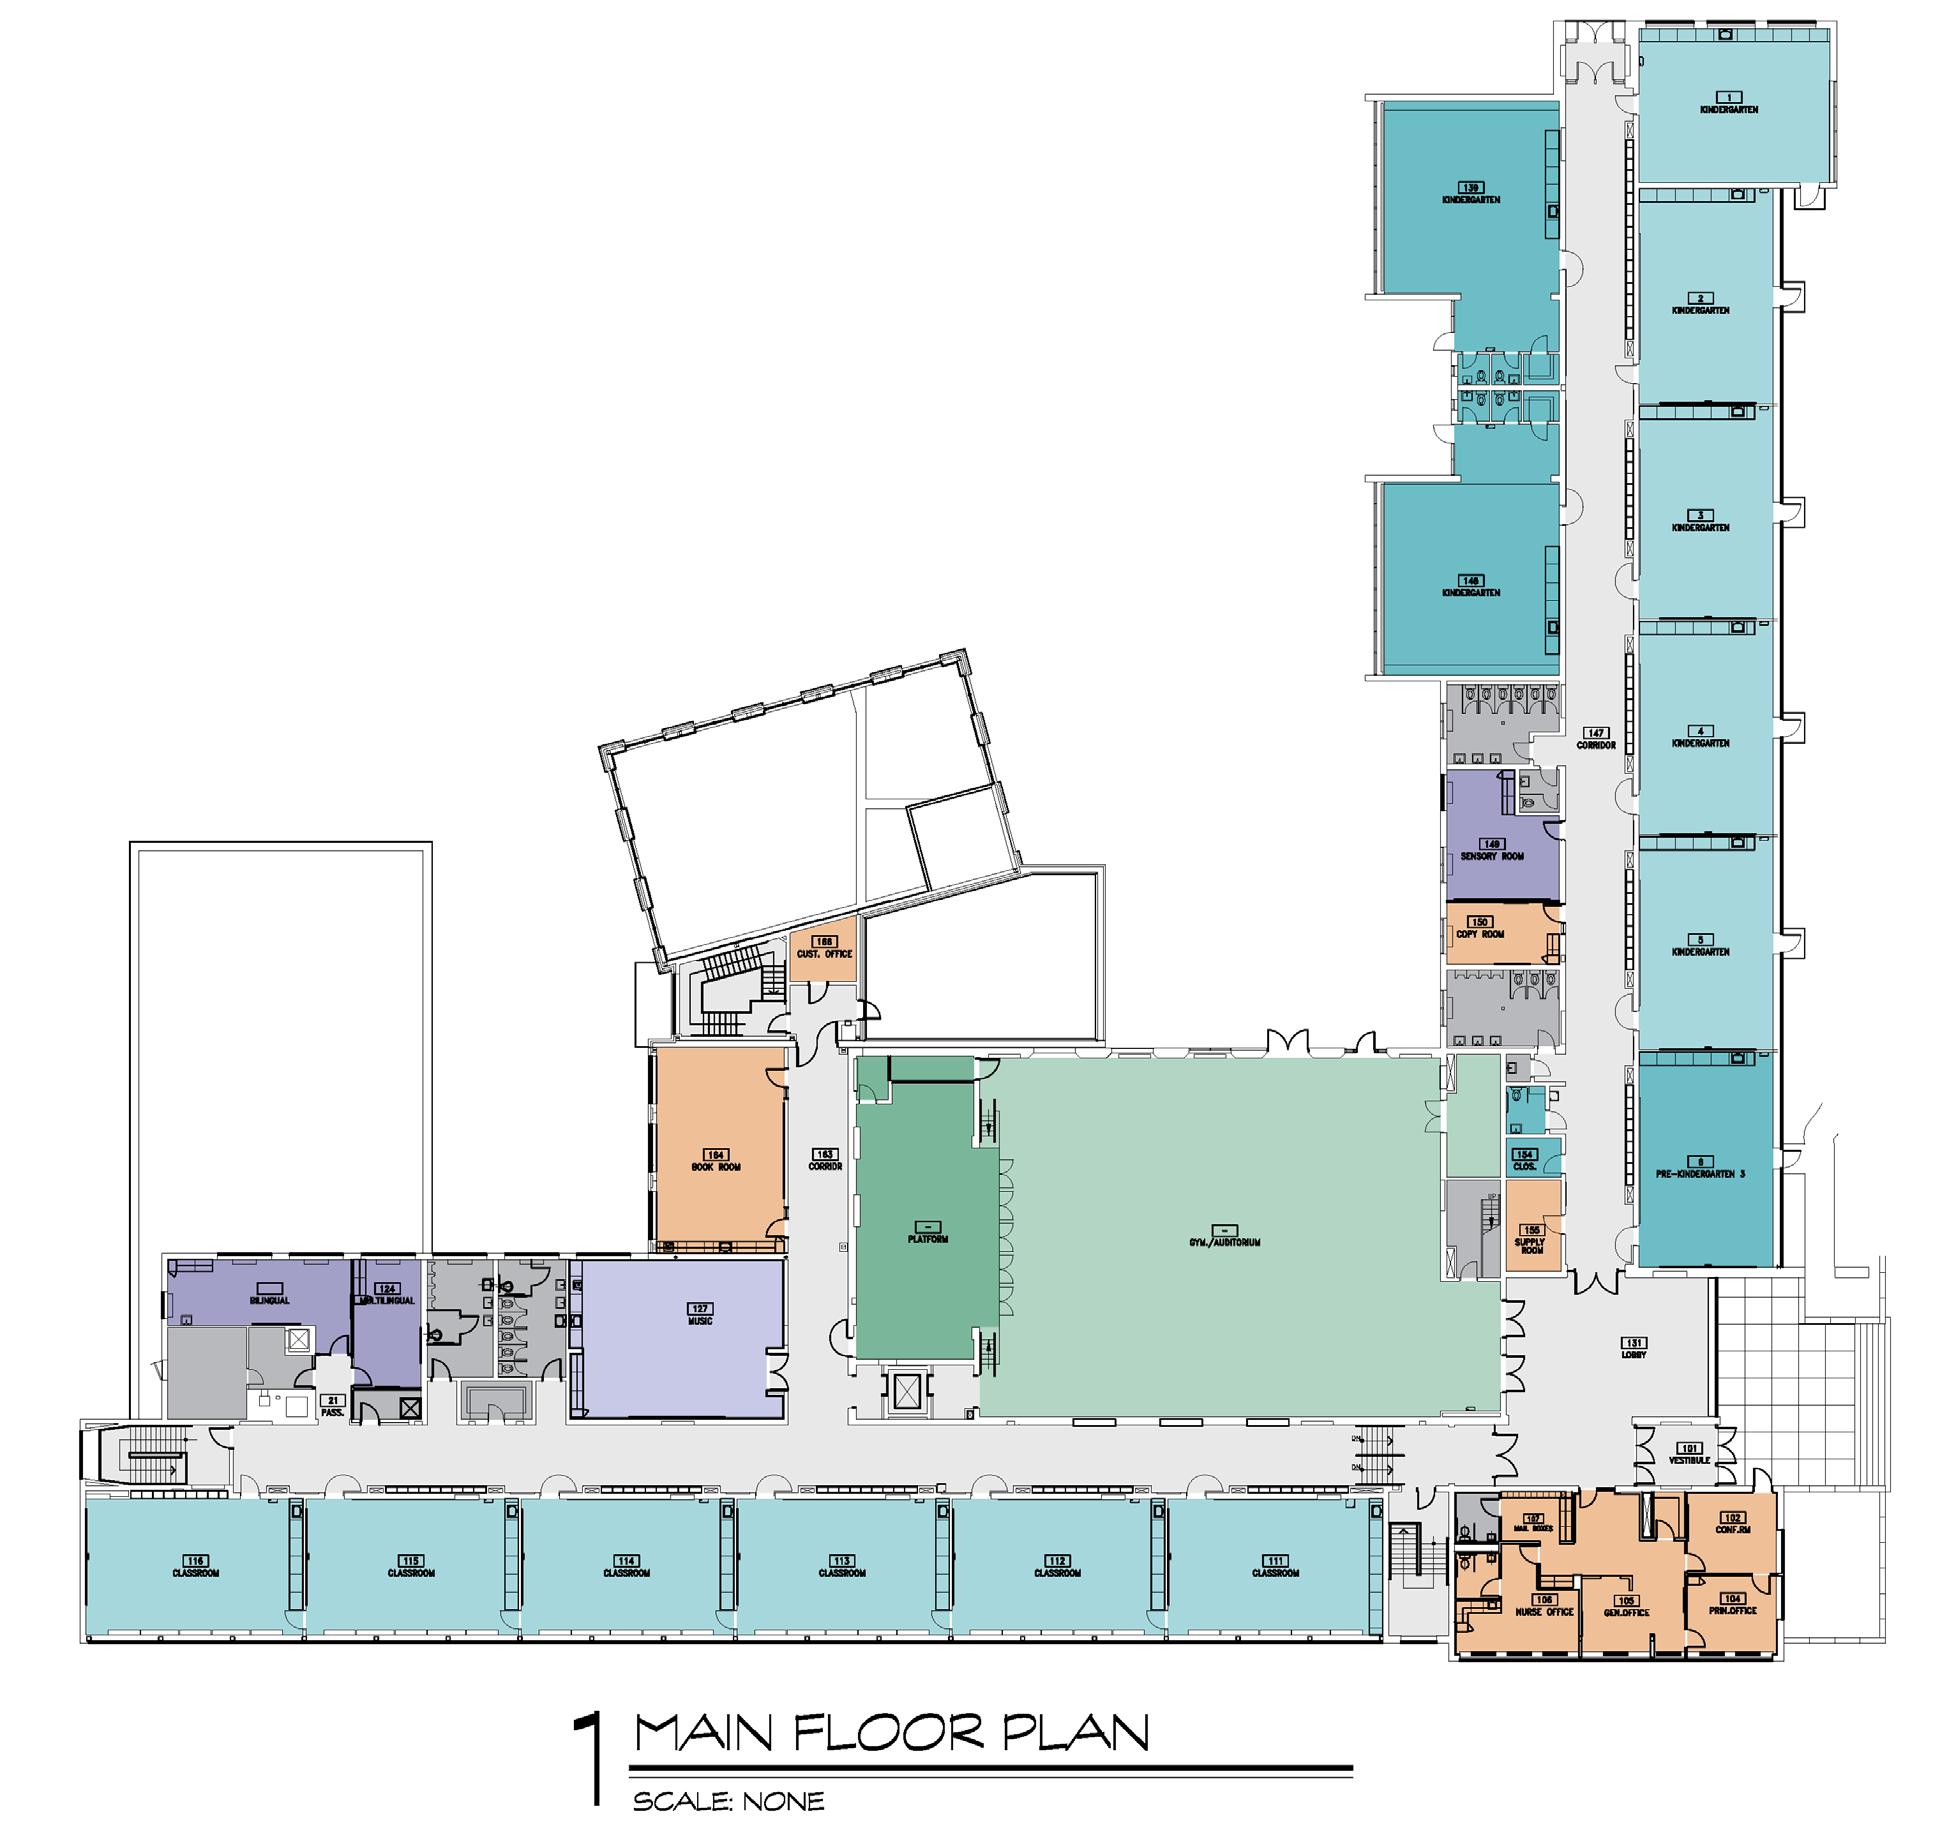
Utilization Methodology 1. Evaluate the current program at each school Space Division Quantity Square footage Subtotal Average Percentage GENERAL CLASSROOMS 17797-817 13,608 80023% PREK CLASSROOMS 3 804-940 3,302 1101 6% SPECIAL EDUCATION/PPS 9 216-548 2,911 323 5% SPECIALS (ART, MUSIC, COMPUTERS) 3 848-900 2,759 920 5% MEDIA CENTER 1 2,107 2107 4% PHYSICAL EDUCATION 1 4,875 4875 8% AUDITORIUM/STAGE 1 1,098 1098 2% FOOD SERVICE 2 3,052 1526 5% ADMINISTRATION 9 286-621 3,226 358 5% BUILDING INFRASTRUCTURE 2,741 5% CIRCULATION + STRUCTURE 19,424 33% TOTAL 59,103 41,500 DIFFERENCE 17,603 CONNECTICUT STATE SPACE STANDARD SPECIFICATIONS FOR 332 PREK - GRADE 2 STUDENTS 12
Evaluate the current program at each school
Compare overall size and population with State Standards
PROJECTED
Highest
ENROLLMENT
Areas Students
Pre-Kindergarten 552.20 Grade 6 0.00 Kindergarten 863.44 Grade 7 0.00 Grade
903.60 Grade 8 0.00 Grade
1014.04 Grade 9 0.00 Grade
0.00 Grade 10 0.00 Grade
Areas
0.00 Grade
0.00 Grade
0.00
0.00 Grade
REIMBURSEABLE SQUARE FOOTAGE Students SF/student Total SF/Student Range SF/Student - Elementary School 332125.00 41,500 104-125 SF/Student - Middle School 0 119-151 SF/ Student - High School 0 163-187
Reimbursable Gross Square
Utilization Methodology 1.
•
STUDENT
Students # Inst.
# Inst.
8-Year
Projected Enrollment 8-Year 25 8-Year 25
1
2
3
4
11
5
12
Total Student Enrollment 33213.28
Maximum
Feet 41,500 PROGRAM AREAS New Exist SF Total SF # Instr Area Academic Core 0 0 00 Special Education 0 0 0 Administration 0 0 0 Media Center 0 0 0 Visual Arts 0 0 00 Music 0 0 00 Performing Arts / Auditorium 0 0 00 Life Skills/Tech/Bus Education 0 0 00 Physical Education 0 0 00 Student Dining 0 0 0 Food Service 0 0 0 Custodial 0 0 0 Subtotal - Net Square Feet 0 0 00 Building Services 0 0 0 Subtotal - Net SF including Building Servi 0 0 0 Construction Factor 0.110.110.11 Total Gross SF Programmed - Funded 0 0 59,103 Difference Between Max. Reimb. Gross SF and Gross SF Progra 17,603 TOTAL 59,103 41,500 DIFFERENCE 17,603 CONNECTICUT STATE SPACE STANDARD SPECIFICATIONS FOR 332 PREK - GRADE 2 STUDENTS 13
1. Evaluate the current program at each school
Compare program to core learning, school support and facility support
Elementary School Program Analysis
FACILITY SUPPORT
GENERAL CLASSROOMS - 13,608
PREK CLASSROOMS - 3,302 NSF
SPECIAL EDUCATION/PPS - 2,911 NSF
SPECIALS (ART, MUSIC, COMPUTERS) - 2,759 NSF
MEDIA CENTER - 2,107 NSF
PHYSICAL EDUCATION - 4,875 NSF
AUDITORIUM/STAGE - 1,098 NSF
FOOD SERVICE - 3,052 NSF
ADMINISTRATION - 3,226 NSF
BUILDING INFRASTRUCTURE - 3,060 NSF
CIRCULATION + STRUCTURE - 19,424 NSF


Utilization Methodology
•
23% 6% 5% 5% 3% 8%2%5% 5% 5% 33% CORE LEARNING 50% SCHOOL SUPPORT 12%
38%
NSF
14

Space Division Quantity Square footage Subtotal Average Percentage GENERAL CLASSROOMS 17797-817 13,608 80023% PREK CLASSROOMS 3 804-940 3,302 1101 6% SPECIAL EDUCATION/PPS 9 216-548 2,911 323 5% SPECIALS (ART, MUSIC, COMPUTERS) 3 848-900 2,759 920 5% MEDIA CENTER 1 2,107 2107 4% PHYSICAL EDUCATION 1 4,875 4875 8% AUDITORIUM/STAGE 1 1,098 1098 2% FOOD SERVICE 2 3,052 1526 5% ADMINISTRATION 9 286-621 3,226 358 5% BUILDING INFRASTRUCTURE 2,741 5% CIRCULATION + STRUCTURE 19,424 33% TOTAL 59,103 Max Classroom Capacity 357 Max Class Size Policy 21 Classroom Quantity 17 Max PreK Classroom Capacity 54 Max Class Size Policy 18 Classroom Quantity 3 Total Max Programed Capacity 411 Current Utilization 81% Utilization Methodology 2. Determine total number of general classrooms • Not including Special Ed, Art Music, CTE classrooms 3. Overlay with maximum class size policies Wallingford Class Size Policies PreK18 Grades1&221 Grades3-523 Grades6-823 Grades9-1225 15
Building
Limitations and Facility Needs
Facility limitations is determined visual observations during tours, administration meetings and review of the facilities strategic planning and capital needs
Factors considered:
Usage
Physical needs
Programs offered by each school/ future goals
Information gathered by:
Personnel interview/building tours
Teaching spaces and program usage
Group program meetings
Administrators and Curriculum Coordinators feedback
•
•
•
•
•
•
•
16
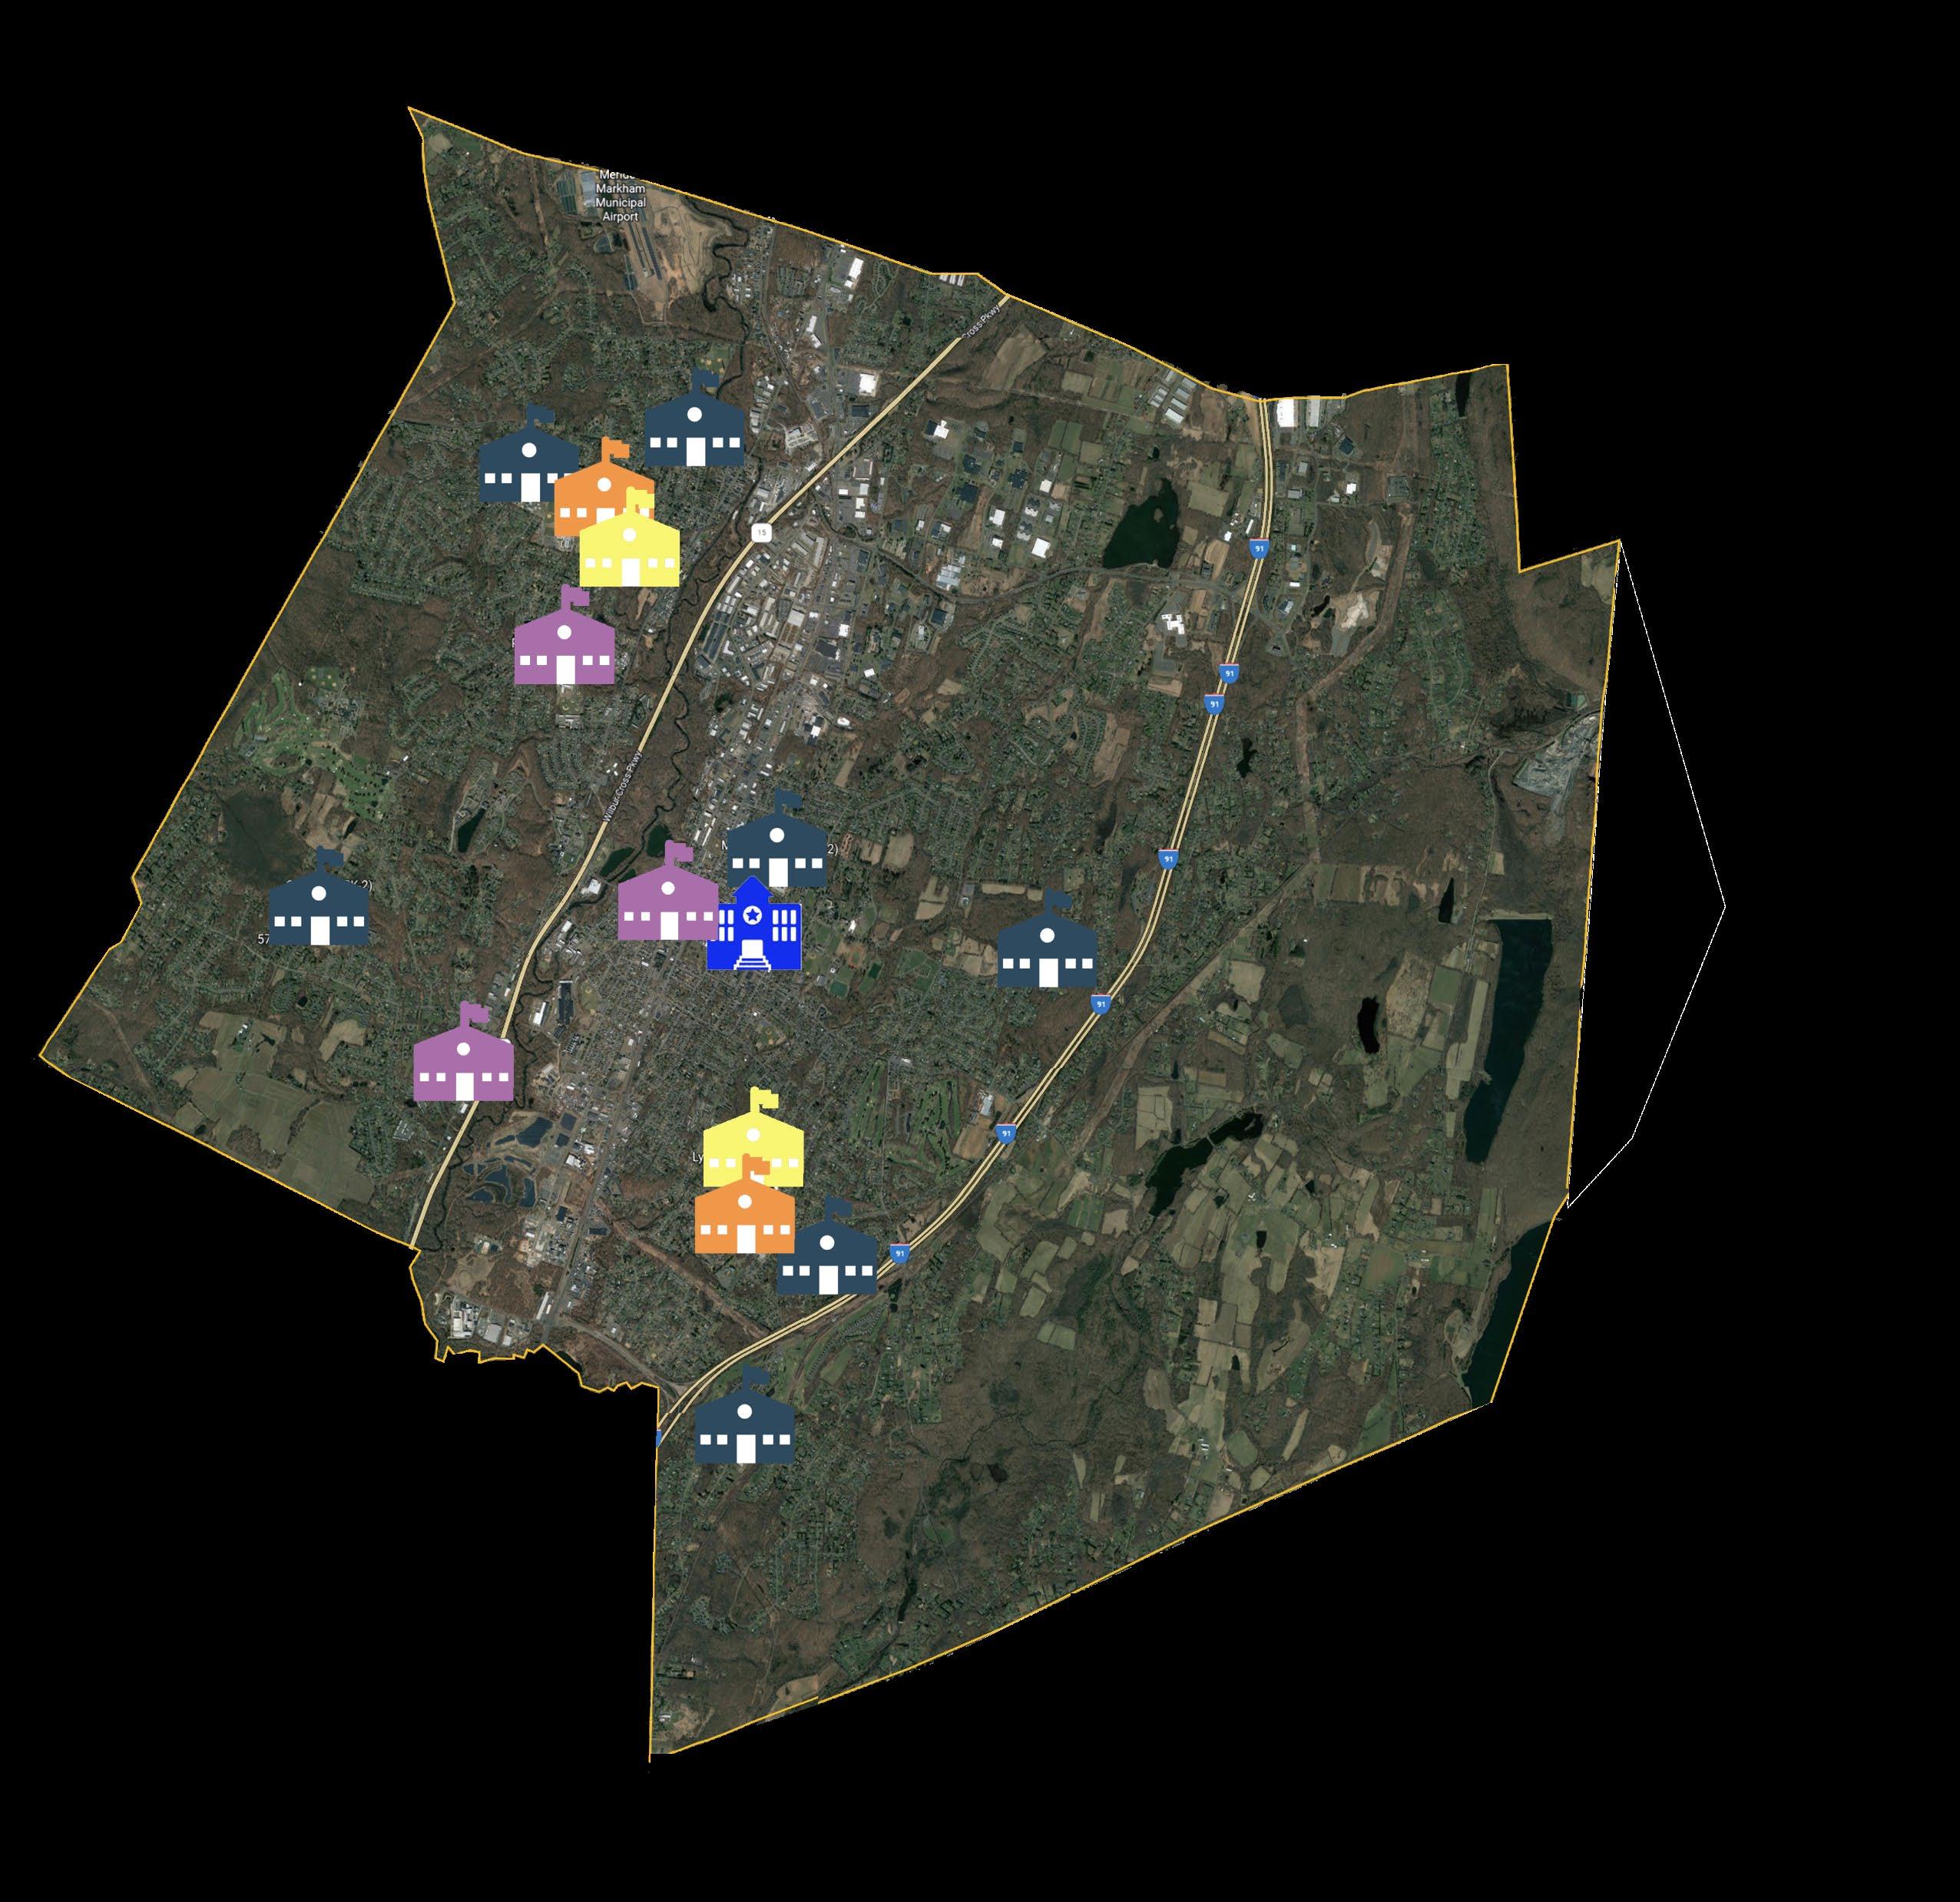
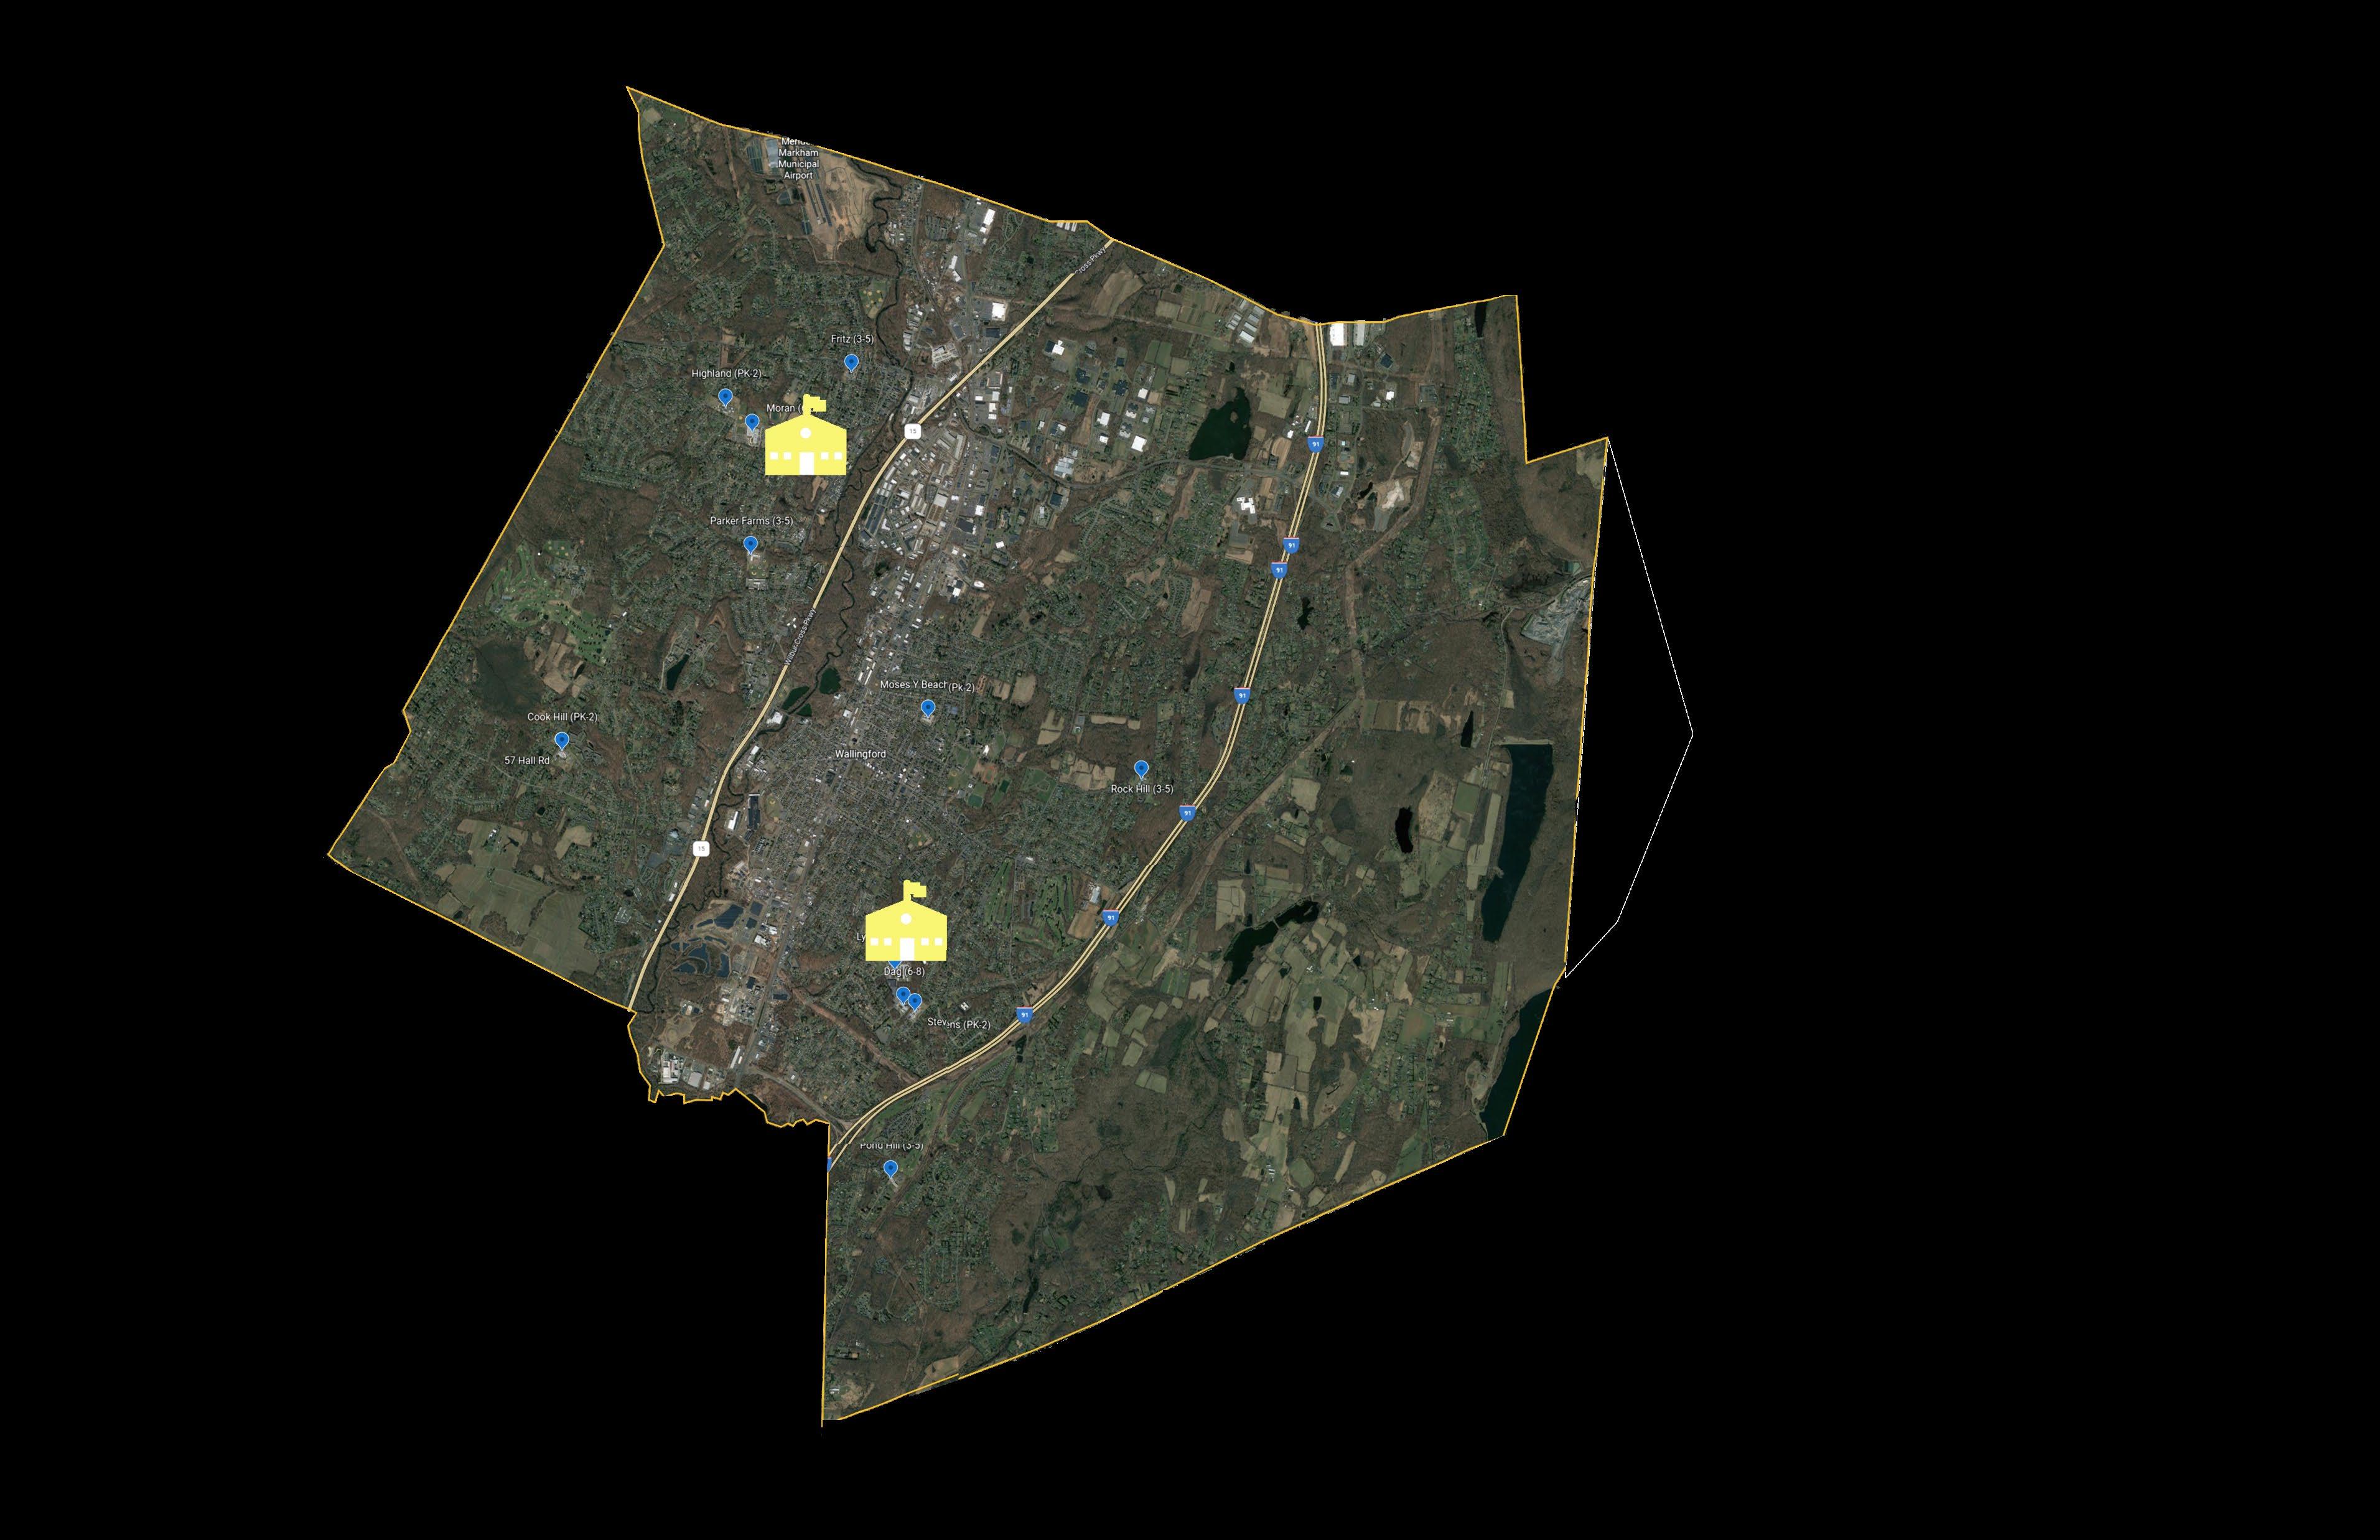
Schools: PreK
Elementary
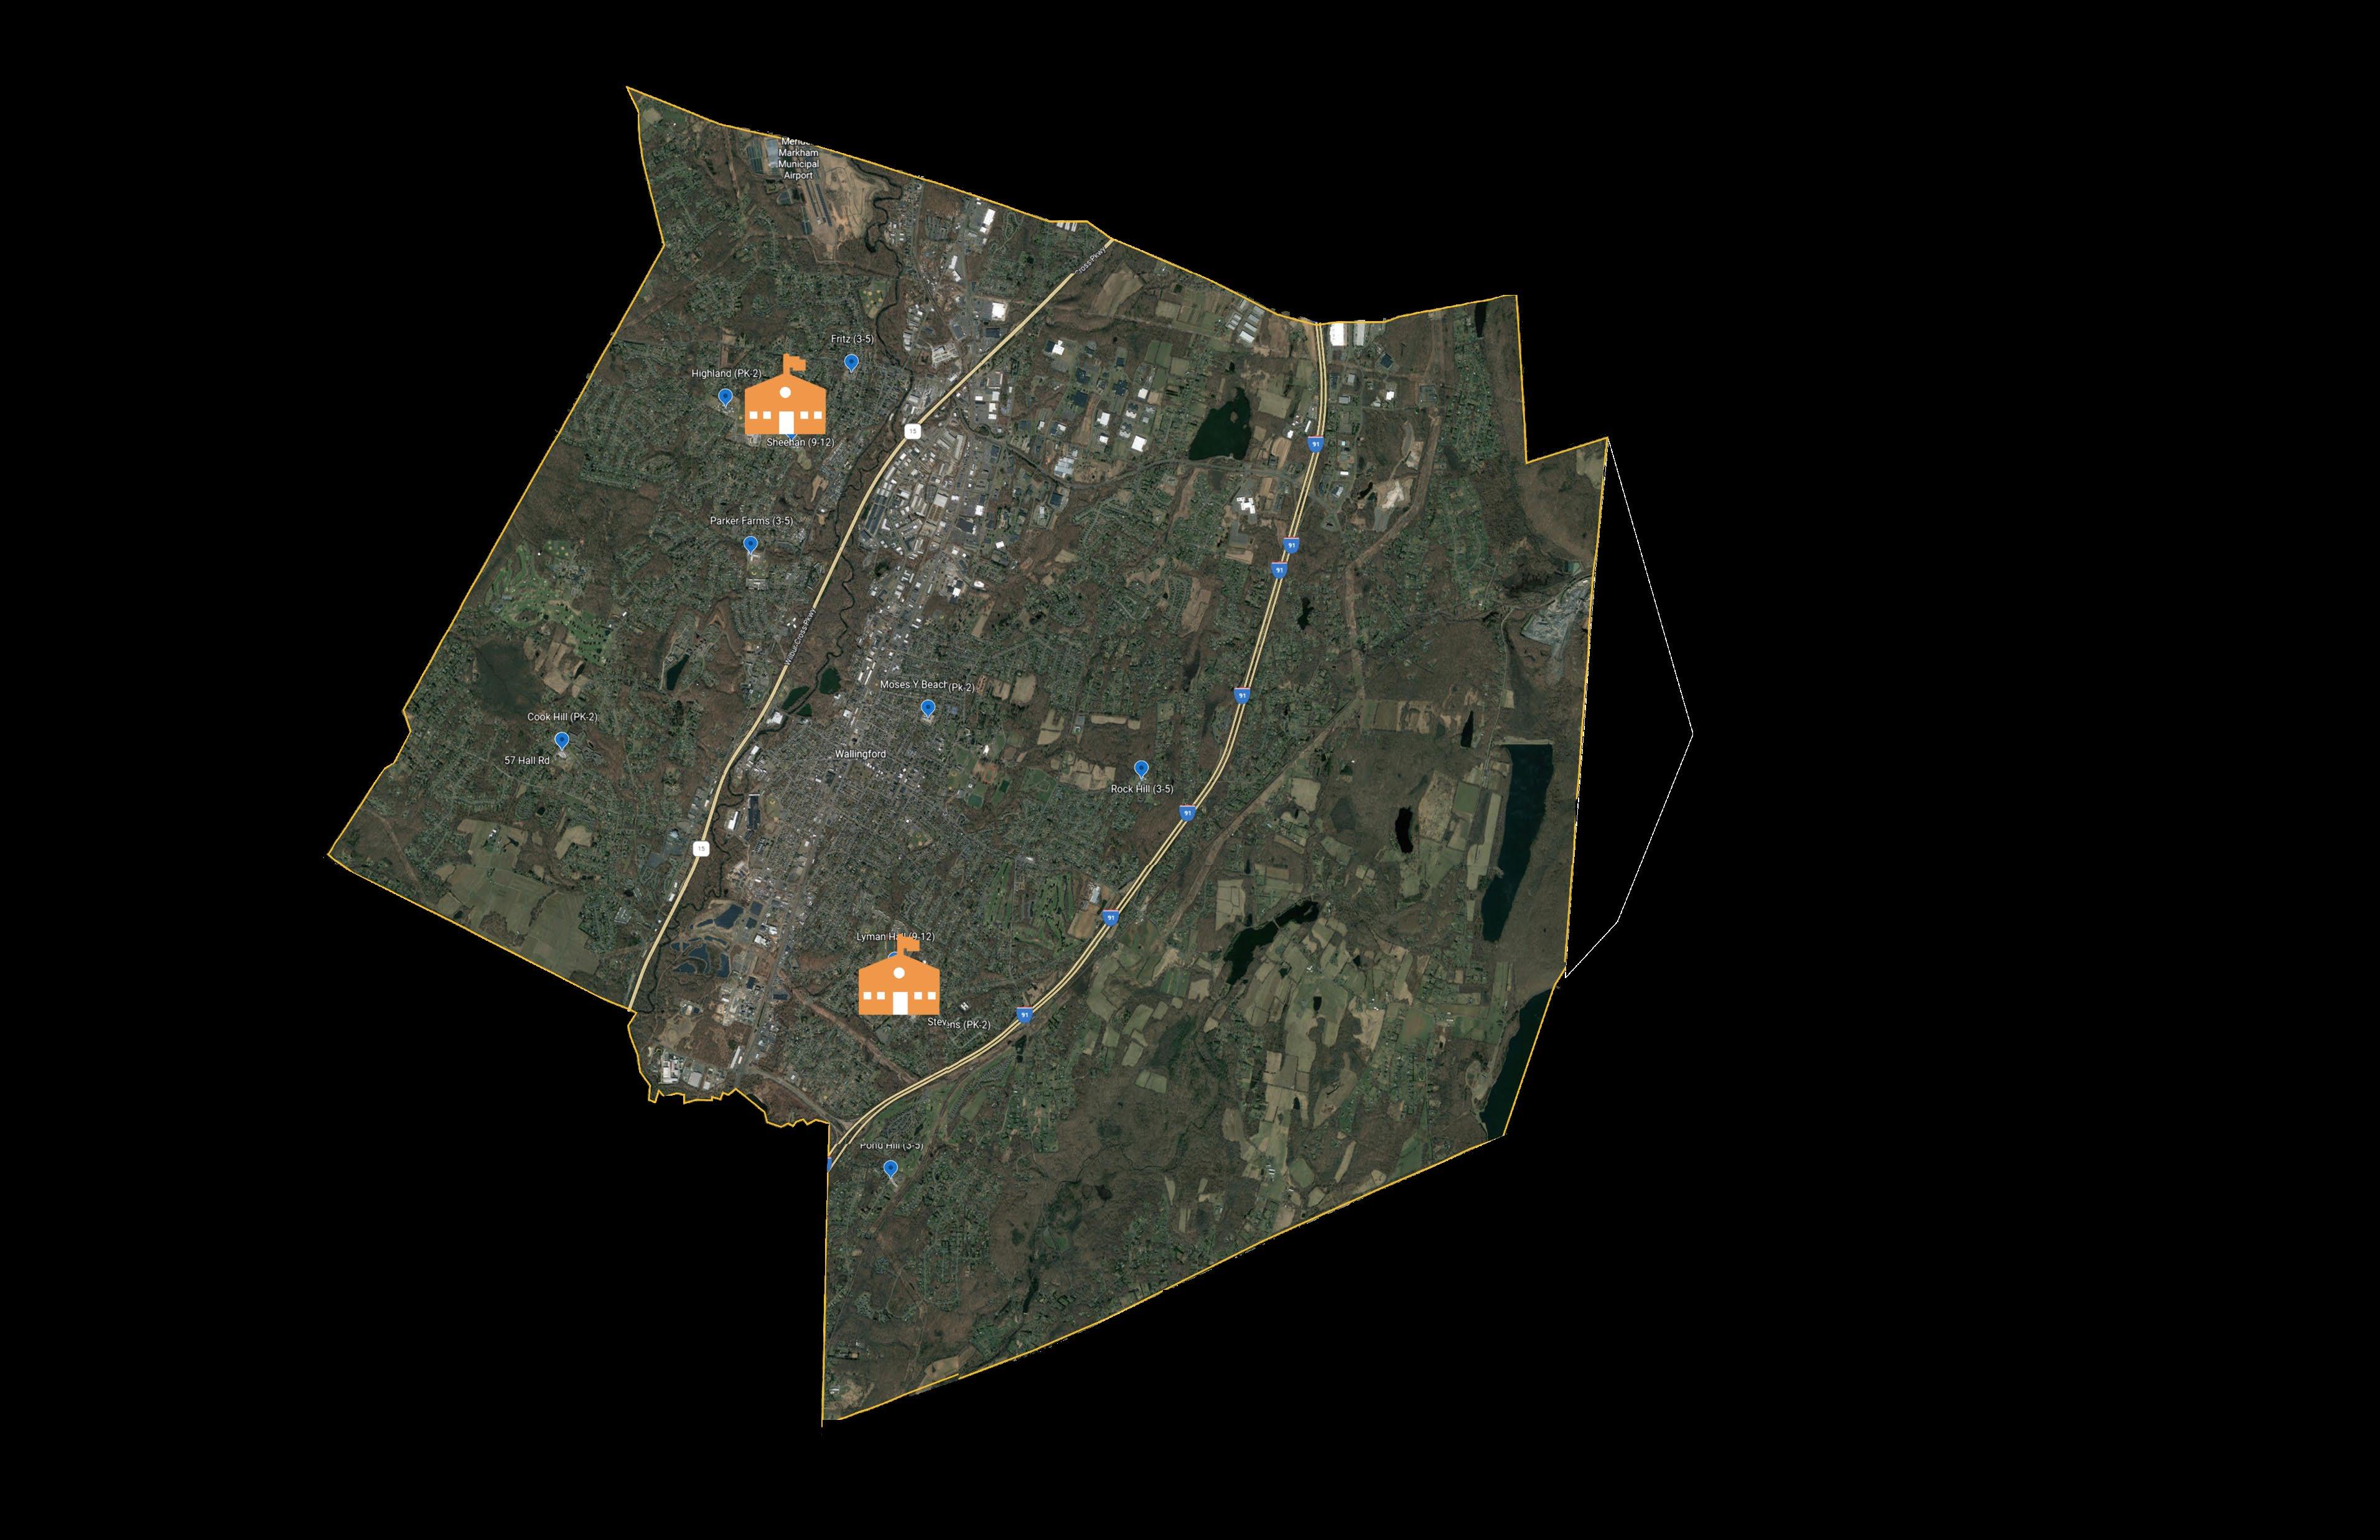
• Cook Hill • Highland • Moses Y Beach • Stevens 17
Elementary Schools: PreK
Grade 2 Elementary Schools Summary

Highland Stevens
Cook Hill Moses Y Beach
–
18
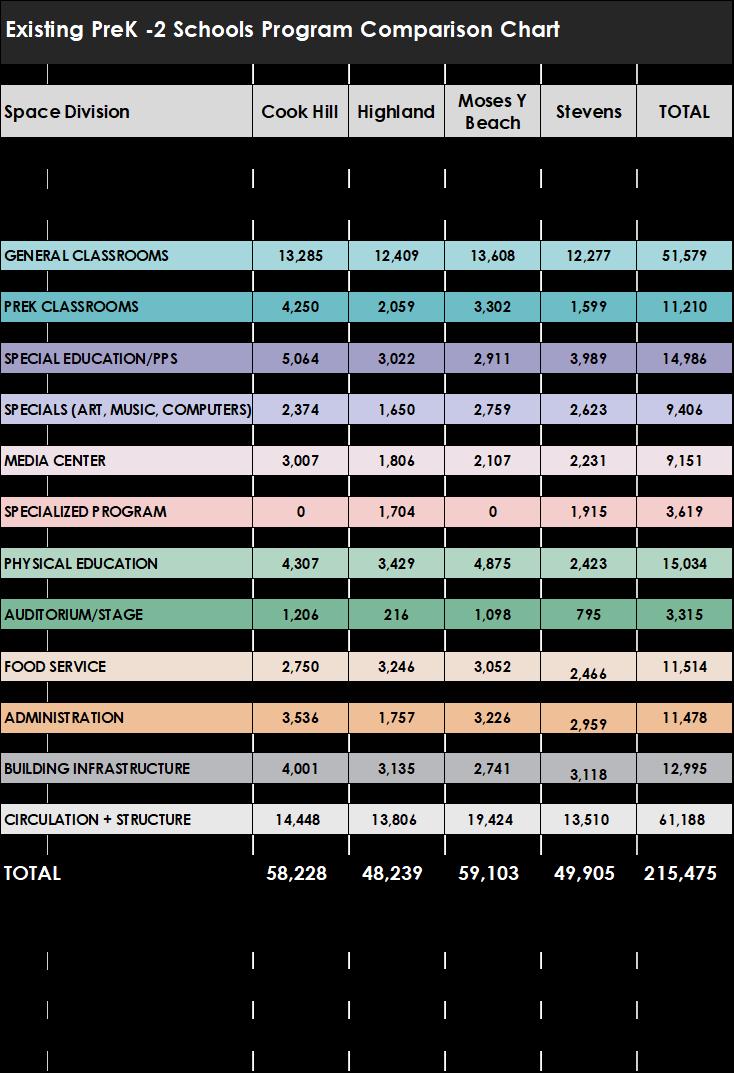
Elementary Schools: PreK – Grade 2 Elementary Schools Summary Recommended Improvements: • Portables at Cook Hill (1989,1993,1998) • HVAC at all • Restrooms at all • STARS at Stevens Existing PreK -2 Schools Program Comparison Chart Space Division Cook Hill Highland Moses Y Beach Stevens TOTAL 1964/20021958/20021951/20021962/2002 311 3042972891,201 GENERAL CLASSROOMS 13,28512,40913,60812,27751,579 PREK CLASSROOMS 4,2502,0593,3021,59911,210 SPECIAL EDUCATION/PPS 5,0643,0222,9113,98914,986 SPECIALS (ART, MUSIC, COMPUTERS) 2,3741,6502,7592,6239,406 MEDIA CENTER 3,0071,8062,1072,2319,151 WISE STARS SPECIALIZED PROGRAM 0 1,704 0 1,9153,619 PHYSICAL EDUCATION 4,3073,4294,8752,42315,034 AUDITORIUM/STAGE 1,2062161,0987953,315 FOOD SERVICE 2,7503,2463,052 2,466 11,514 ADMINISTRATION 3,5361,7573,226 2,959 11,478 BUILDING INFRASTRUCTURE 4,0013,1352,741 3,118 12,995 CIRCULATION + STRUCTURE 14,44813,80619,42413,51061,188 TOTAL 58,22848,23959,10349,905215,475 47,75037,87541,50041,375168,500 10,47810,36417,6038,53046,975 MAX PROGRAMMED CAPACITY 4263514113511539 CURRENT UTILIZATION RATE 90%86%81%90%87% AVERAGE STATE STANDARDS CURRENT ENROLLEMENT DIFFERENCE CONSTRUCTION/ADDITION YEAR PreK - 2 Schools Cost Needs Comparison Chart Cook Hill Highland Moses Y Beach Stevens TOTAL STRATEGIC & CAPITAL NEEDS 429,664$ 786,748$ 633,989$ 1,012,284$ 2,862,685$ 11,055,188$ 3,515,438$ 3,835,000$ 4,620,313$ 23,025,938$ TOTAL 11,484,852$ 4,302,186$ 4,468,989$ 5,632,597$ 25,888,623$ 5,883,571$ 1,870,916$ 2,040,987$ 2,458,930$ 12,254,404$ ANTICIPATED TOWN SHARE* 5,254,499$ 2,657,664$ 2,674,976$ 3,050,922$ 13,638,061$ PAST SCG INVESTMENT 7,948,731$ 8,063,123$ 7,884,816$ 7,192,976$ 31,089,646$ PER: https://www.csde.state.ct.us/public/scgms/reports.asp RECOMMENDED IMPROVEMENTS & ALTERATIONS Maximum Reimbursement* * If projects follow the Office of School Construction Grants & Review (OSCG&R) process and are deemed fully eligible 19
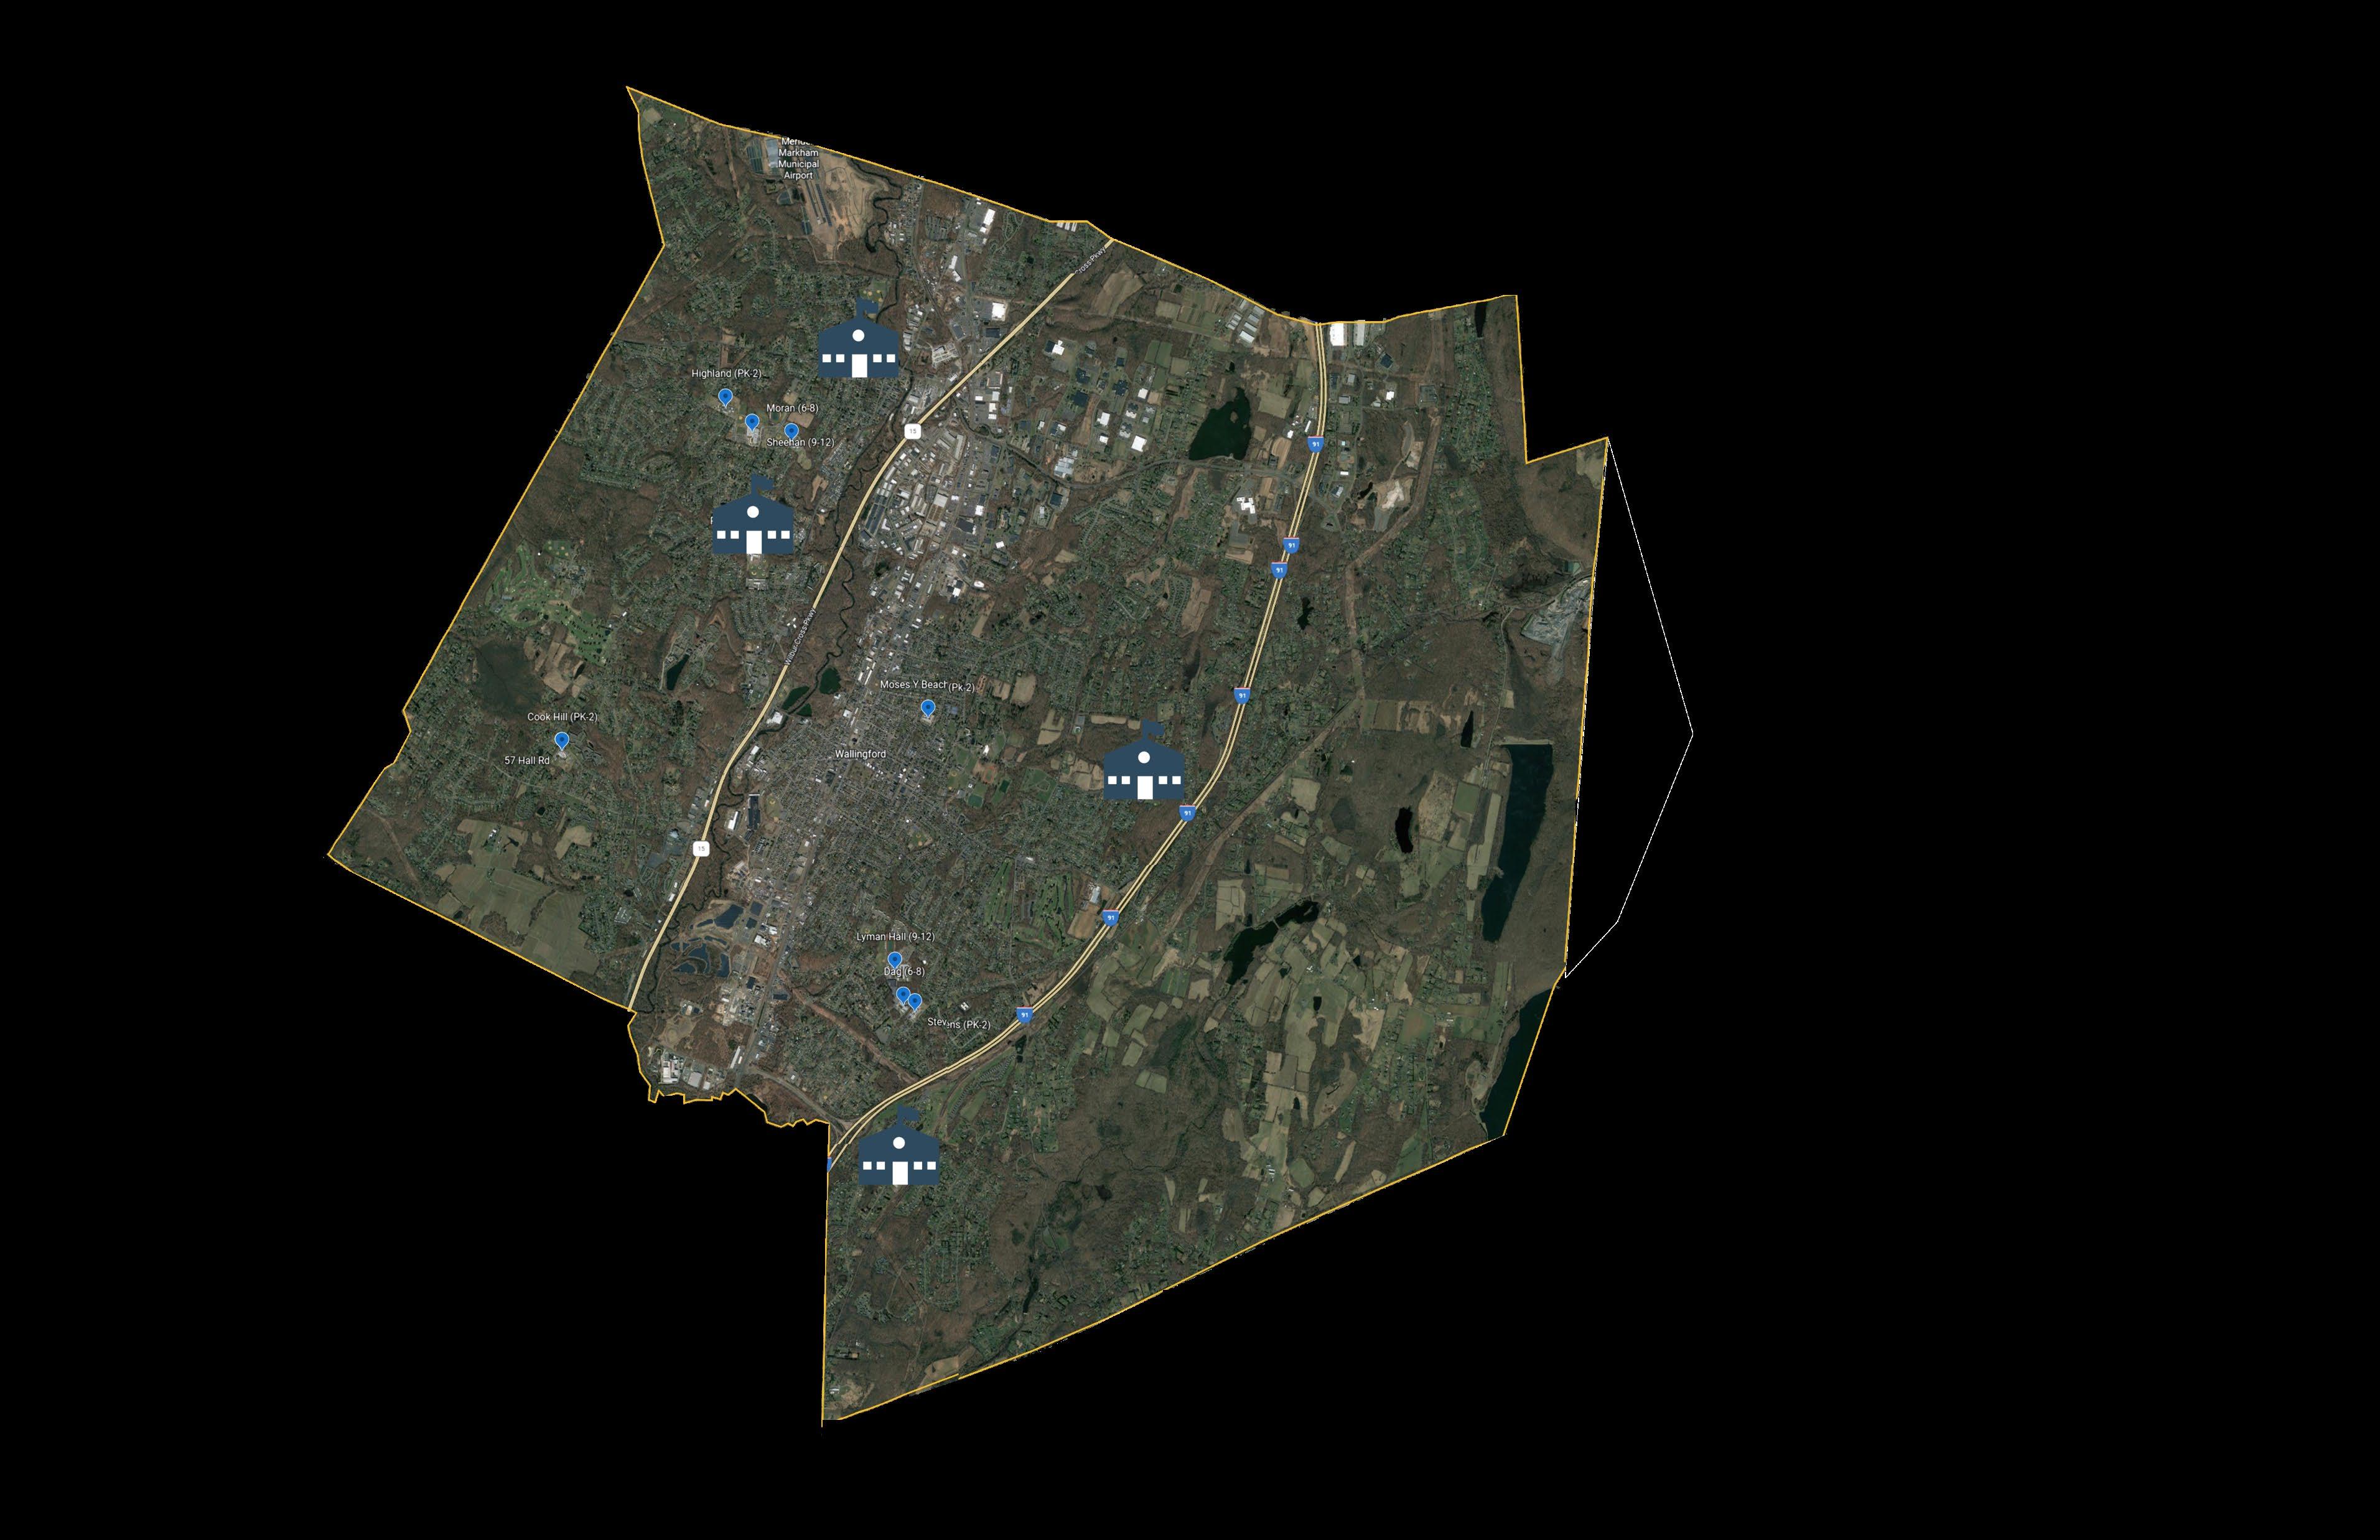
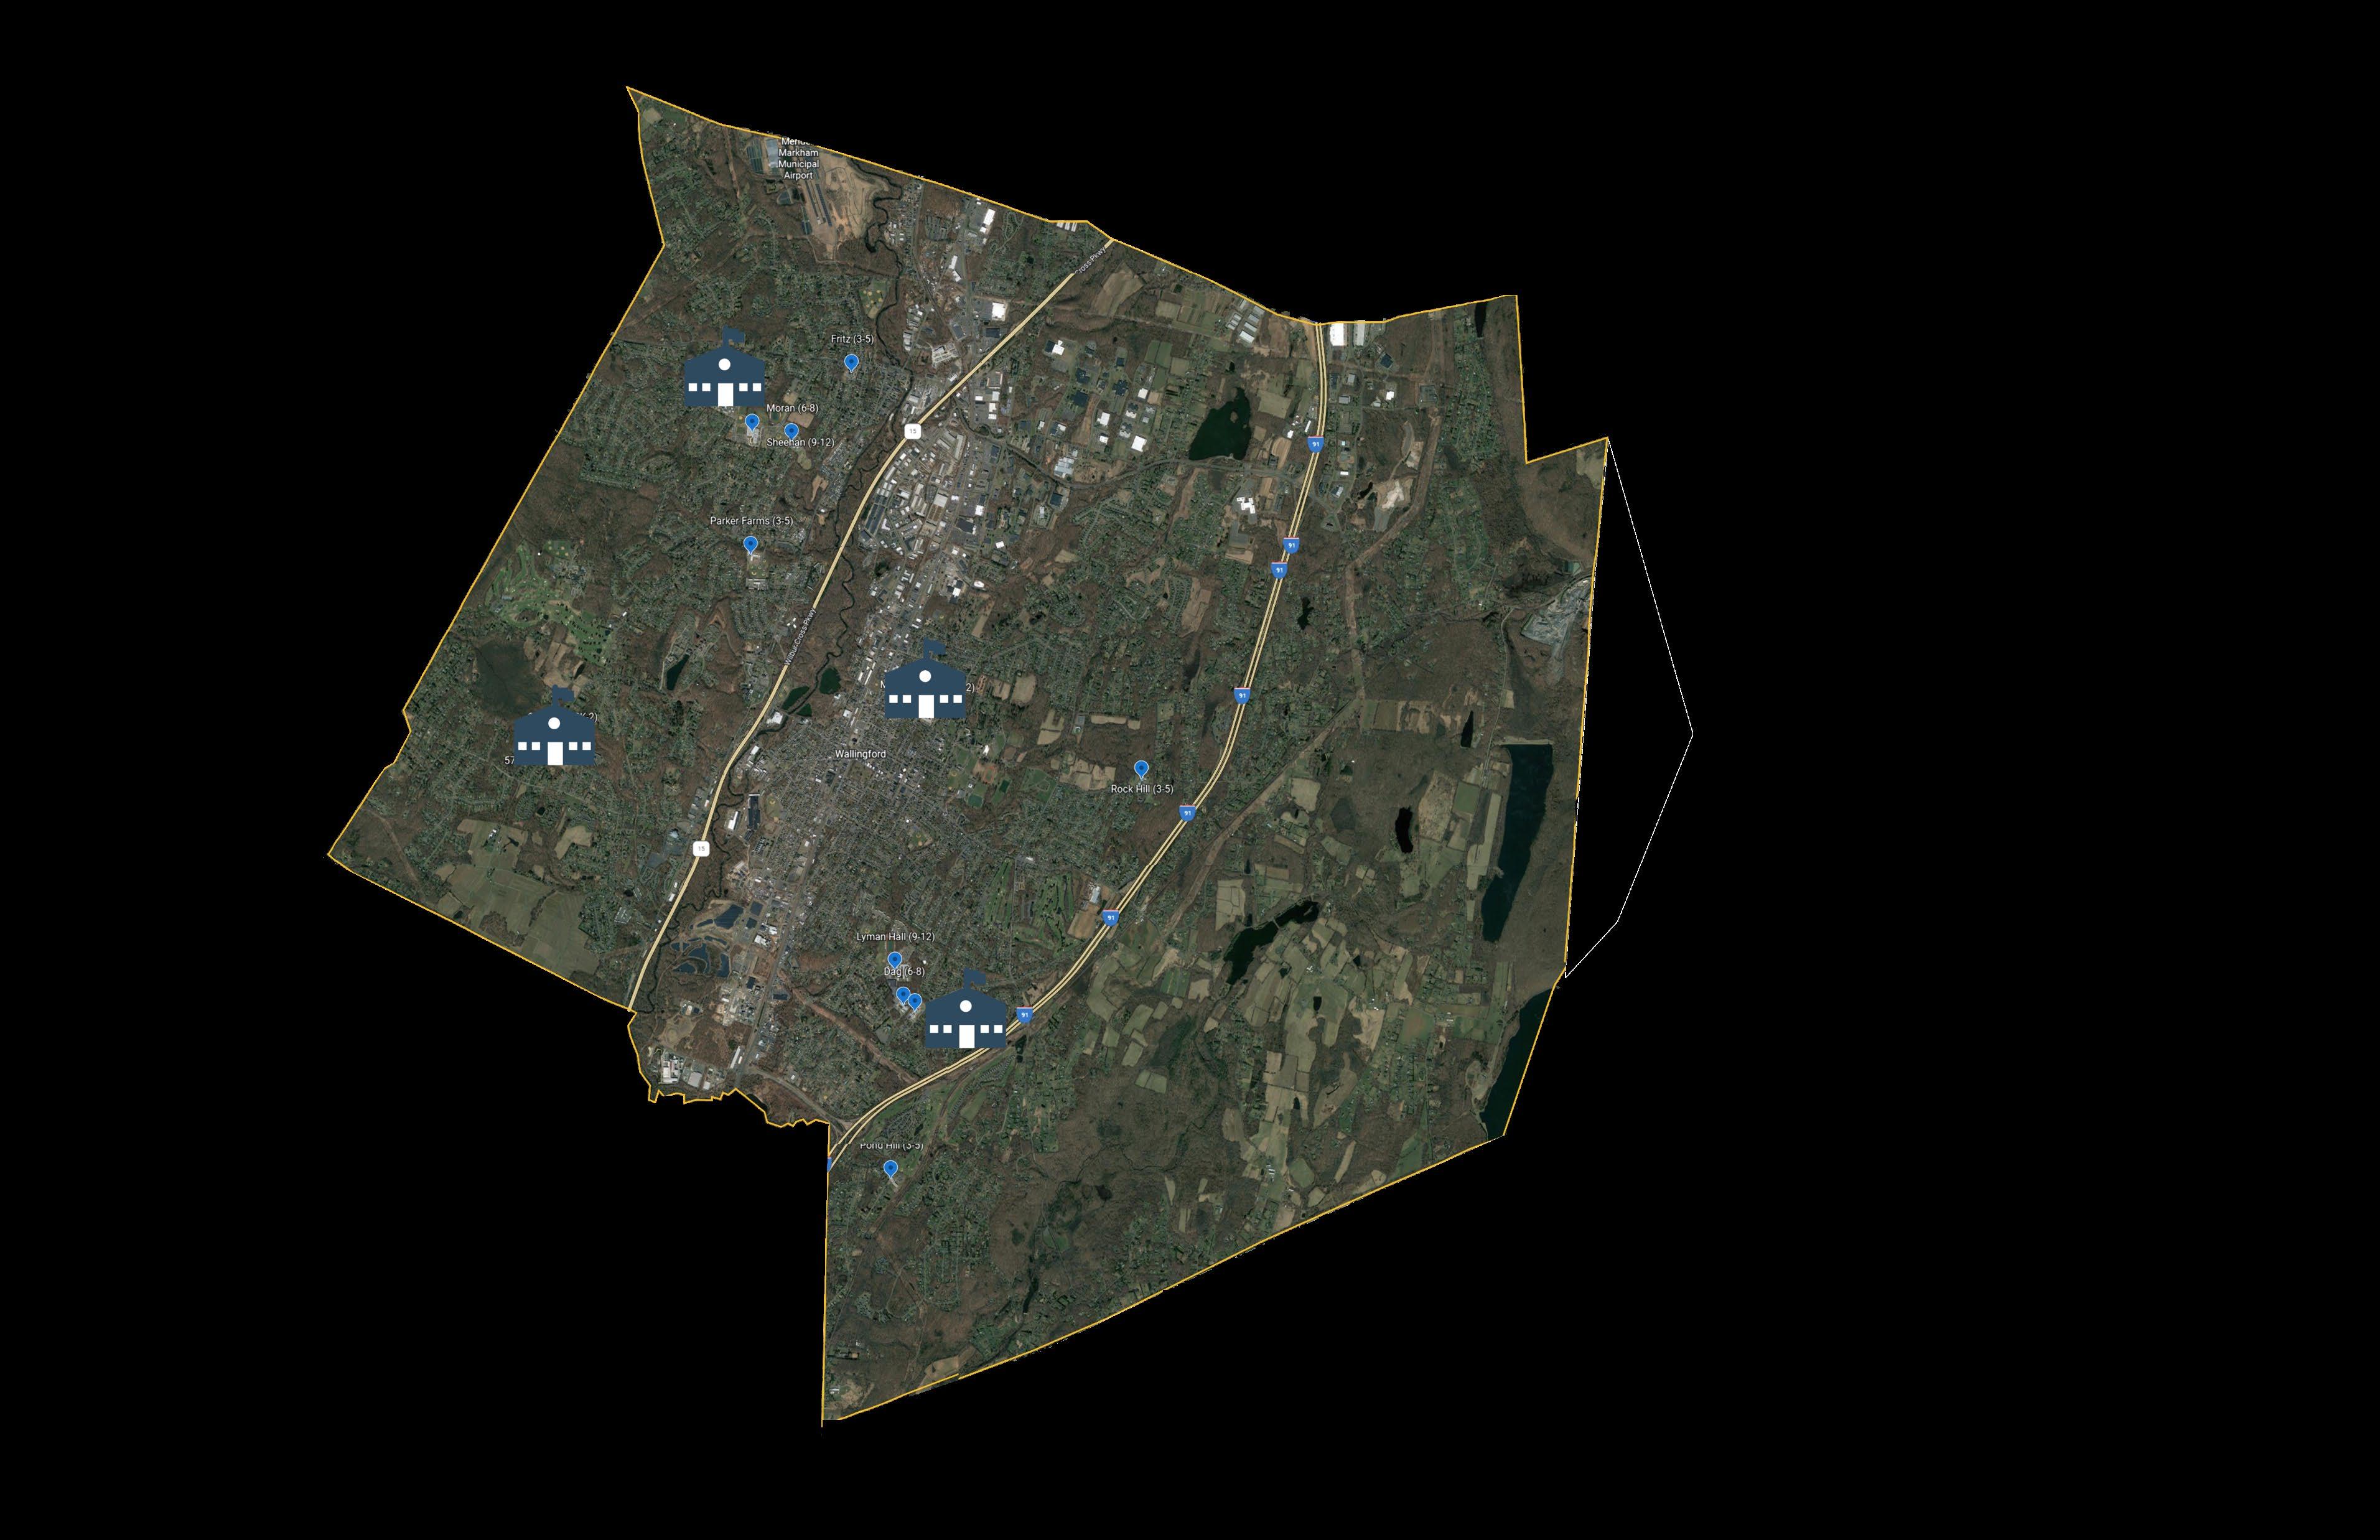
Elementary Schools: Grade 3 • Fritz • Parker Farms • Pond Hill • Rock Hill 20
Elementary Schools: Grade

Elementary Schools Summary
Grade
Pond Hill

Fritz
Rock Hill Parker Farms
3 –
5
21
Elementary Schools: Grade 3 – Grade 5 Elementary Schools Summary Existing 3-5 Schools Program Comparison Chart Space Division Fritz Parker Farms Pond Hill Rock Hill TOTAL 1925/19951955/20021968/20021959/2002 2952222533071,077 GENERAL CLASSROOMS 13,6438,99511,82112,94447,403 SPECIAL EDUCATION/PPS 3,3204,5806,6804,14318,723 4,8273,9212,8044,01415,566 MEDIA CENTER 3,9712,1842,1892,03910,383 WISE/CID Benhaven STARS SPECIALIZED PROGRAM 6,0811,5931,366 0 9,040 PHYSICAL EDUCATION 4,4373,1722,8873,25913,755 AUDITORIUM/STAGE 1,1687775622162,723 FOOD SERVICE 6,0972,5923,3143,40315,406 ADMINISTRATION 2,1183,6955,4982,15213,463 BUILDING INFRASTRUCTURE 3,7842,2092,9092,85211,754 CIRCULATION + STRUCTURE 19,37313,73510,05318,17261,333 TOTAL 68,81947,45350,08353,194219,549 36,25027,75031,62538,375134,000 32,56919,70318,45814,81985,549 MAX PROGRAMMED CAPACITY 3912993223681380 CURRENT UTILIZATION RATE 74%78%83%82%79% AVERAGE CONSTRUCTION/ADDITION YEAR CURRENT ENROLLEMENT STATE STANDARDS SPECIALS (ART, MUSIC, COMPUTERS, SPANISH) DIFFERENCE Recommended Improvements: • HVAC at all • Restrooms • Benhaven restroom 3-5 Schools Cost Needs Comparison Chart Fritz Parker Farms Pond Hill Rock Hill TOTAL STRATEGIC & CAPITAL NEEDS 1,318,851$ 747,746$ 791,180$ 694,239$ 3,552,016$ 4,120,625$ 2,788,938$ 3,264,375$ 4,031,438$ 14,205,375$ TOTAL 5,439,476$ 3,536,684$ 4,055,555$ 4,725,677$ 17,757,391$ 2,192,997$ 1,484,273$ 1,737,300$ 2,145,531$ 7,560,101$ ANTICIPATED TOWN SHARE* 3,246,479$ 2,052,411$ 2,318,255$ 2,580,145$ 10,197,290$ PAST SCG INVESTMENT 7,800,000$ 6,496,053$ 6,269,565$ 6,966,790$ 27,532,408$ PER: https://www.csde.state.ct.us/public/scgms/reports.asp RECOMMENDED IMPROVEMENTS & ALTERATIONS Maximum Reimbursement* * If projects follow the Office of School Construction Grants & Review (OSCG&R) process and are deemed fully eligible 22
Middle Schools: Grade 6
Dag
Moran
•
•
23
Middle

Grade
Middle Schools Summary
Schools:
6 – Grade 8
Dag Moran24
Middle Schools: Grade 6 – Grade 8 Middle Schools Summary Existing 6-8 Schools Program Comparison Chart Space Division Dag Moran TOTAL 1962/2002 1961/2002 593 581 1,174 GENERAL CLASSROOMS 22,319 24,819 47,138 SPECIAL EDUCATION/PPS 9,175 11,040 20,215 8,779 9,409 18,188 MEDIA CENTER 7,049 7,049 14,098 SPECIALIZED PROGRAM 2,576 1,235 3,811 PHYSICAL EDUCATION 10,512 10,999 21,511 AUDITORIUM/STAGE 9,639 5,187 14,826 FOOD SERVICE 7,705 8,001 15,706 ADMINISTRATION 4,470 4,540 9,010 BUILDING INFRASTRUCTURE 8,712 8,034 16,746 CIRCULATION + STRUCTURE 28,966 25,187 54,153 TOTAL 119,902 115,500235,402 84,898 83,480 168,378 35,004 32,020 67,024 MAX PROGRAMMED CAPACITY 690 736 1426 CURRENT UTILIZATION RATE 86% 79% 82% AVERAGE CURRENT ENROLLEMENT SPECIALS (ART, MUSIC, TECH. FACS. COMP.) STATE STANDARDS DIFFERENCE CONSTRUCTION/ADDITION YEAR Recommended Improvements: • HVAC • Science Room improvements 6-8 Schools Cost Needs Comparison Chart Dag Moran TOTAL STRATEGIC & CAPITAL NEEDS 826,735$ 1,424,590$ 2,251,325$ 5,881,375$ 5,906,250$ 11,787,625$ TOTAL 6,708,110$ 7,330,840$ 14,038,950$ 2,216,278$ 2,271,888$ 4,488,166$ ANTICIPATED TOWN SHARE* 4,491,832$ 5,058,952$ 9,550,784$ PAST SCG INVESTMENT 7,895,531$ 7,406,179$ 15,301,710$ RECOMMENDED IMPROVEMENTS & ALTERATIONS Maximum Reimbursement* * If projects follow the Office of School Construction Grants & Review (OSCG&R) process and are deemed fully eligible 25
New
Middle Schools: Grade 6 – Grade 8 Middle Schools –Renovate as
Dag - Renovate as New Estimate Hard Costs Renovate As New - 119,902 sq ft 47,960,800$ Soft Costs Owner Contingency 2,398,040$ Project development/Professional Fees/FF&E 12,589,710$ Total Project Budget 62,948,550$ Reimbursement @ 53.22% 33,501,218$ Reduced reimbursement 23,720,892$ Cost to Wallingford 39,227,658$ Moran - Renovate as New Estimate Hard Costs Renovate As New - 115,500 sq ft 46,200,000$ Soft Costs Owner Contingency 2,310,000$ Project development/Professional Fees/FF&E 12,127,500$ Total Project Budget 60,637,500$ Reimbursement @ 53.22% 32,271,278$ Reduced reimbursement 23,324,718$ Cost to Wallingford 37,312,782$ 26
Middle Schools
Renovate as New or Alterations
Major Considerations
focused improvements Building wide Improved educational programming
A/C with remainder of existing infrastructure to remain
A/C with all new infrastructure and te chnology
Construction - Limited impact on school
Construction - Major impact on school. Phasing or Portables for a few years
projects follow the Office of School Construction Grants & Review (OSCG&R) process and are deemed fully eligible
Middle Schools: Grade 6 – Grade 8
–
Options Alterations Renovate as New Total Cost 14,038,950$ 123,586,050$ Maximum Reimbursement* 4,488,166$ 47,045,610$ Anticipated Wallingford Share* 9,550,784$ 76,540,440$ Limited
Full
Full
* I f
27
High Schools: Grade 9
Lyman Hall
Sheehan
•
•
28


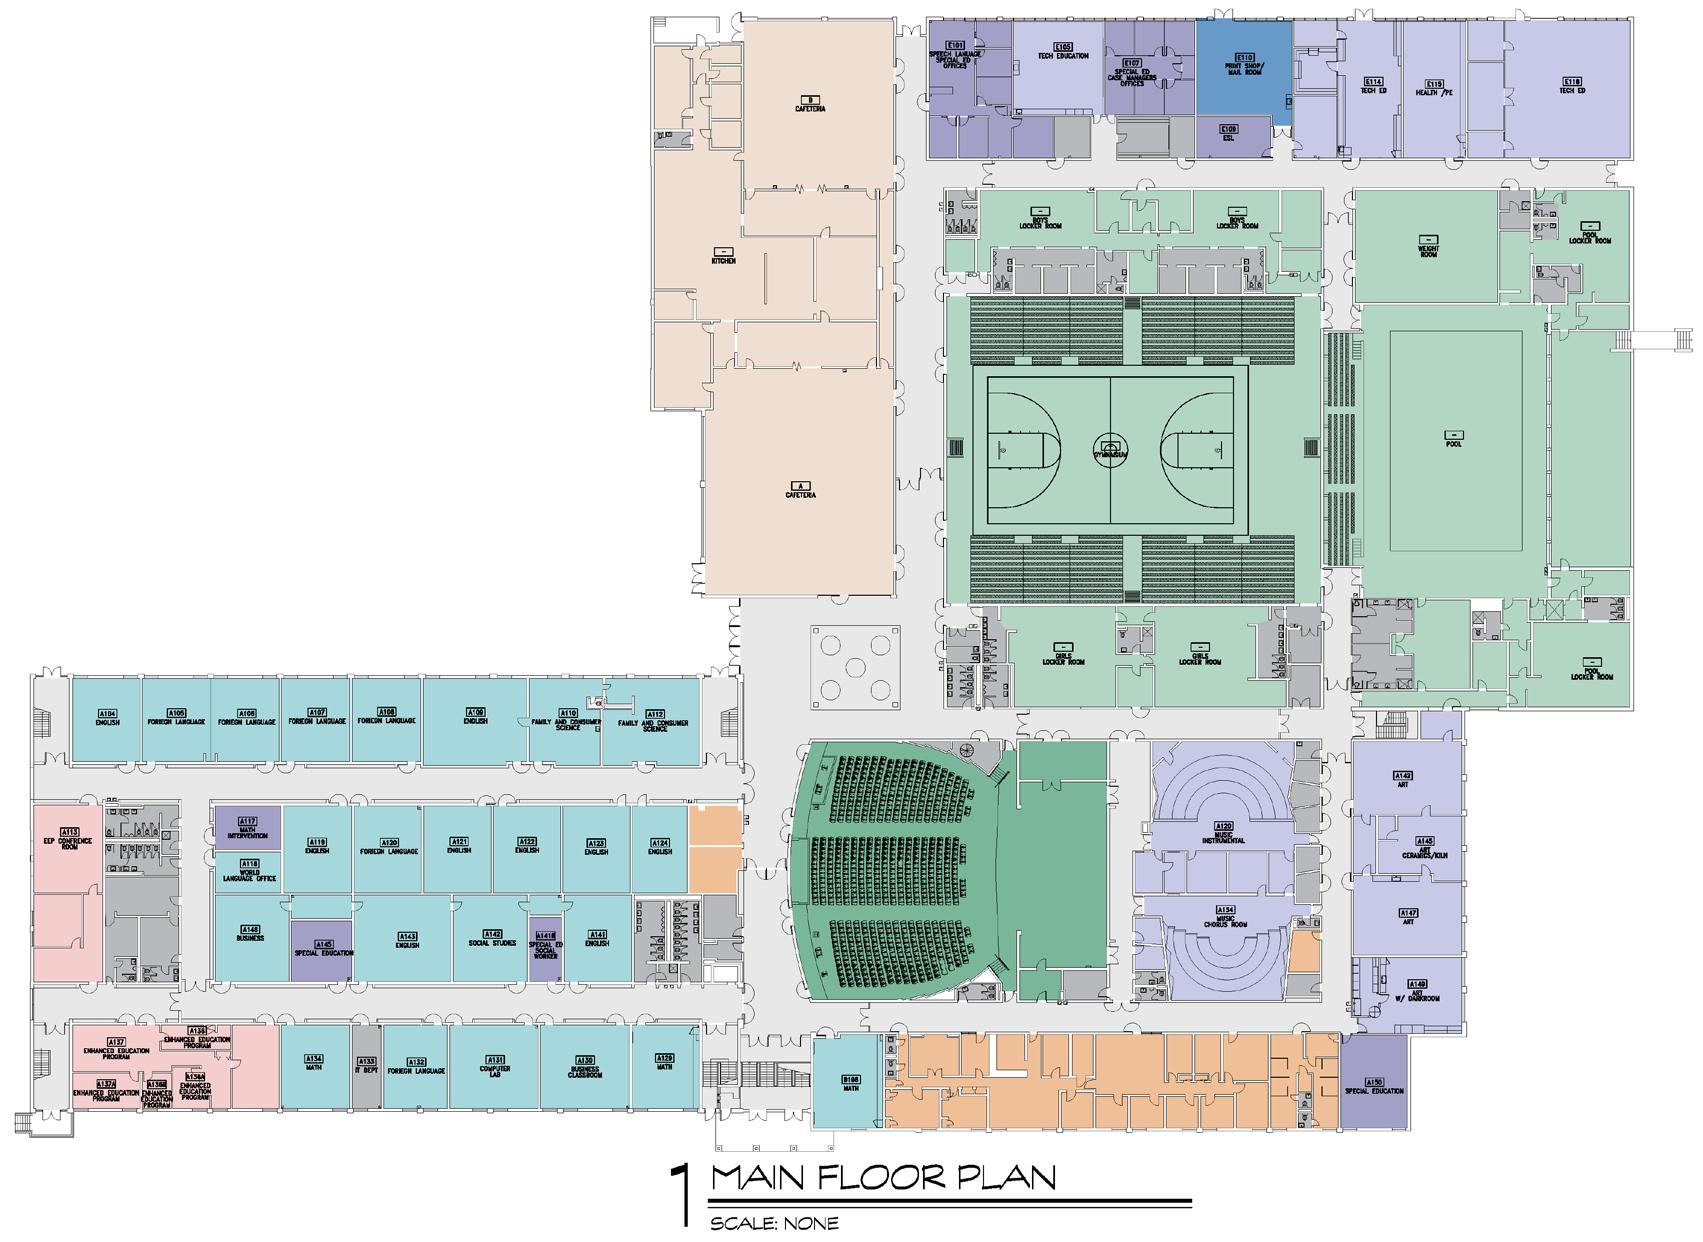
High Schools: Grade 9 – Grade 12 Lyman Hall High School Existing Lyman Hall High School (9 -12) (NIC VoAg) Additions: 2002 Existing Enrollment: 953 Students Construction: 1968 Space Division Quantity Square footage Subtotal Average Percentage GENERAL CLASSROOMS 50483-1831 40,210 80420% SPECIAL EDUCATION/PPS 20229-987 4,800 240 2% SPECIALS (ART, MUSIC, CTE) 20680-1796 21,700 108511% MEDIA CENTER 1 9,907 9907 5% ARTS PROGRAM 8 5,697 712 3% PHYSICAL EDUCATION 4 20,592 514810% AUDITORIUM/STAGE 1 9,363 9363 5% FOOD SERVICE 3 12,150 4050 6% ADMINISTRATION 1997-646 7,206 379 4% BUILDING INFRASTRUCTURE 15,266 8% CIRCULATION + STRUCTURE 52,111 26% TOTAL 199,002 162,963 DIFFERENCE 36,039 Max Classroom Capacity 1250 Max Class Size Policy 25 Classroom Quantity 50 Total Max Programed Capacity 1250 Current Utilization 76% CONNECTICUT STATE SPACE STANDARD SPECIFICATIONS FOR 953 GRADE 9-12 STUDENTS 20% 2% 11% 5% 3% 10%5% 6% 4% 8% 26% CORE LEARNING 52% SCHOOL SUPPORT 14% FACILITY SUPPORT 34% 29


Lyman Hall High School Recommended Improvements and Alterations Science Renovations 3,120,000$ Gym Addition and locker room renovation 8,300,000$ Culinary Improvements 600,000$ Classroom modifications: casework 400,000$ Math 360 white boards 100,000$ Music storage 60,000$ Art - storage, sinks 20,000$ World Language Lab 360,000$ Career Center 420,000$ TV production 200,000$ CTE improvements 500,000$ Medical Fragile Classroom 200,000$ HVAC 4,975,050$ Construction Subtotal 19,255,050$ Soft Costs @ 25% 4,813,763$ TOTAL 24,068,813$ School Construction Reimbursement Rate @ 53.22% 12,809,422$ Maximum Reimbursement* 10,489,653$ ANTICIPATED TOWN SHARE 13,579,160$ * I f projects follow the Office of School Construction Grants & Review (OSCG&R) process and are deemed fully eligible High Schools: Grade 9 – Grade 12 Lyman Hall High School SCIENCE GYM CULINARY $2,889,522 $24,068,813 $$10,000,000 $20,000,000 $30,000,000 Lyman Hall Projected Improvement Costs $26,958,335 RECOMMENDED ALTERATIONS CAPITAL NEEDS/STRATEGIC PLANNING 30


Existing Sheehan High School (9 -12) Additions: 2002 Existing Enrollment: 738 Students Construction: 1971 Space Division Quantity Square footage Subtotal Average Percentage GENERAL CLASSROOMS 50663-1496 43,279 86620% SPECIAL EDUCATION/PPS 18238-858 5,211 290 2% SPECIALS (ART, MUSIC, CTE) 10957-1580 15,724 1572 7% MEDIA CENTER 1 6,084 6084 3% ARTS & ABC PROGRAM 8 3,354 419 2% PHYSICAL EDUCATION & POOL 8 36,892 461217% AUDITORIUM/STAGE/PLANTARIUM 3 10,379 3460 5% FOOD SERVICE 3 14,223 4741 7% ADMINISTRATION 2097-481 4,902 245 2% DISTRICT OFFICES - IT & MAIL 5 135-1084 2,576 515 1% BUILDING INFRASTRUCTURE 13,923 6% CIRCULATION + STRUCTURE 60,488 28% TOTAL 217,035 127,674 DIFFERENCE Max Classroom Capacity 1250 Max Class Size Policy 25 Classroom Quantity 50 Total Max Programed Capacity 1250 Current Utilization 59% CONNECTICUT STATE SPACE STANDARD SPECIFICATIONS FOR 738 GRADE 9-12 STUDENTS 20% 2% 7% 3% 2% 17%5% 7% 1%2% 6% 28% CORE LEARNING 51% SCHOOL SUPPORT 15% FACILITY SUPPORT 34% High Schools: Grade 9 – Grade 12 Sheehan High School 31


High Schools: Grade 9 – Grade 12 Sheehan High School SCIENCE $7,604,725 $18,094,844 $$10,000,000 $20,000,000 $30,000,000 Sheehan Projected Improvement Costs$25,699,569 RECOMMENDED ALTERATIONS CAPITAL NEEDS/STRATEGIC PLANNING Sheehan High School Recommended Improvements and Alterations Science Renovations 3,600,000$ Gym Locker room renovations 1,400,000$ Culinary Improvements 600,000$ Classroom modifications: casework 400,000$ Main office modifications and counseling expansion 800,000$ ARTS/ABC - science room 480,000$ Math 360 white boards 100,000$ Music - acoustic improvement and storage 160,000$ Art - storage, sinks 30,000$ World Language Lab 360,000$ Career Center 420,000$ TV production 200,000$ CTE improvements 300,000$ Medical Fragile Classroom 200,000$ HVAC 5,425,875$ Construction Subtotal 14,475,875$ Soft Costs @ 25% 3,618,969$ TOTAL 18,094,844$ School Construction Reimbursement Rate @ 53.22% 9,630,076$ Reduced Reimbursement* 5,665,032$ ANTICIPATED TOWN SHARE 12,429,811$ * I f projects follow the Office of School Construction Grants & Review (OSCG&R) process and are deemed fully eligible UNDERSIZED ADMIN 32
High Schools: Grade 9 – Grade 12 High Schools Summary Existing 9-12 Schools Program Comparison Chart Space Division Lyman Hall Sheehan TOTAL 1957/2002 1971/2002 953 738 1,691 GENERAL CLASSROOMS 40,210 43,279 83,489 SPECIAL EDUCATION/PPS 4,800 5,211 10,011 21,700 15,724 37,424 MEDIA CENTER 9,907 6,084 15,991 SPECIALIZED PROGRAM 5,697 3,354 9,051 PHYSICAL EDUCATION 20,592 36,892 57,484 AUDITORIUM/STAGE 9,363 10,379 19,742 FOOD SERVICE 12,150 14,223 26,373 ADMINISTRATION 7,206 4,902 12,108 DISTRICT OFFICES - IT & MAIL 0 2,576 2,576 BUILDING INFRASTRUCTURE 15,266 13,923 29,189 CIRCULATION + STRUCTURE 52,111 60,488 112,599 TOTAL 199,002 217,035416,037 162,963 127,674 290,637 36,039 89,361 125,400 MAX PROGRAMMED CAPACITY 1250 1250 2500 CURRENT UTILIZATION RATE 76% 59% 68% CURRENT ENROLLEMENT SPECIALS (ART, MUSIC, TECH. FACS. COMP.) STATE STANDARDS DIFFERENCE CONSTRUCTION/ADDITION YEAR Existing 9-12 Schools Cost Needs Comparison Chart Lyman Hall Sheehan TOTAL STRATEGIC & CAPITAL NEEDS 2,889,522$ 7,604,725$ 10,494,247$ 24,068,813$ 18,094,844$ 42,163,656$ TOTAL 26,958,335$ 25,699,569$ 52,657,903$ 10,489,653$ 5,665,032$ 16,154,685$ ANTICIPATED TOWN SHARE* 16,468,682$ 20,034,536$ 36,503,218$ PAST SCG INVESTMENT 22,832,765$ 14,740,433$ 37,573,198$ PER: https://www.csde.state.ct.us/public/scgms/reports.asp RECOMMENDED IMPROVEMENTS & ALTERATIONS Maximum Reimbursement* * If projects follow the Office of School Construction Grants & Review (OSCG&R) process and are deemed fully eligible 33
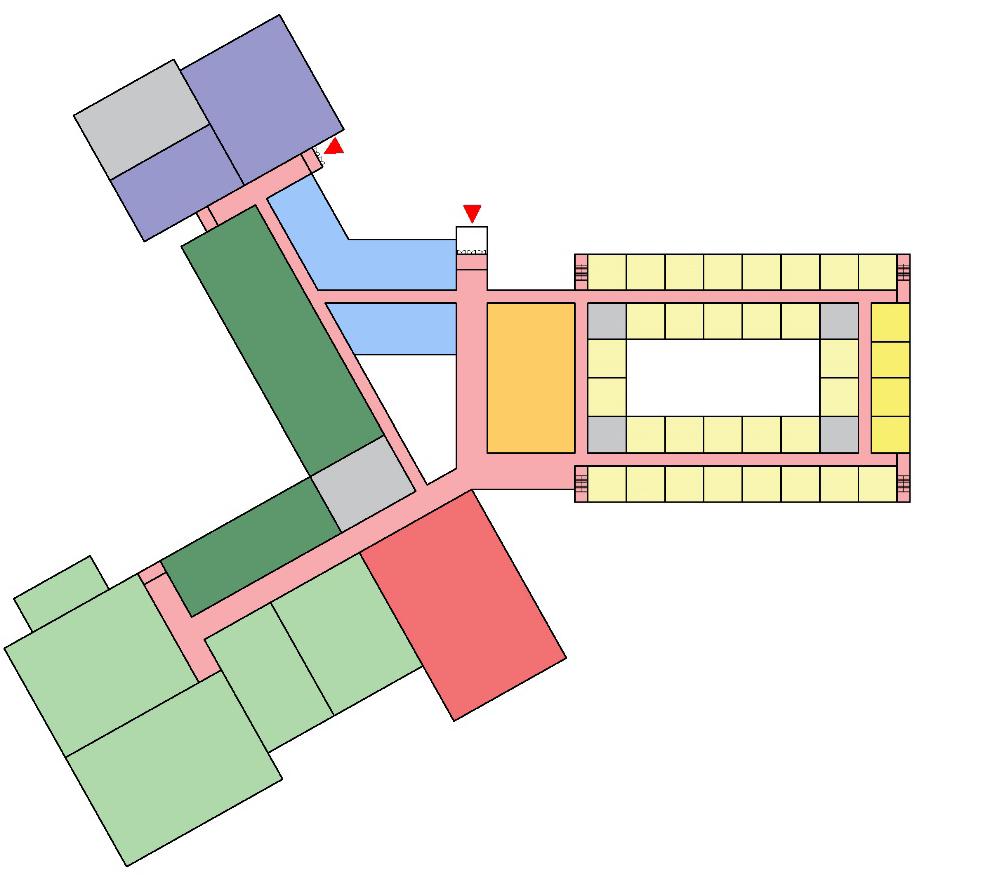

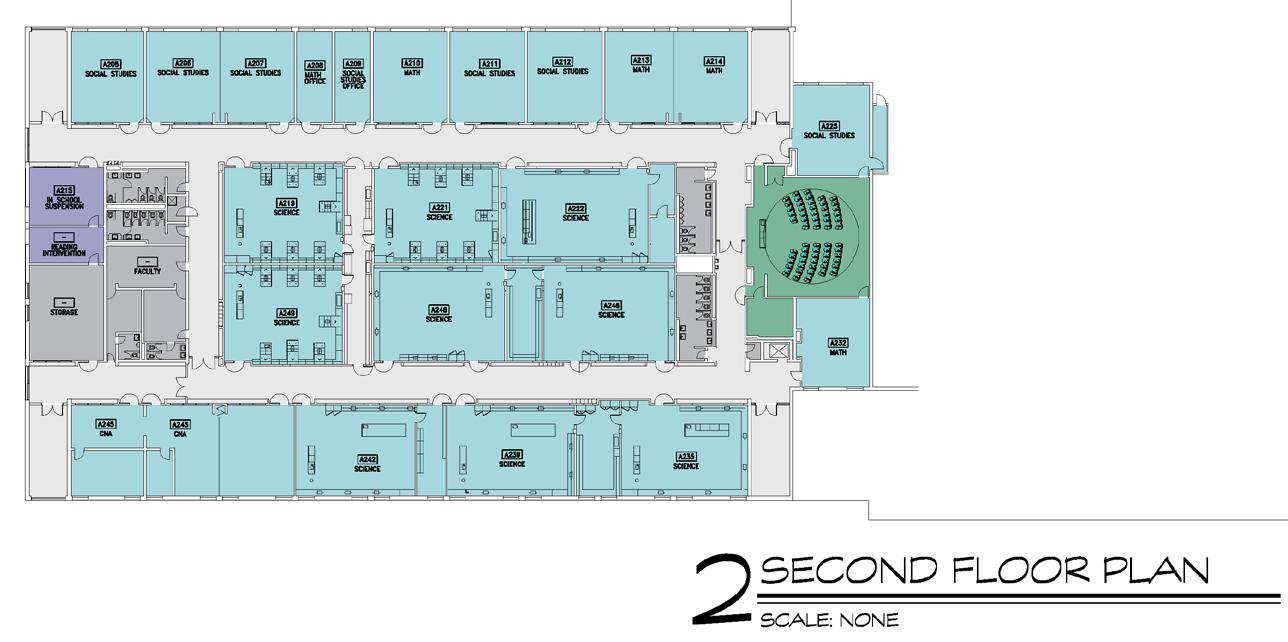
SPECIALS Art Art Studios 335 1,5007,500 Storage & support 25 4002,000 Music Band 11 1 2,5002,500 Instrumental 1 1 2,5002,500 Chorus 11 2 2,0004,000 Music Lab 1 800 800 Storage, practice, support 41 1,5001,500 Tech Education Tech Class/Lab/Shop 548 1,50012,000 Storage & support 5 3501,750 FACS Education Culinary Kitchen 1 1 2,0002,000 Culinary Dining Room 1 1 600 600 FACS Classroom 323 1,2003,600 Storage & support 2 250 500 Business Classrooms 21 3 800 2,400 Storage & support 2 200 400 TOTAL 151123 44,050 PHYSICAL EDUCATION Gymnasium 1 111 10,00010,000 Gymnasium 2 1 10,00010,000 Lockers 3 8,000 PE/Health Classroom 122 8001,600 Fitness/PE 2 3,000 Pool 1 10,000 Field House/Concession 2,000 TOTAL 44,600 FOOD SERVICE Cafeteria 2 1 8,0008,000 Kitchen & Support 1 1 7,0007,000 TOTAL 15,000 Seating Area 1 1 10,00010,000 Stage & back of house 1 1 4,0004,000 TOTAL 14,000 TOTAL 15,000 SUBTOTAL 247,550 35% TOTAL 86,643 PROBABLE OVERALL GROSS SQ FT BUILDING 334,193 State reimbursable square footage based on 1707 students: 286,557 AUDITORIUM BUILDING INFRASTRUCTURE CIRCULATION & STRUCTURE - GROSS SQ FT FACTOR High Schools: Grade 9 – Grade 12 High Schools – Consolidate to ONE? First Floor Plan 3 STORY CLASSROOM WINGCAFE MUSIC GYM POOL GYM ADMIN MEDA LOCKERS FIELD HOUSE KITCHEN COURTYARD N Quantity Square Footage Subtotal ADMINISTRATION TOTAL 16,000 CLASSROOMS - 24 students per classroom World Language Classroom 66 108008,000 Offices/Storage 112 5001,000 English Classroom 10 8 1580012,000 Offices/Storage 112 5001,000 Math Classroom 10 8 1580012,000 Offices/Storage 112 5001,000 Social Studies Classroom 88 1580012,000 Offices/Storage 112 5001,000 Science Laboratories (clabs) 10 9 151,60024,000 Prep 47 2001,400 Offices/Storage 112 5001,000 Chem. Storage 111 500 500 CNA Classroom 33 8002,400 TOTAL 505273 77,300 General Classrooms 324 8003,200 Medically Fragile 1 1 800 800 Intervention Room 121 800 800 Offices 56 2501,500 ARTS Program 66 108008,000 14,300 MEDIA CENTER Main Space 1 1 4,0004,000 Office 2 1 150 150 IMC 1 500 500 Storage 2 1 250 250 Computers 1 800 800 Makers Space 1 1 800 800 TV Studio 1 800 800 TOTAL 7,300 Wallingford Consolidated High School Conceptual Program SPECIAL EDUCATION TOTAL Proposed - 1707 studentsExisting Sheehan Existing Lyman Hall Space Division 34
High Schools: Grade 9 – Grade 12 High Schools – Alterations, Renovate as New, New Construction 1 New High School Conceptual Estimate based on 334,193 Gross Square Foot plan from previous study Hard Costs Building 167,096,500$ Site 12,000,000$ Demo 3,600,000$ Soft Costs Owner Contingency 9,134,825$ Project development/Professional Fees/FF&E 47,957,831$ Total Project Budget 239,789,156$ Reimbursement - 43.22% 103,636,873$ Reduced reimbursement 84,837,334$ Cost to Wallingford 154,951,823$ 2 High Schools - Renovate as New Estimate Hard Costs Lyman Renovate As New - 199,002 sq ft 79,600,800$ Sheehan Renovate As New - 217,035 sq ft 86,814,000$ Soft Costs Owner Contingency 8,320,740$ Project development/Professional Fees/FF&E 43,683,885$ Total Project Budget 218,419,425$ Reimbursement @ 53.22% 116,242,818$ Reduced reimbursement 81,205,431$ Cost to Wallingford 137,213,994$ 35
Alterations, Renovate as New, New Construction
Renovate as NewNew Construction
Public High Schools - 25 Highest Enrollment
ENROLLEMENT RATING DRG
Danbury High School 3,340 3/10
Greenwich High School 2,748 9/10
New Britain High School 2,286 1/10
West Hill High School 2,236 4/10
Trumbull High School 2,136 9/10
Norwich Free Academy 2,102 4/10
Southington High School 1,979 7/10
Glastonbury High School 1,92610/10
focused improvements & continued maintenance
Building wide Improved educational programming Building wide Improved educational programming Full A/C with remainder of existing infrastructure to remain
Full A/C with all new infrastructure and technology
Construction - Limited impact on school
Construction - Major impact on school. Phasing or Portables for a few years
Full A/C with all new infrastructure and technology
Construction - Less impact than Renovate as New but if built on Lyman Hall, impact to parking & fields
Underutilized buildings
Aesthetics, furniture and technology status quo
Opportunities to improve some utilization by expanding programs
Aesthetics improve, New Furniture and technology
Fully utilized - Designed based on needs
Aesthetics greatly improve, New Furniture and technology
Stamford High School 1,914 4/10
Staples High School 1,80310/10
Brien Mcmahon High School 1,710 3/10
East Hartford High School 1,675 2/10
Manchester High School 1,640 4/10
Hamden High School 1,616 4/10
Ridgefield High School 1,55810/10
West Haven High School 1,554 2/10
Wilbur Cross High School 1,547 1/10
Fairfield Ludlow High School 1,54610/10
Central High School 1,545 2/10
Enfield High School 1,520 5/10
Hall High School 1,491 9/10
Fairfield Warde High School 1,471 8/10
Norwalk High School 1,466 3/10
Operation Cost same / increase with HVAC
Operation Cost improve based on High Performance building criteria
Operation Cost improve by eliminating old buildings and build one right sized High Performance new building
the Office of School Construction Grants & Review (OSCG&R) process and are deemed
Conard High School 1,451 8/10
Amity Regional High School 1,444 8/10
High Schools: Grade 9 – Grade 12 High Schools –
CT
2022-2023 by Public School Review
1
H 2
B 3
I 4
H 5
B 6
H 7
D 8
B 9
H 10
A 11
H 12
H 13
G 14
G 15
A 16
H 17
I 18
B 19
I 20
F 21
B 22
B 23
H 24
B 25
B SCHOOL Options Alterations
Total Cost 52,827,903$ 218,419,425$ 239,789,156$ Maximum Reimbursement* 16,154,685$ 81,205,431$ 84,837,334$ Anticipated Wallingford Share* 36,673,218$ 137,213,994$ 154,951,823$ Limited
* I f projects follow
f ully eligible Major Considerations 36
District Programs & Central Office
Academy
Office
• Adult Ed • Transition
• Central
37
District Programs Adult Education Summary of Existing and Proposed Spaces REMARKS PersonnQuantityUnitTotalPersonnQuantityUnitTotal OFFICES 0840 Director'sOffice011120120 Technician'sOffice011120120 StaffOffice044100400 CouncilorOffice011100100 TestingOffice011100100 WORK STATIONS 00 GeneralOfficeArea000000 000000 SUPPORT AREAS 0473 ServerRoom00016464 JanitorCloset012525 ChildCareToilet00016464 MensToilet0001160160 WomensToilet0001160160 SERVICE AREAS 03640 Classroom045002,00015Students,24x36Desks ComputerLab0150050015Students,24x36Desks Kitchen01120120 Reception/Waiting01300300WaitingAreafor3People Registration01100100 ChildCare01450450 ConferenceRoom/WorkRoom01170170 STORAGE 0360 File/RecordStorage0001120120 GeneralStorage0001120120 MedicalProgramStorage0001120120 000000 EQUIPMENT 00 Copier000100Inofficearea SmartBoardTouchTVWallMtd.000500Ineachclassroomandcomputerlab PrintersatEachClassroom5 WallMtd.TVatReception000100 NET AREA SUBTOTAL 04840 ConstructionCirculation00000 NettoGrossRatio1.30 TOTAL GROSS AREA 5,980 6,292 ExistingLocation:WallingfordTrainStation NetAdditions GrossAdditions ADULT EDUCATION PROGRAM Summary of Existing and Proposed Spaces EXISTING - 11/2021 PROPOSED 38
Wallingford Transition Academy
TRANSITION ACADEMY
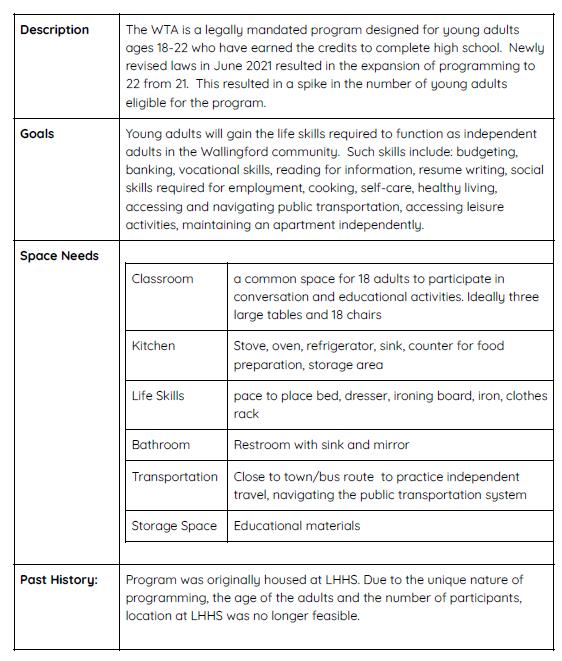
District Programs
Classroom 800 Kitchen 150 Life Skills 200 Bathroom 100 Storage 100 NET AREA SUBTOTAL 1350 Construction / Circulation 0 Gross Square Foot factor 30% Gross increase 405 TOTAL GROSS AREA 1,755 • Currently at Parker Farms 39
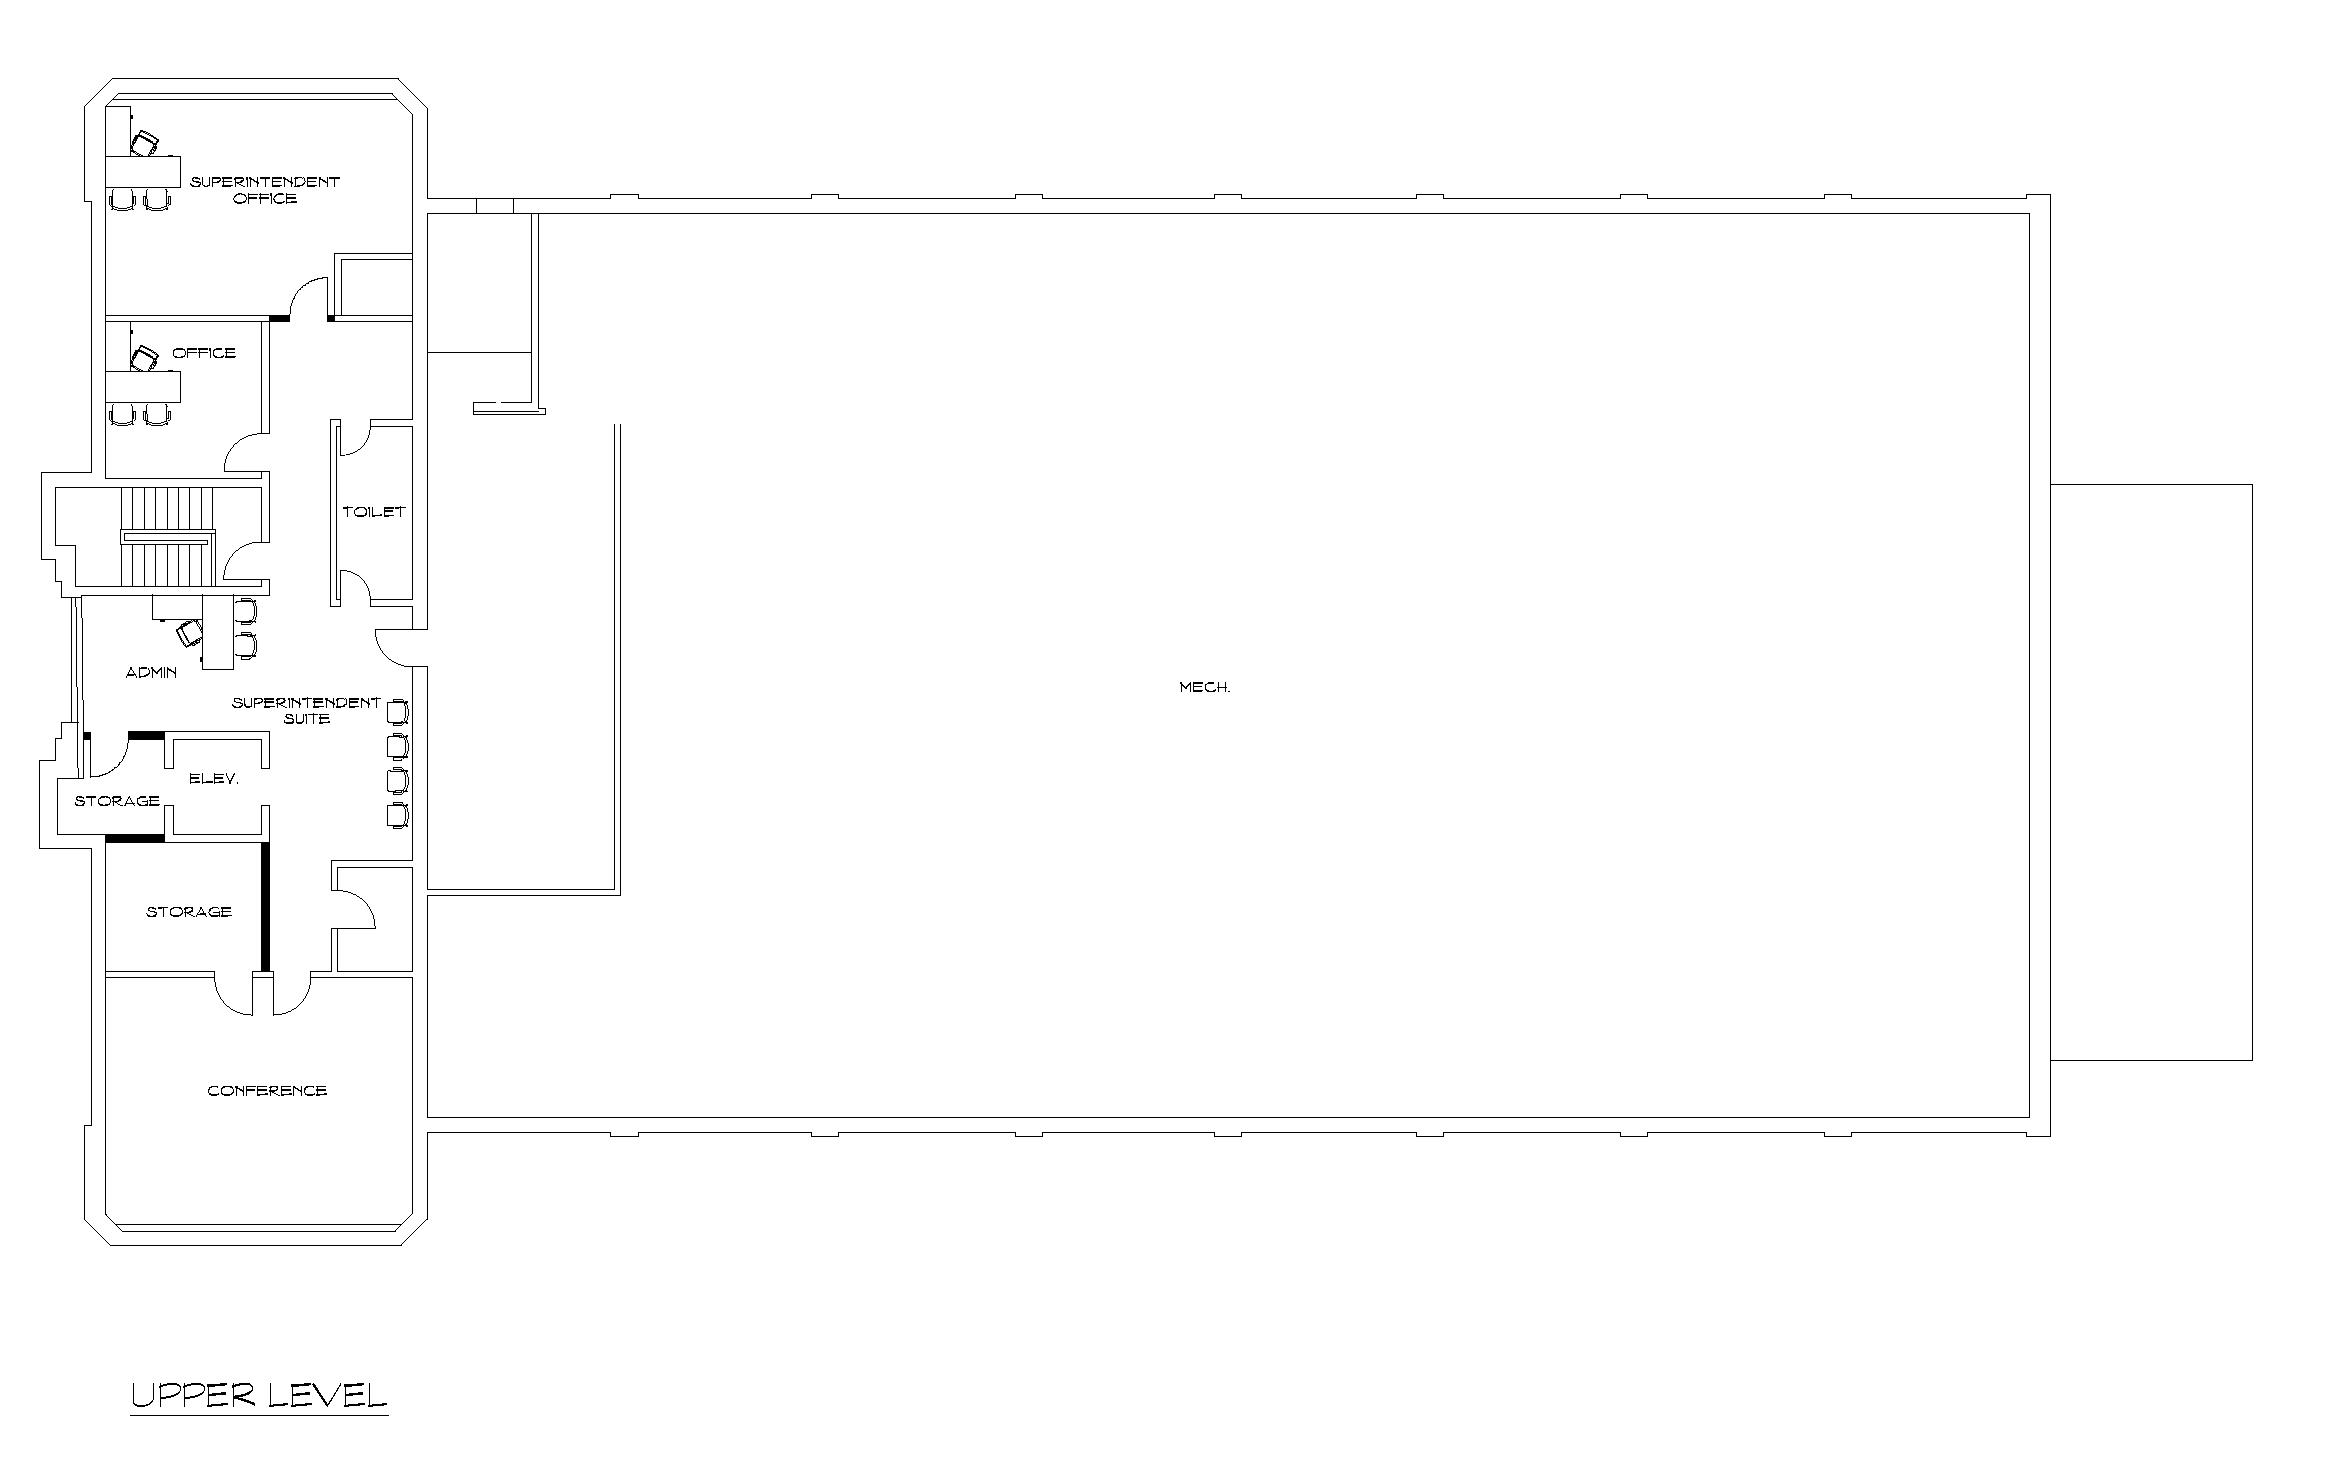
District Programs Central Office Existing Central Office Building Space Division Quantity Square footage Subtotal Average Percentage CURRICULUM & INSTRUCTION OFFFICES 2,670 19% SPECIAL ED/ PPS OFFICES 1,000 7% SUPERINTENDENT OFFICES 2,122 15% PERSONNEL OFFICES 2,037 15% BUSINESS OFFICES 2,325 17% ADMINISTRATION 1,625 12% BUILDING INFRASTRUCTURE 1,000 7% CIRCULATION + STRUCTURE 1,007 7% TOTAL 13,786 40
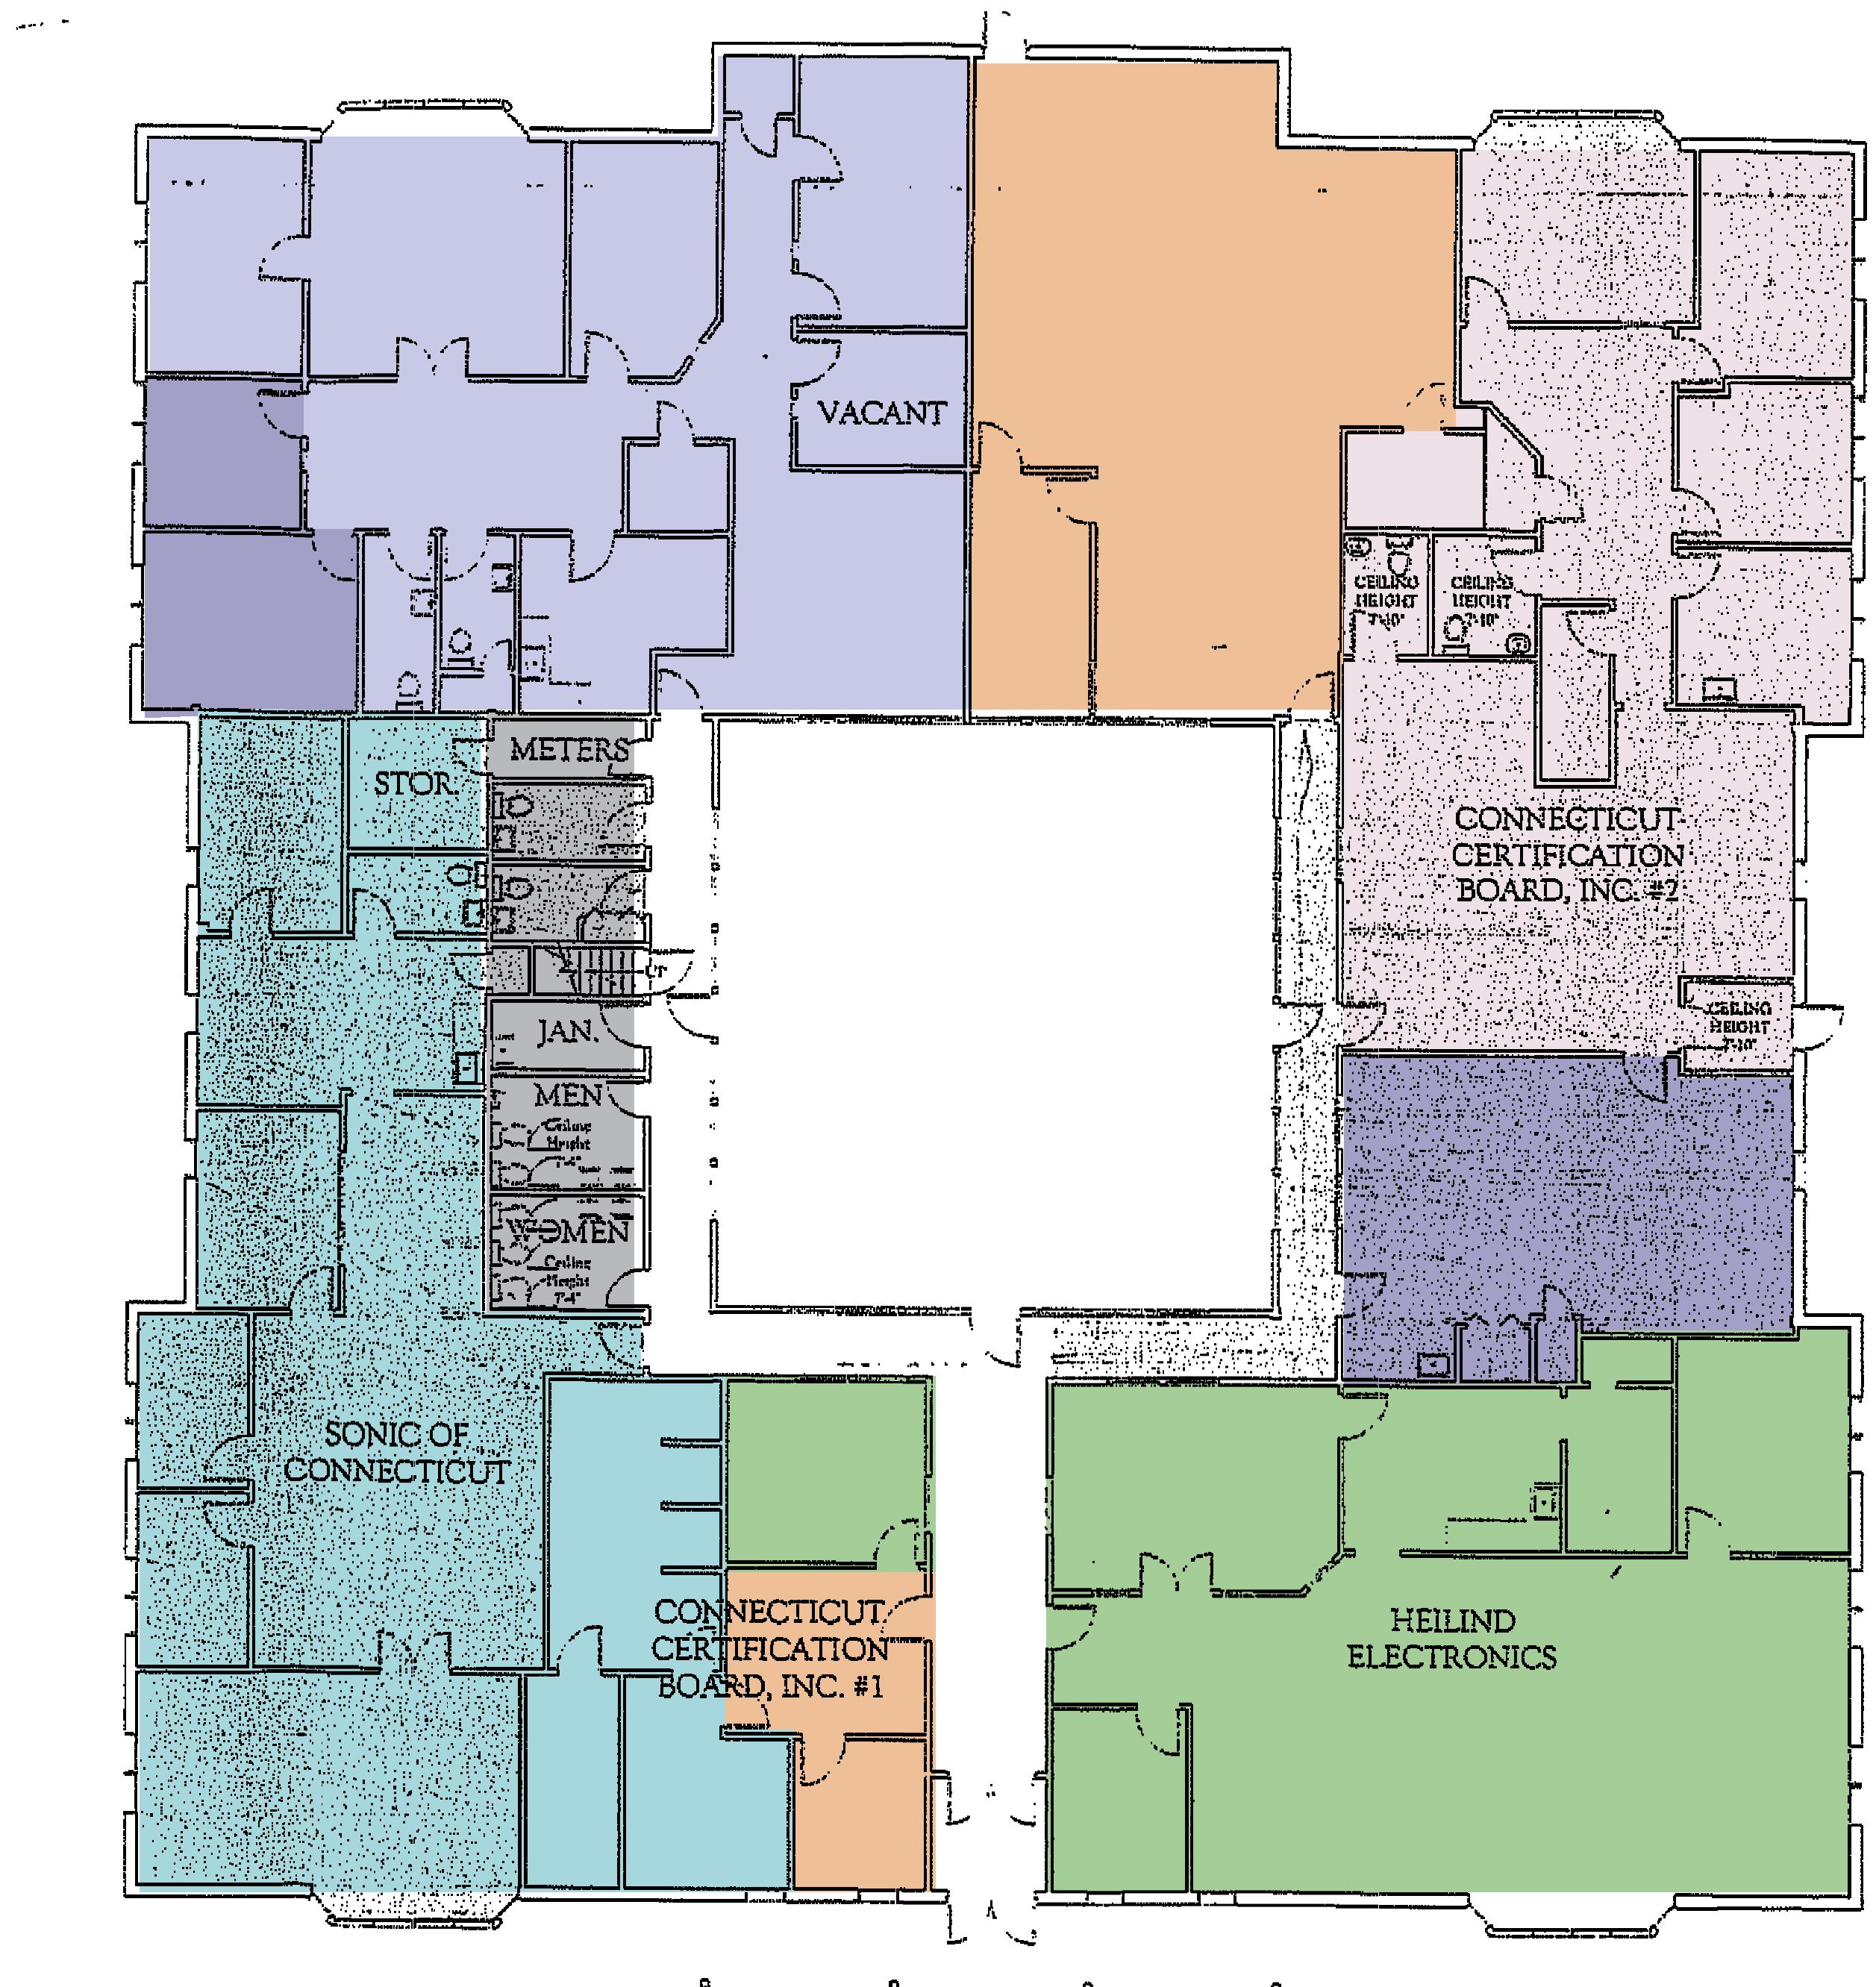
District Programs
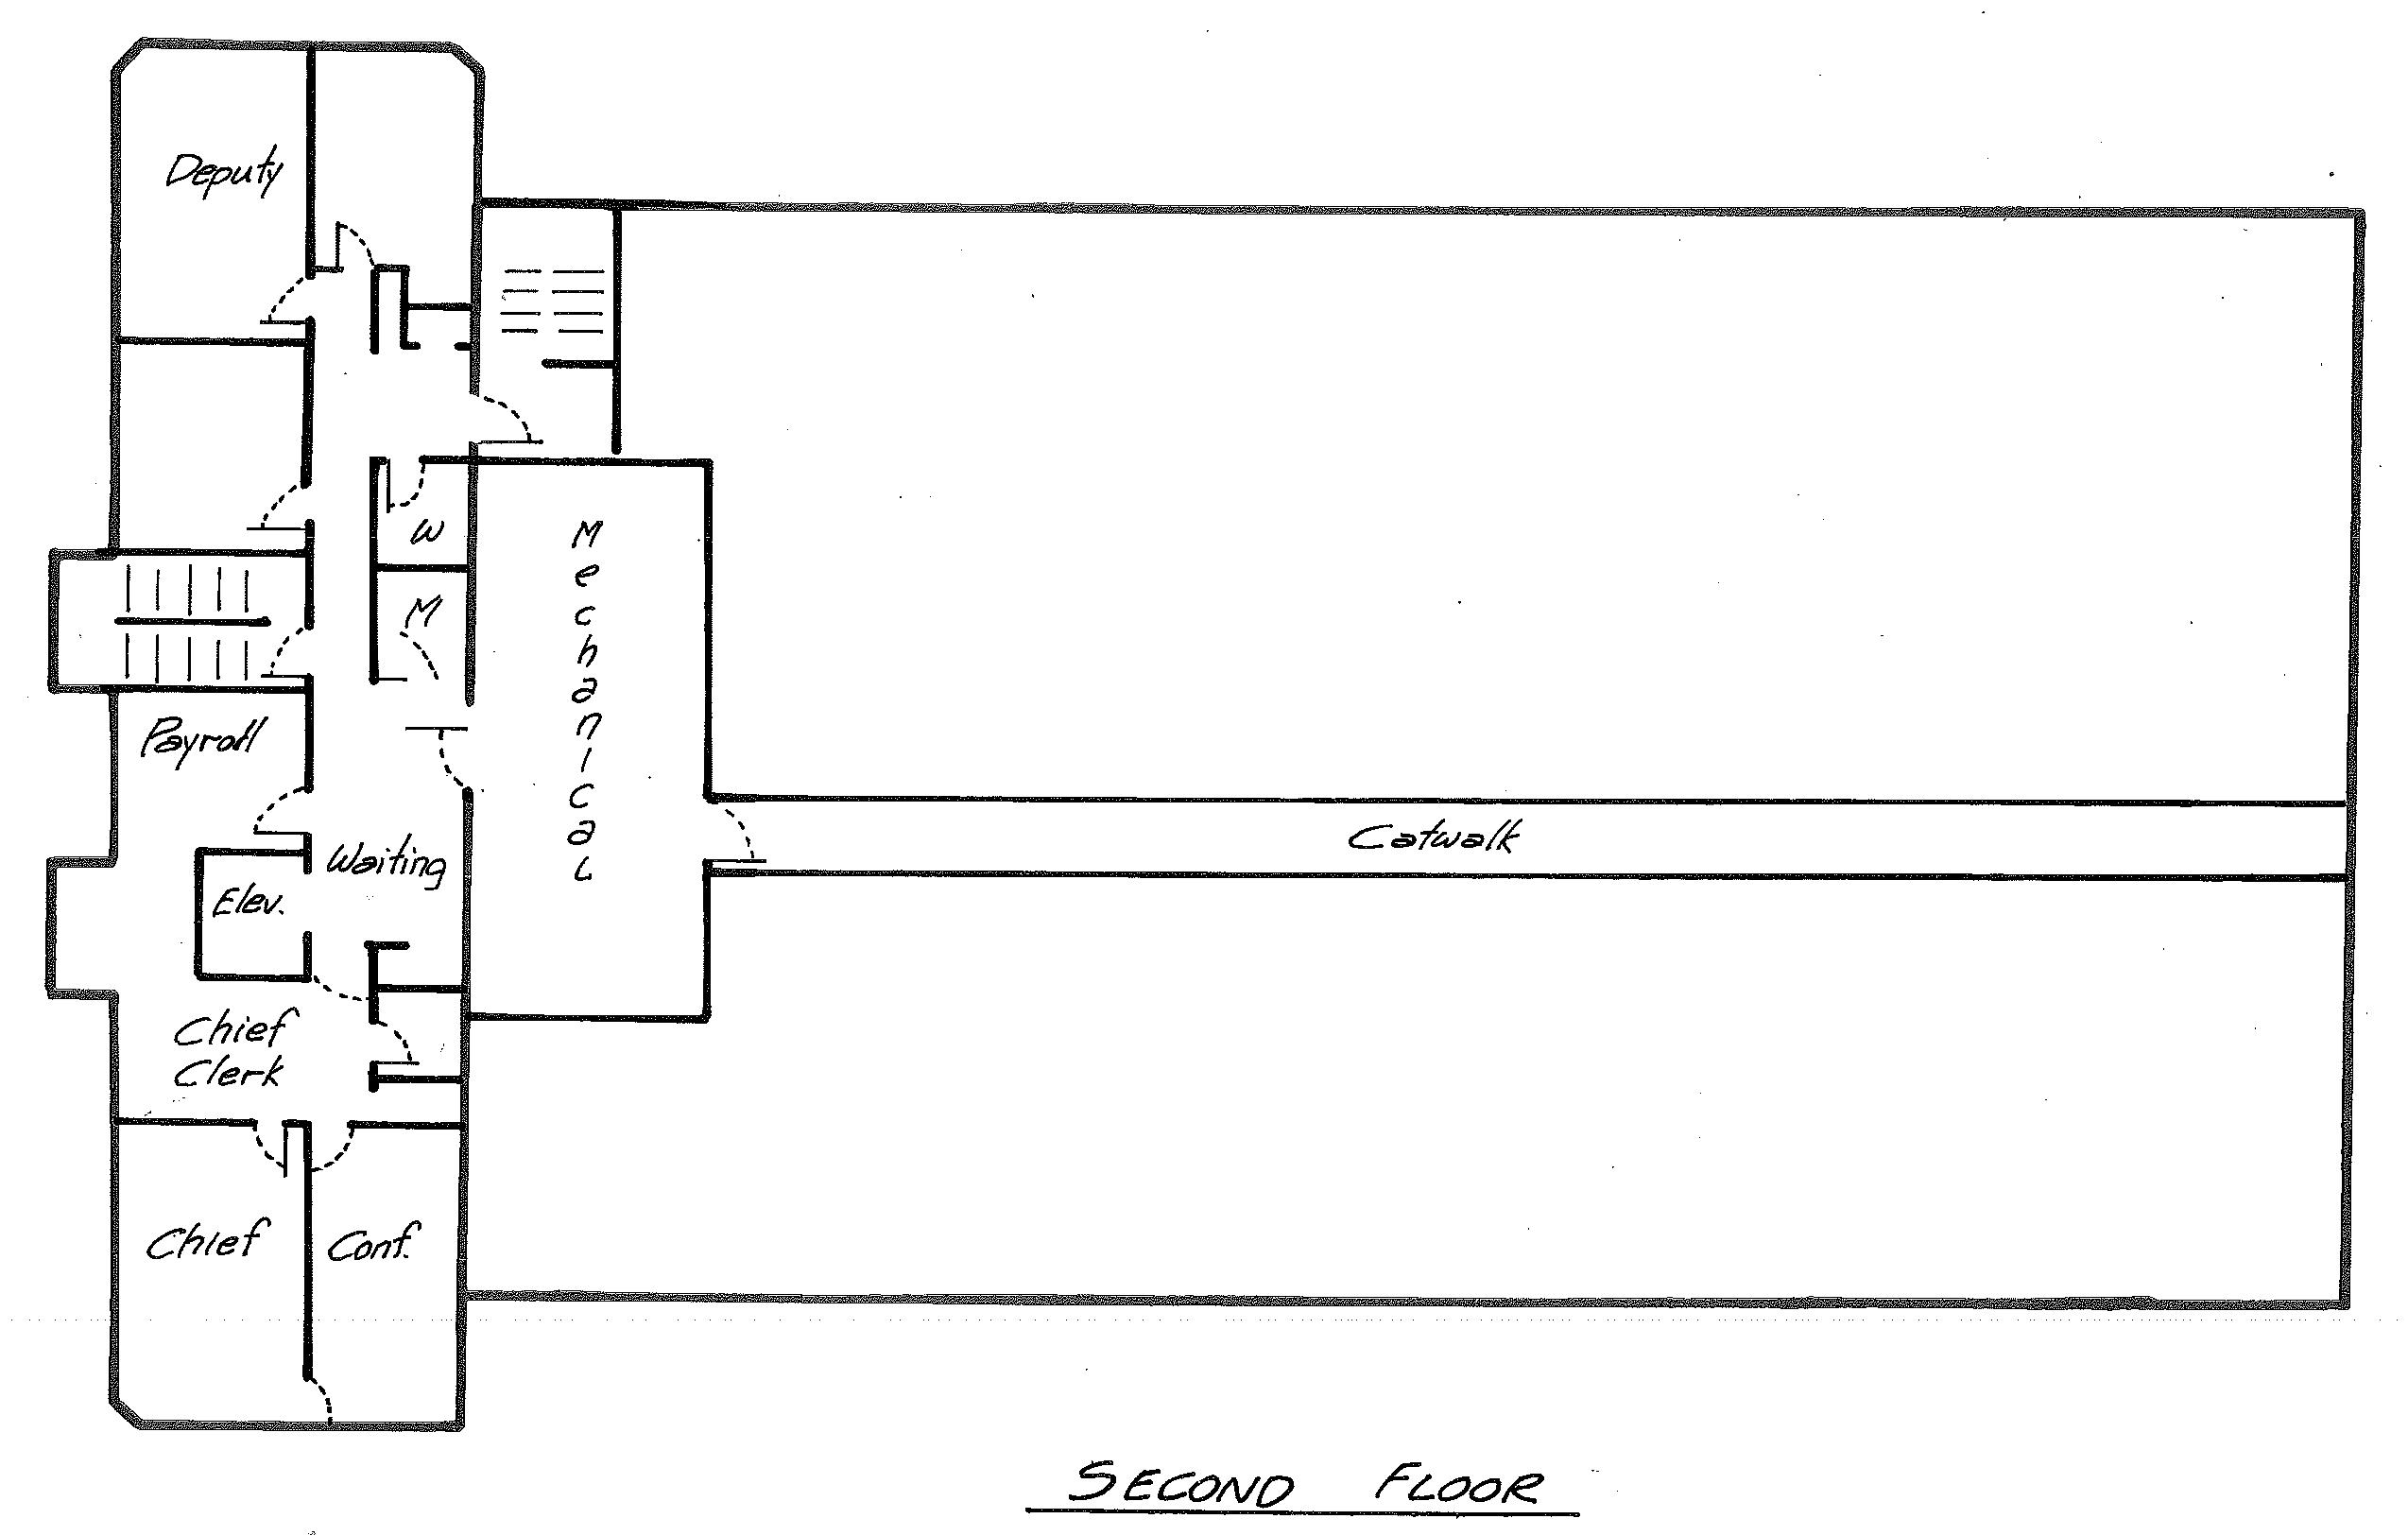
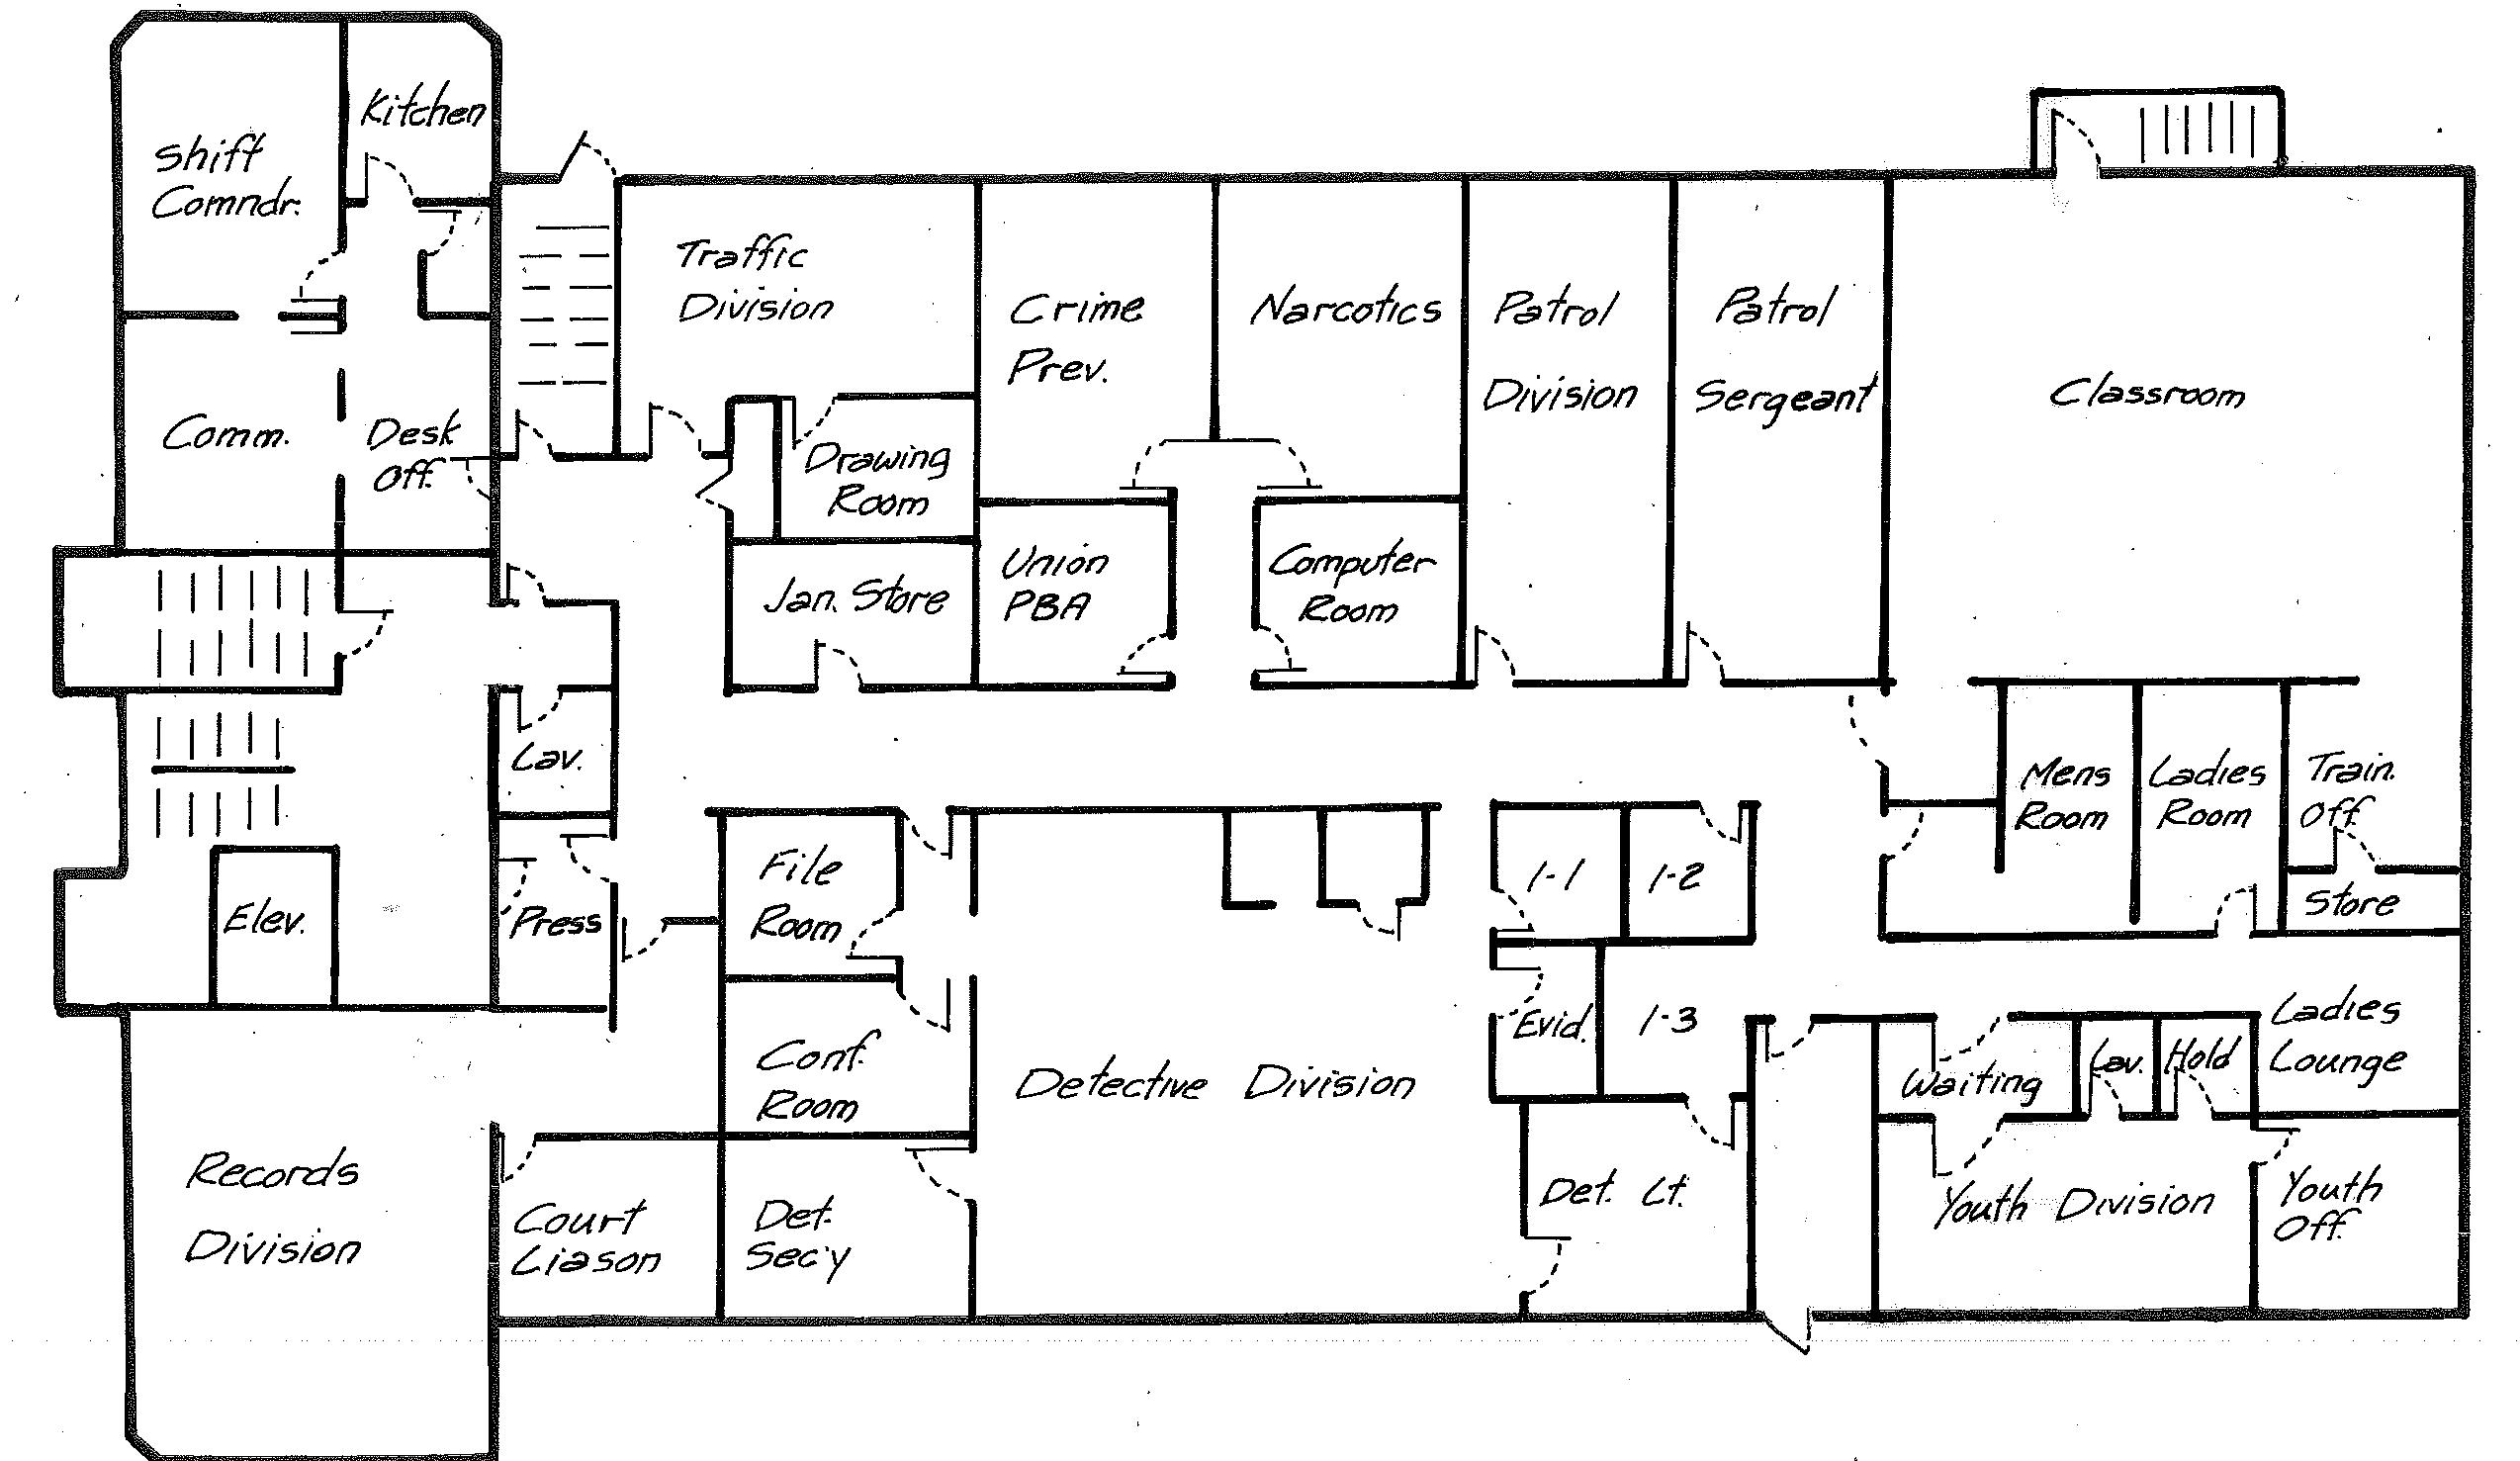
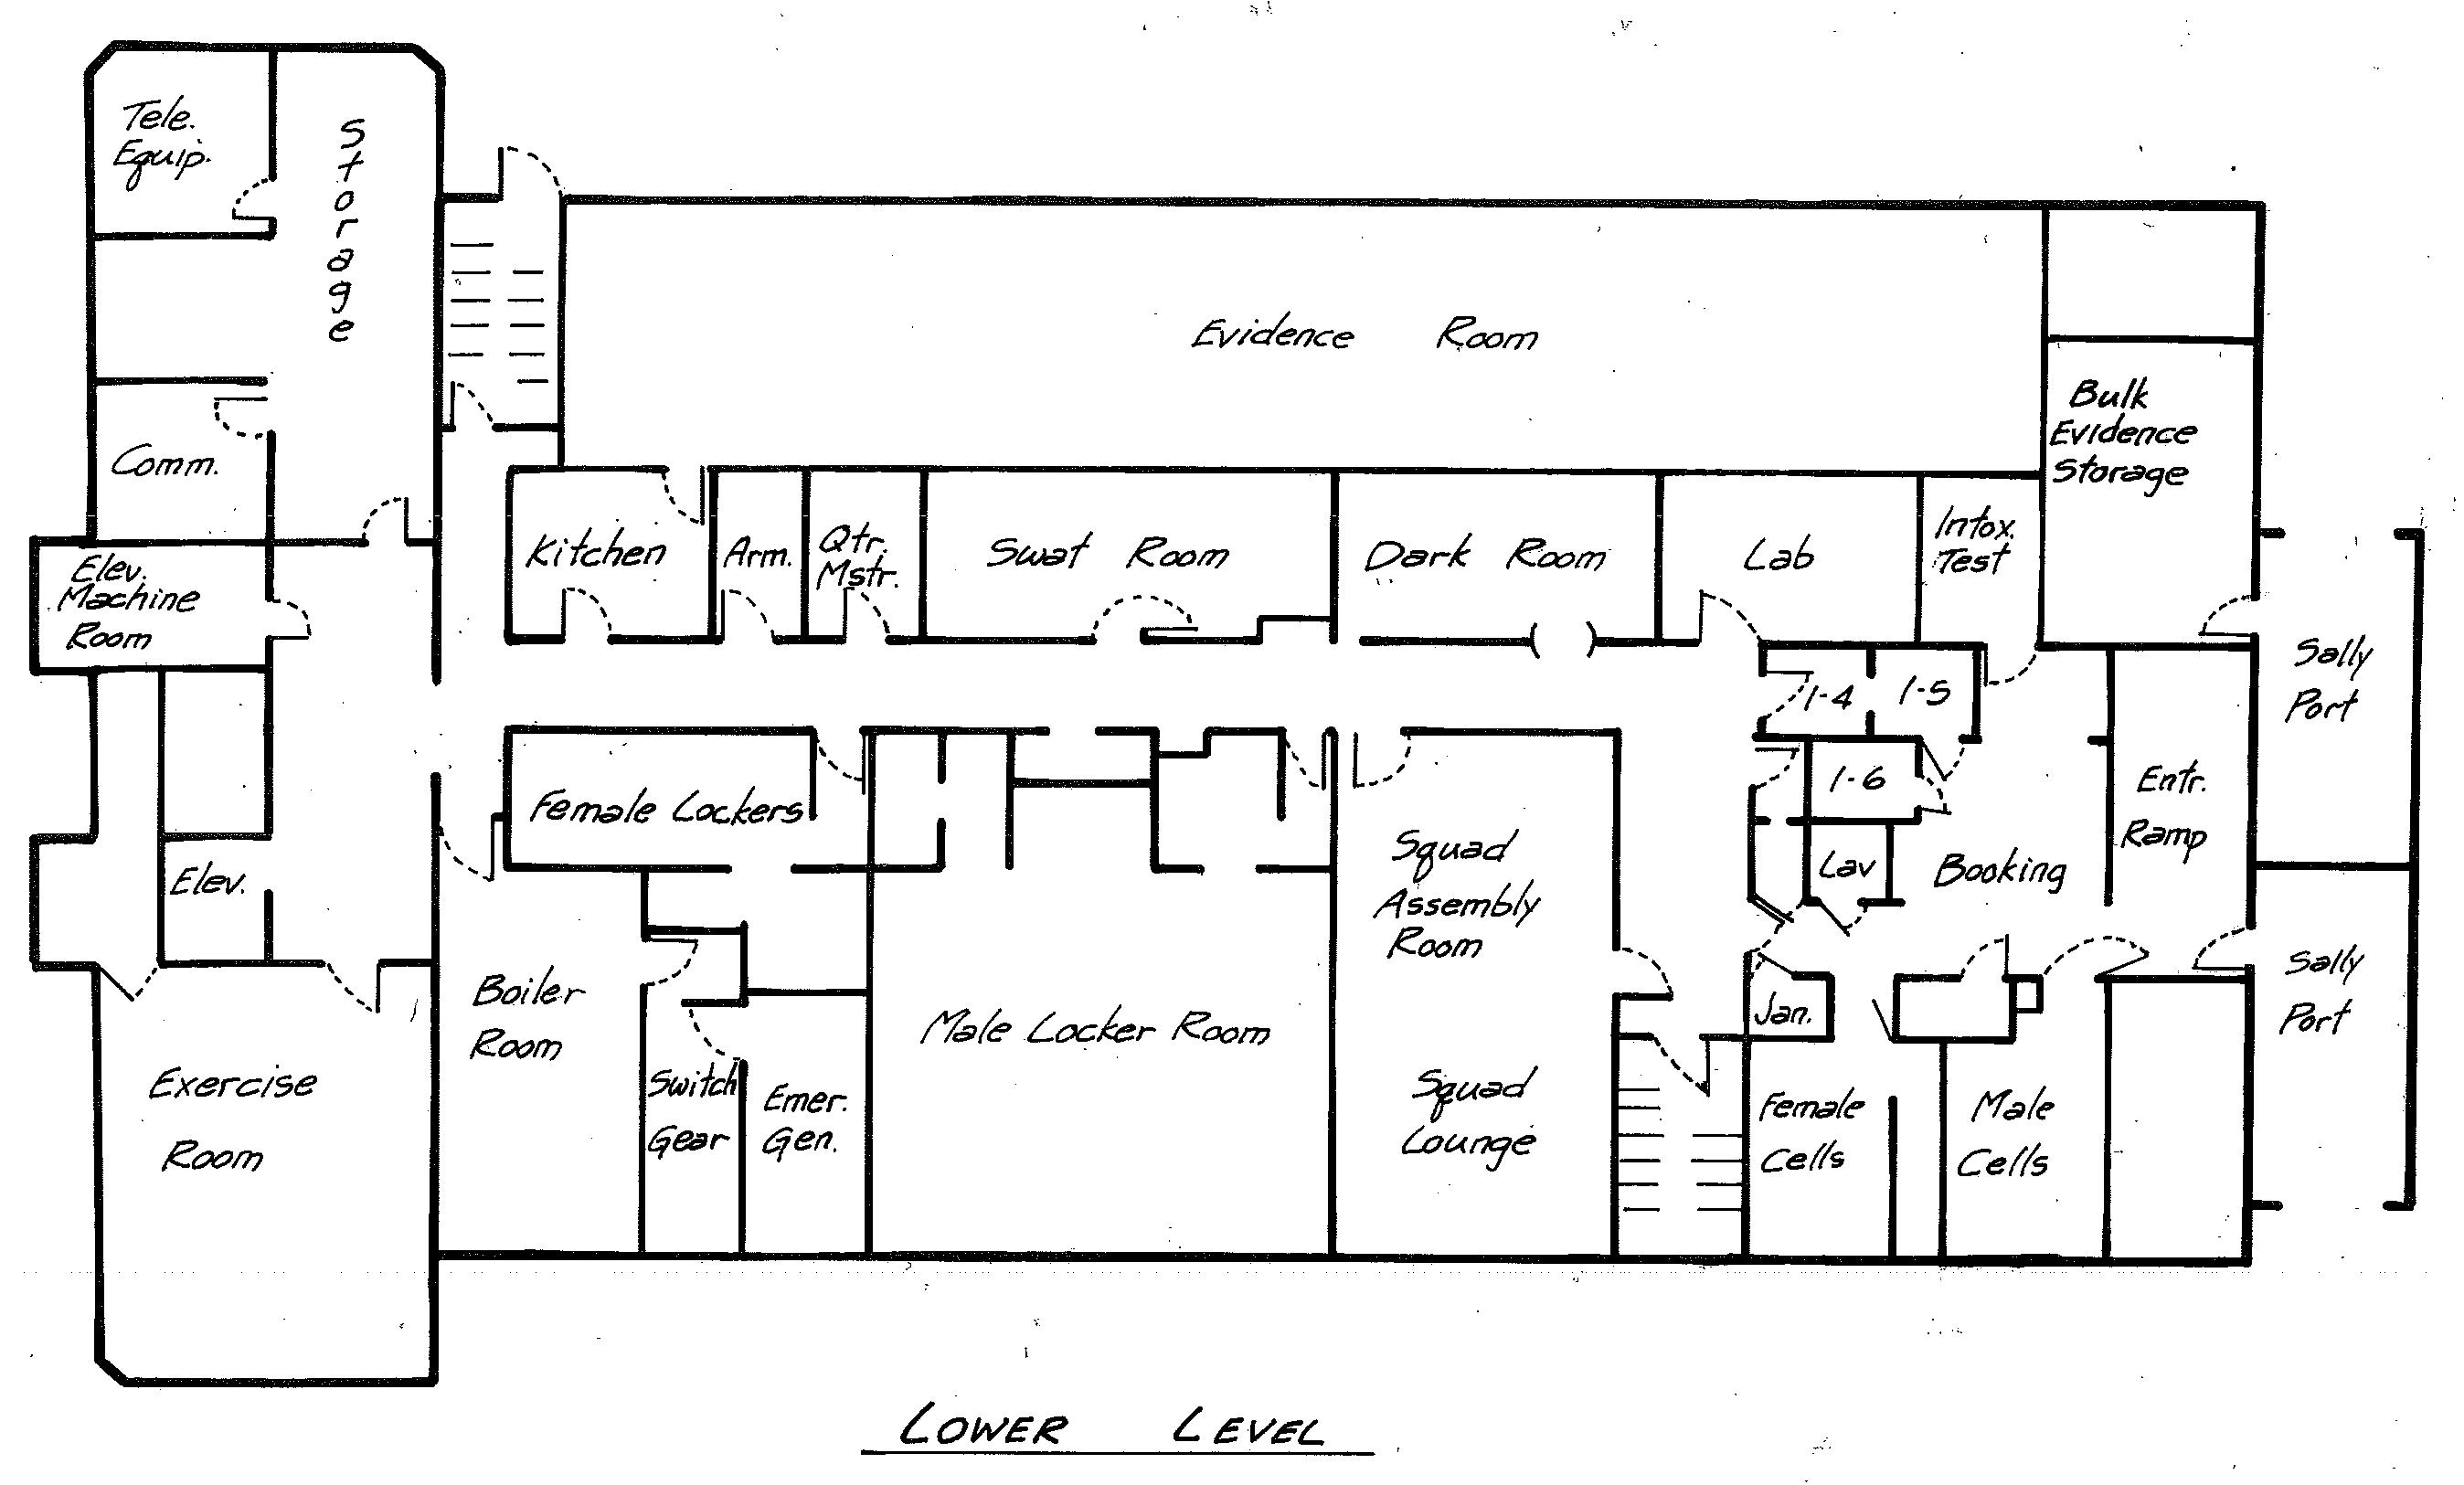
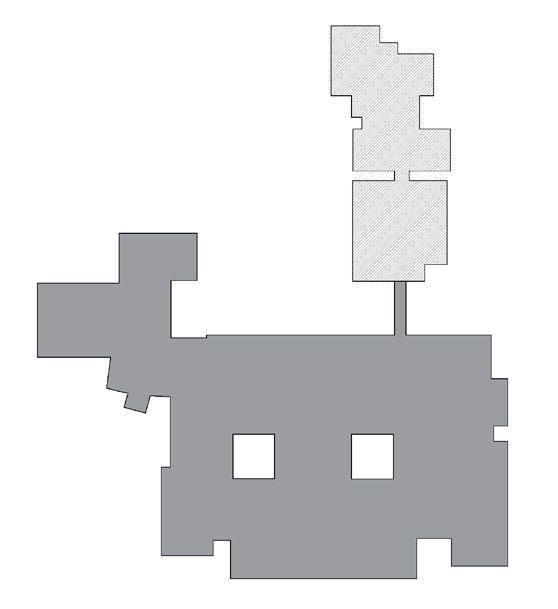
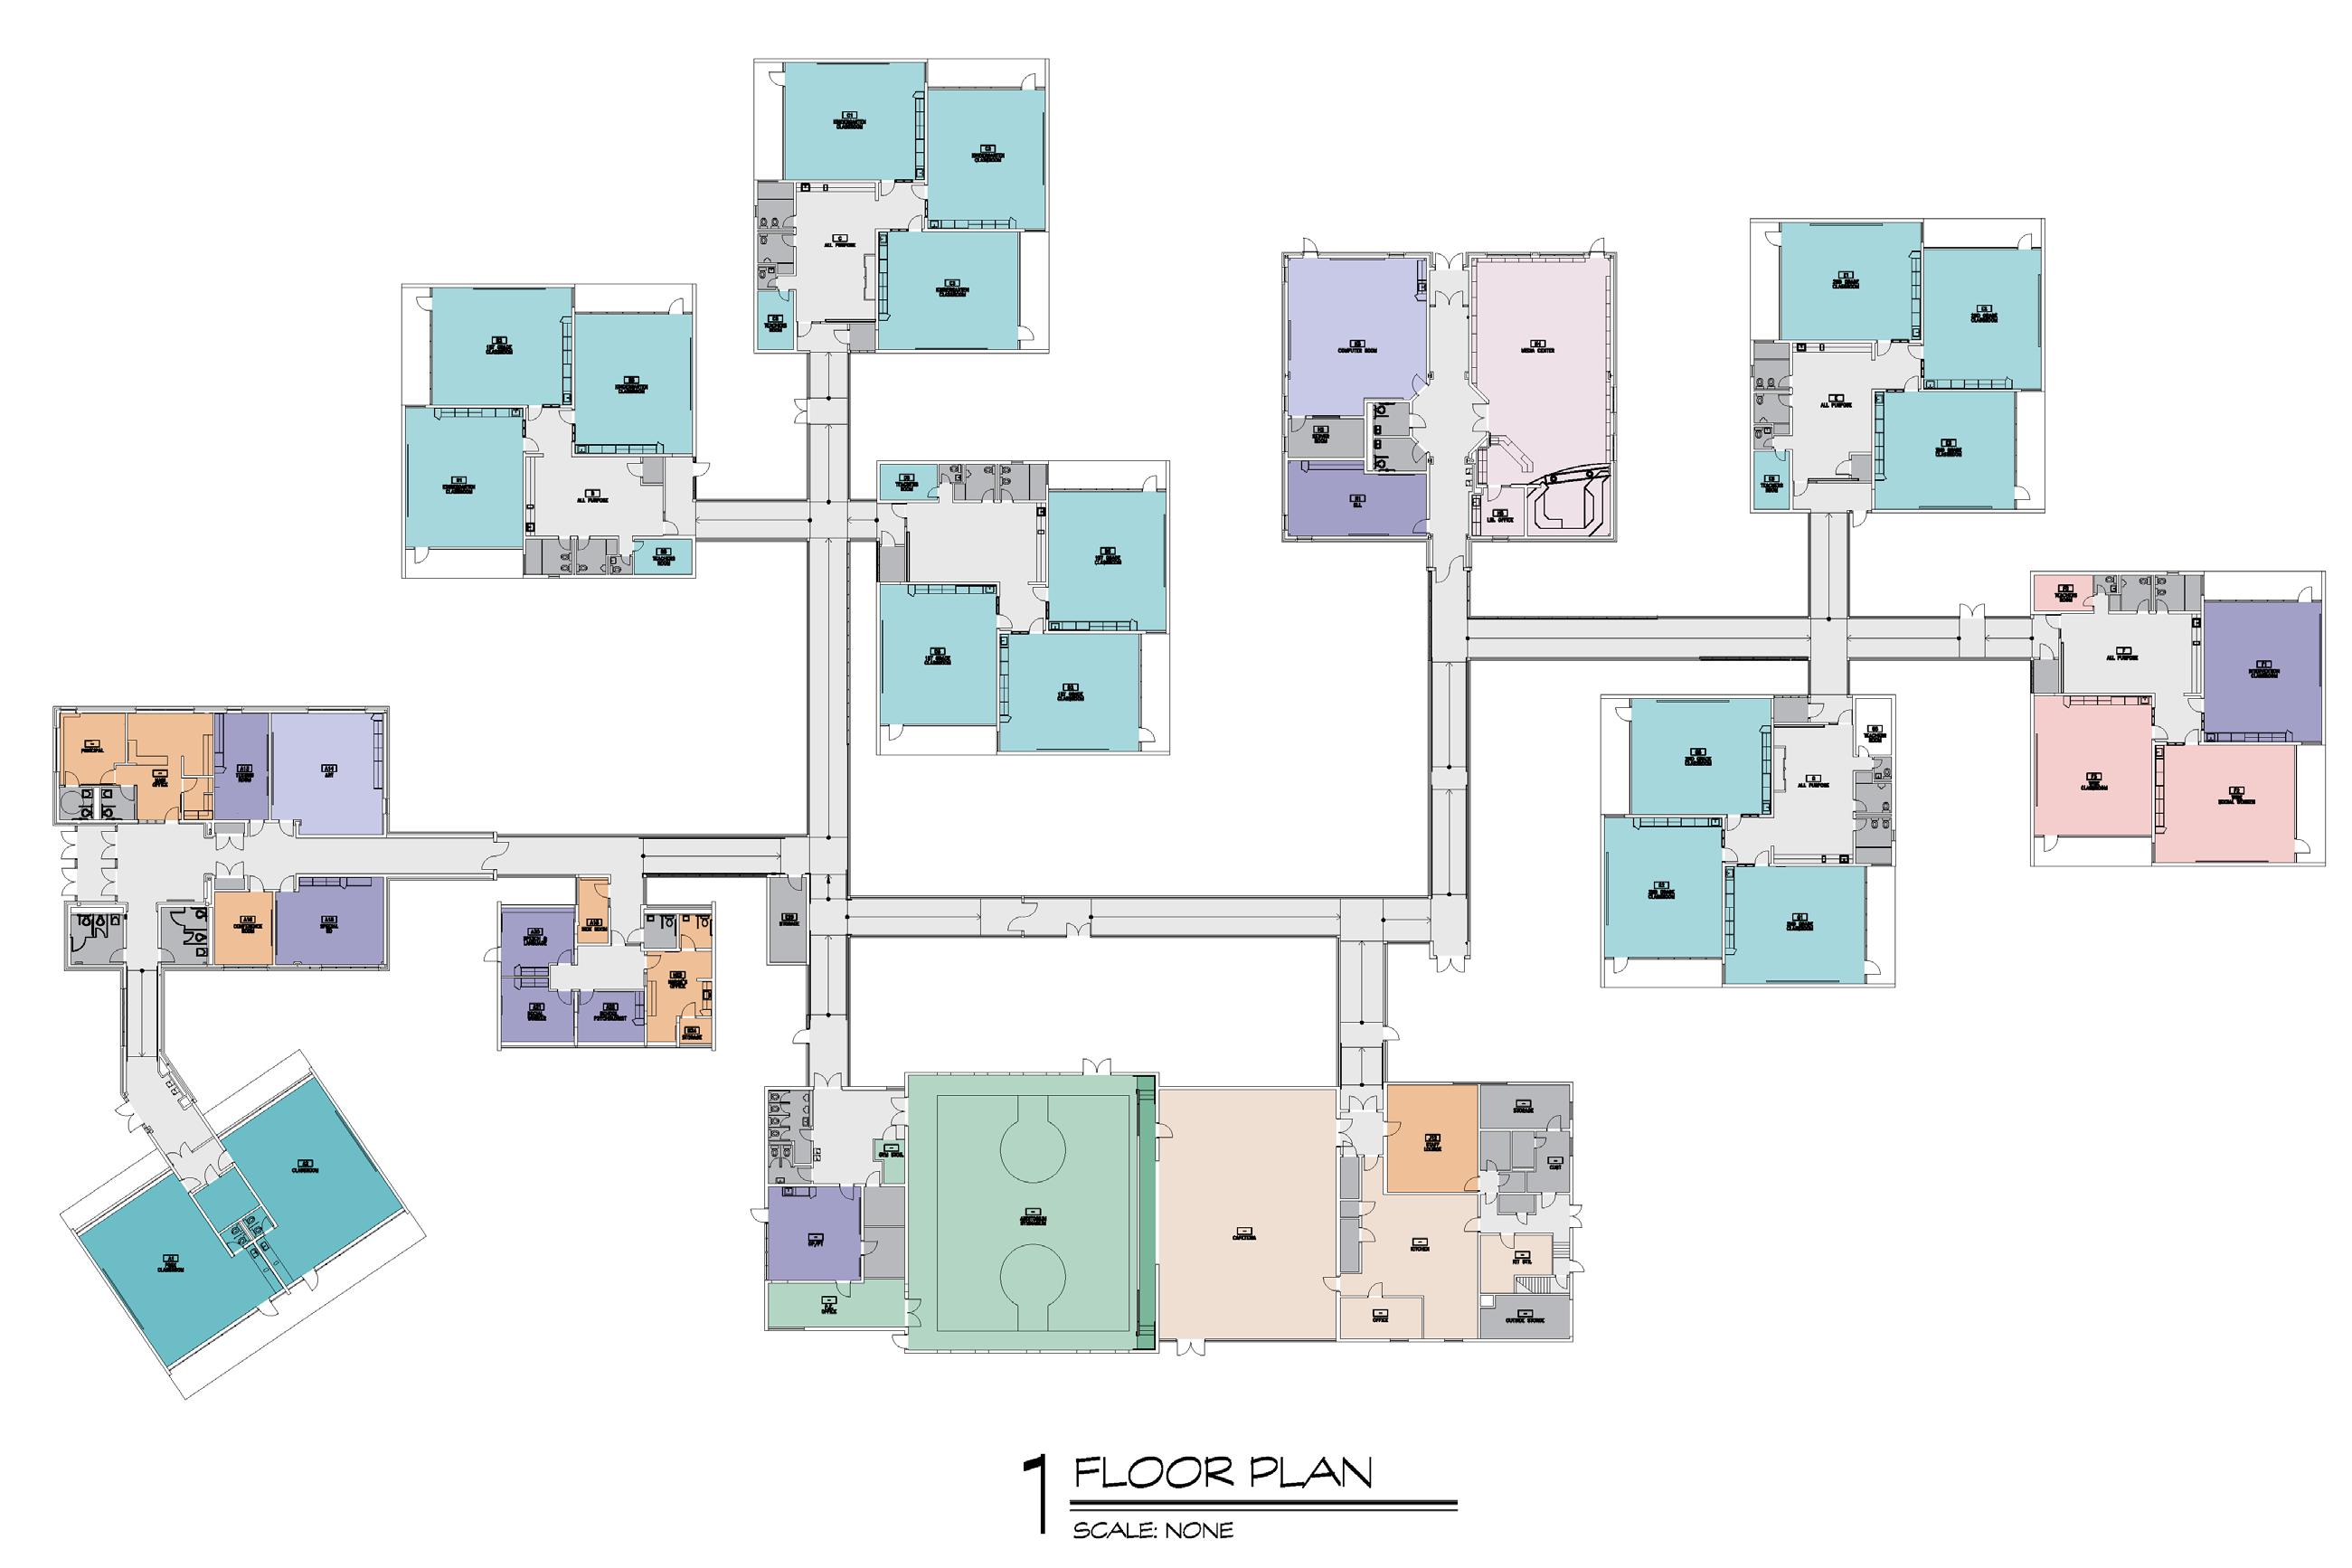
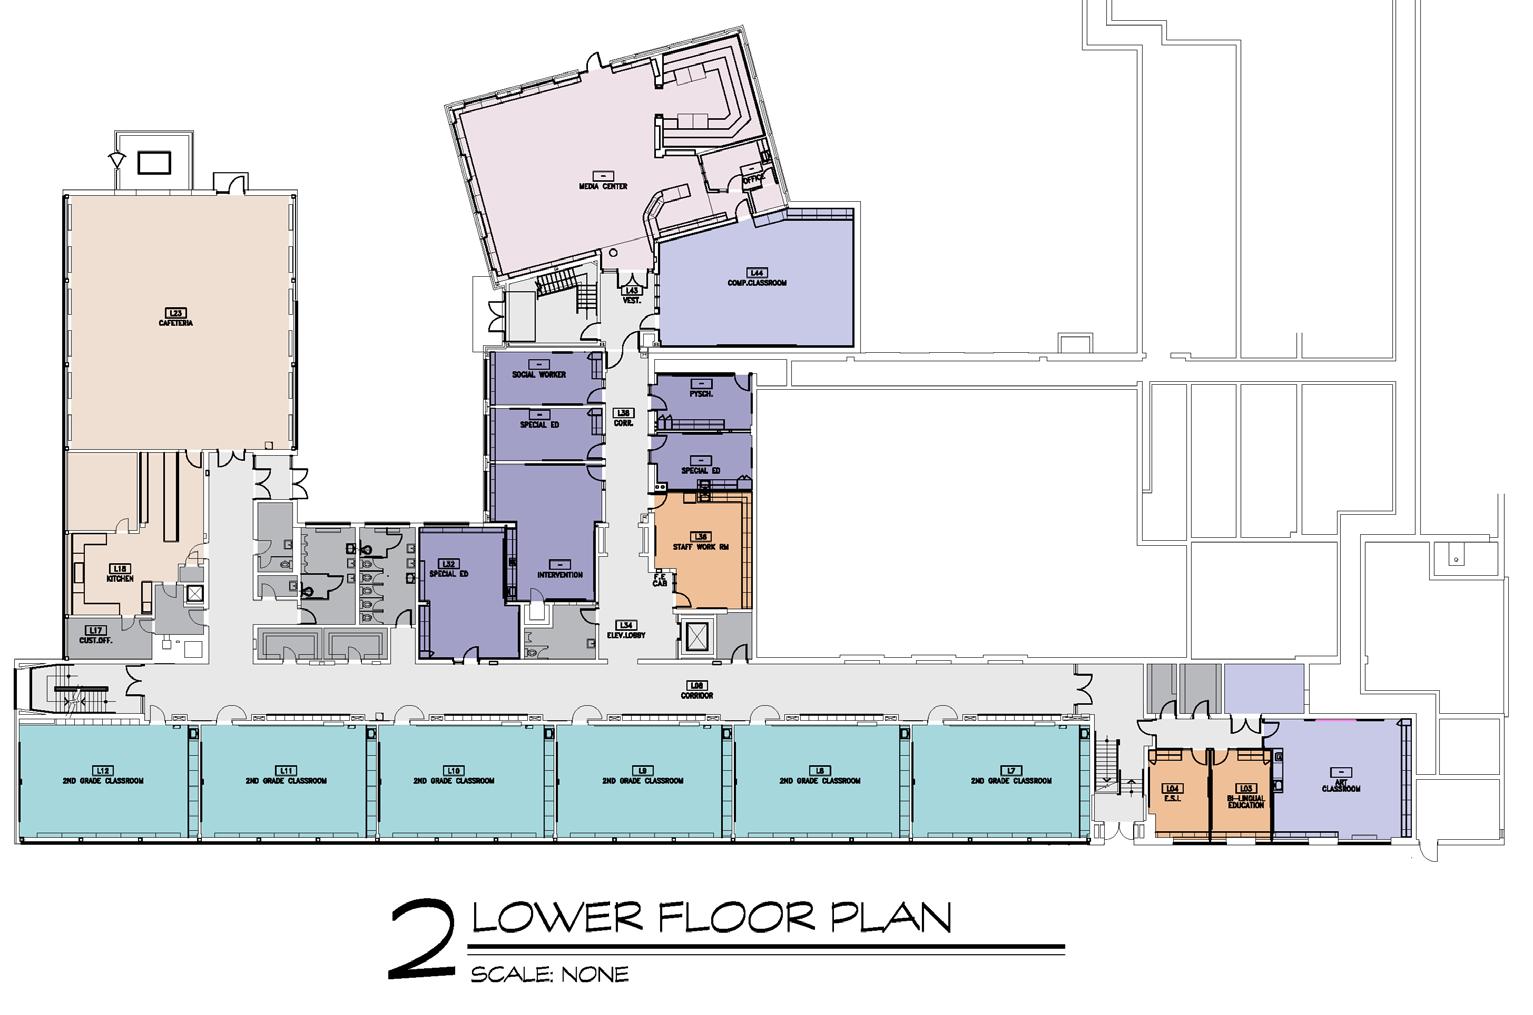
Police Station Test Fit
Relocating Spring 2024
•
41
District Programs
Police Station Test Fit
42
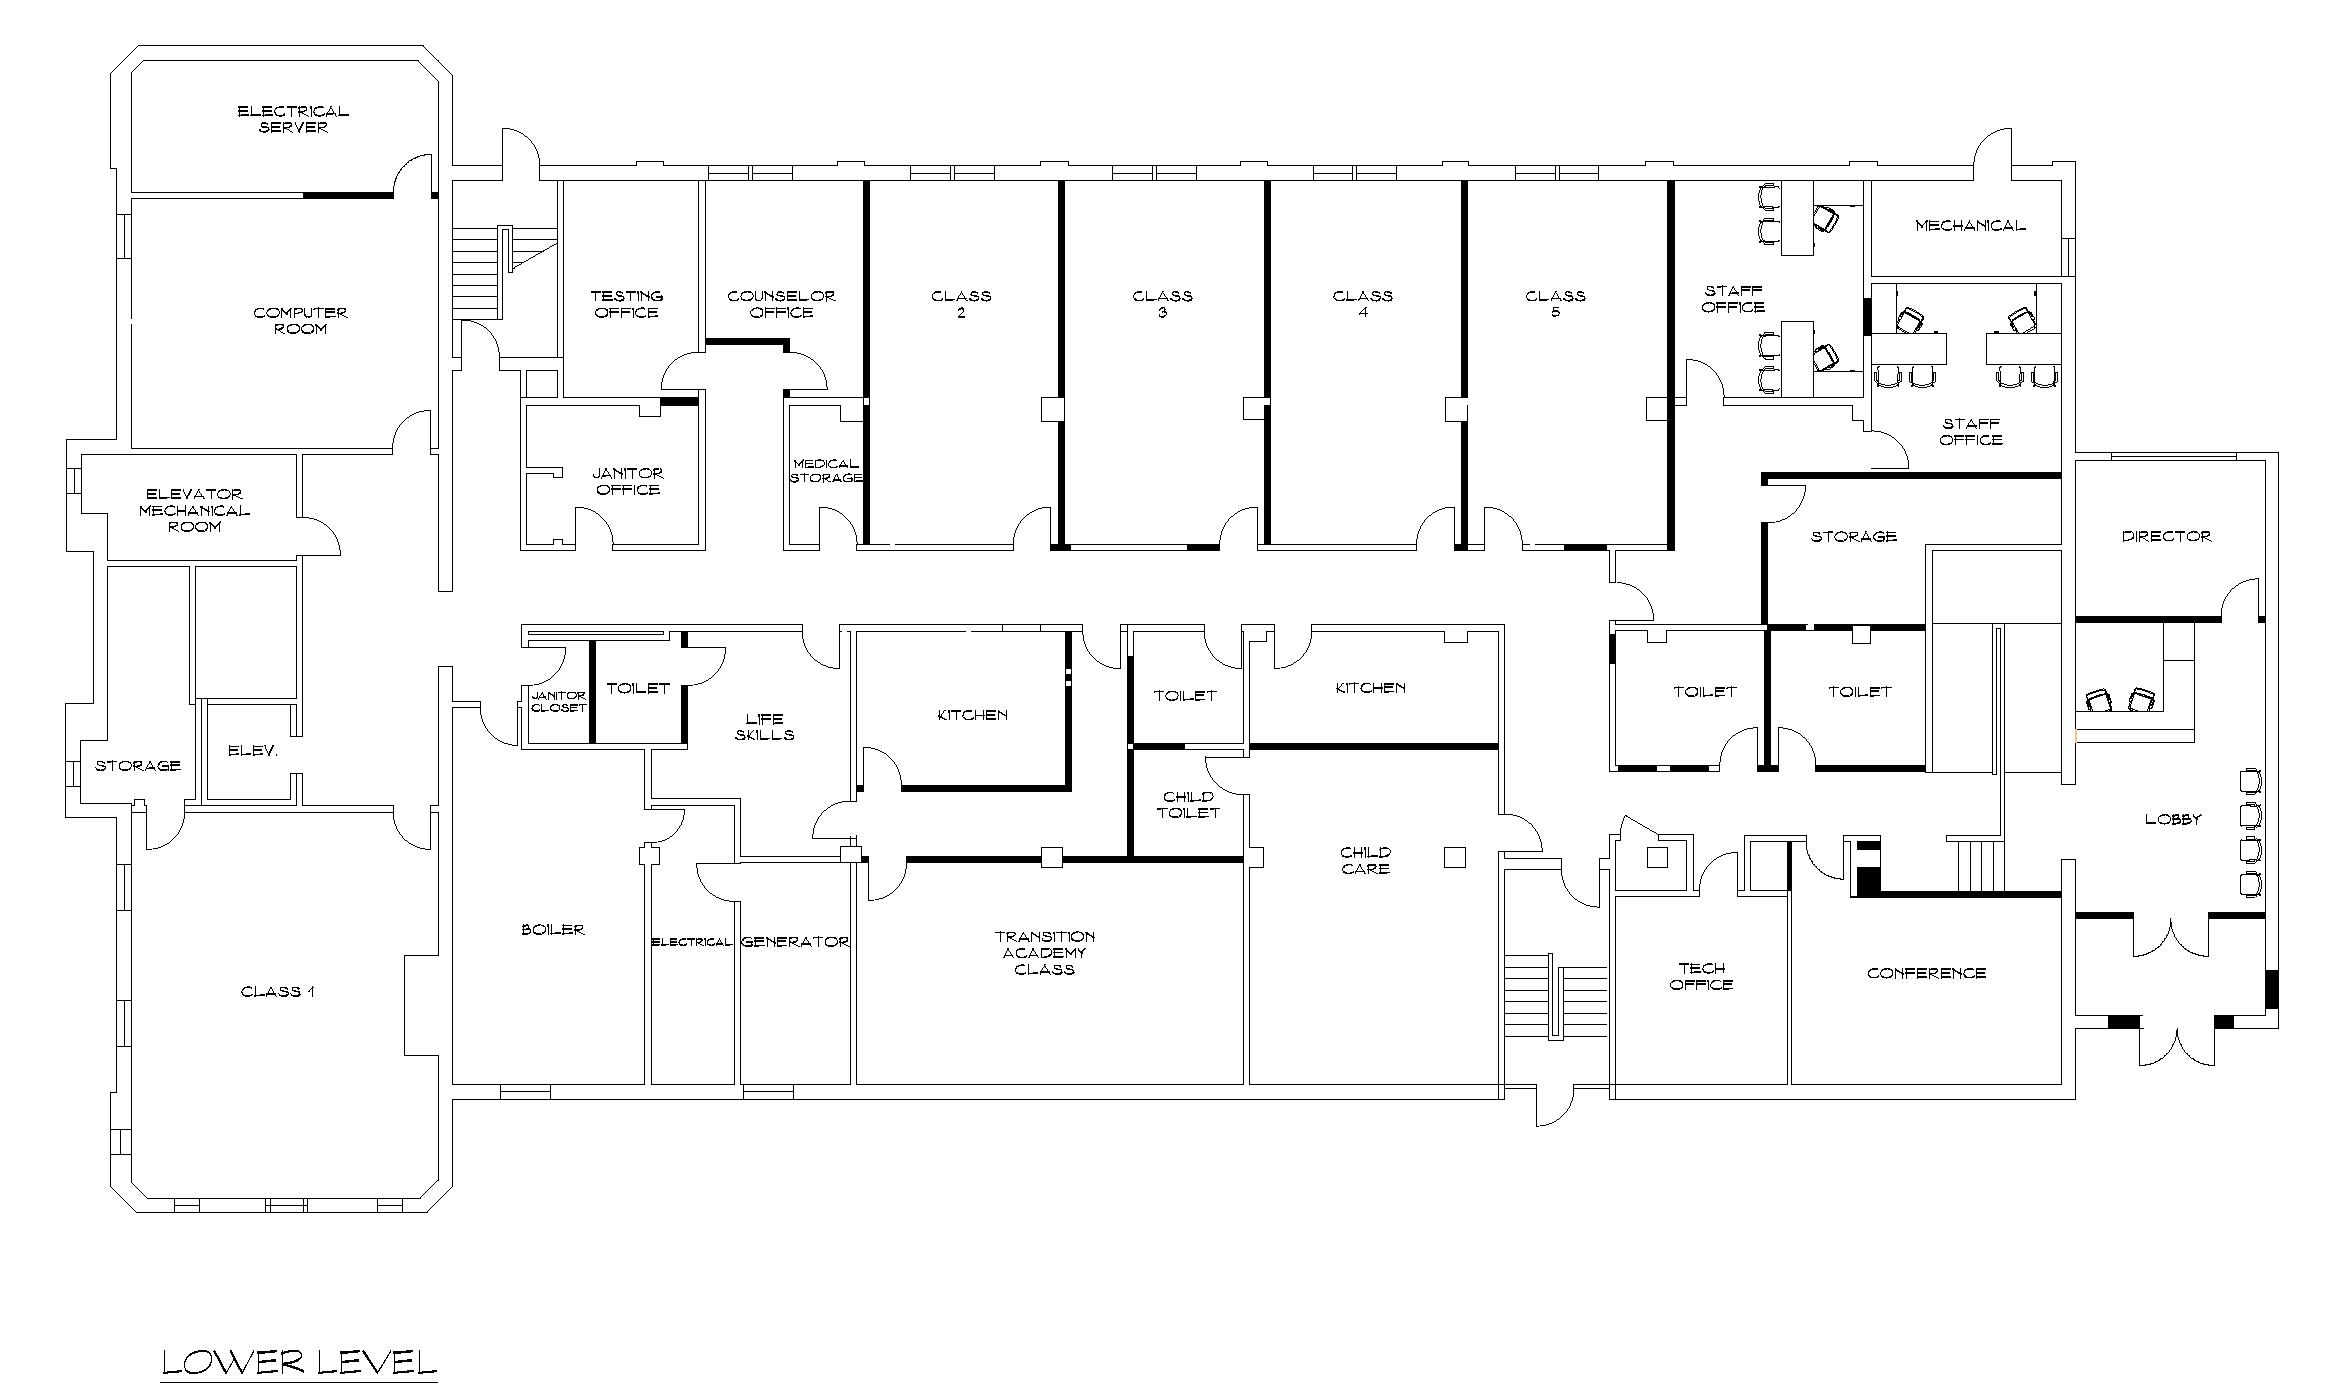
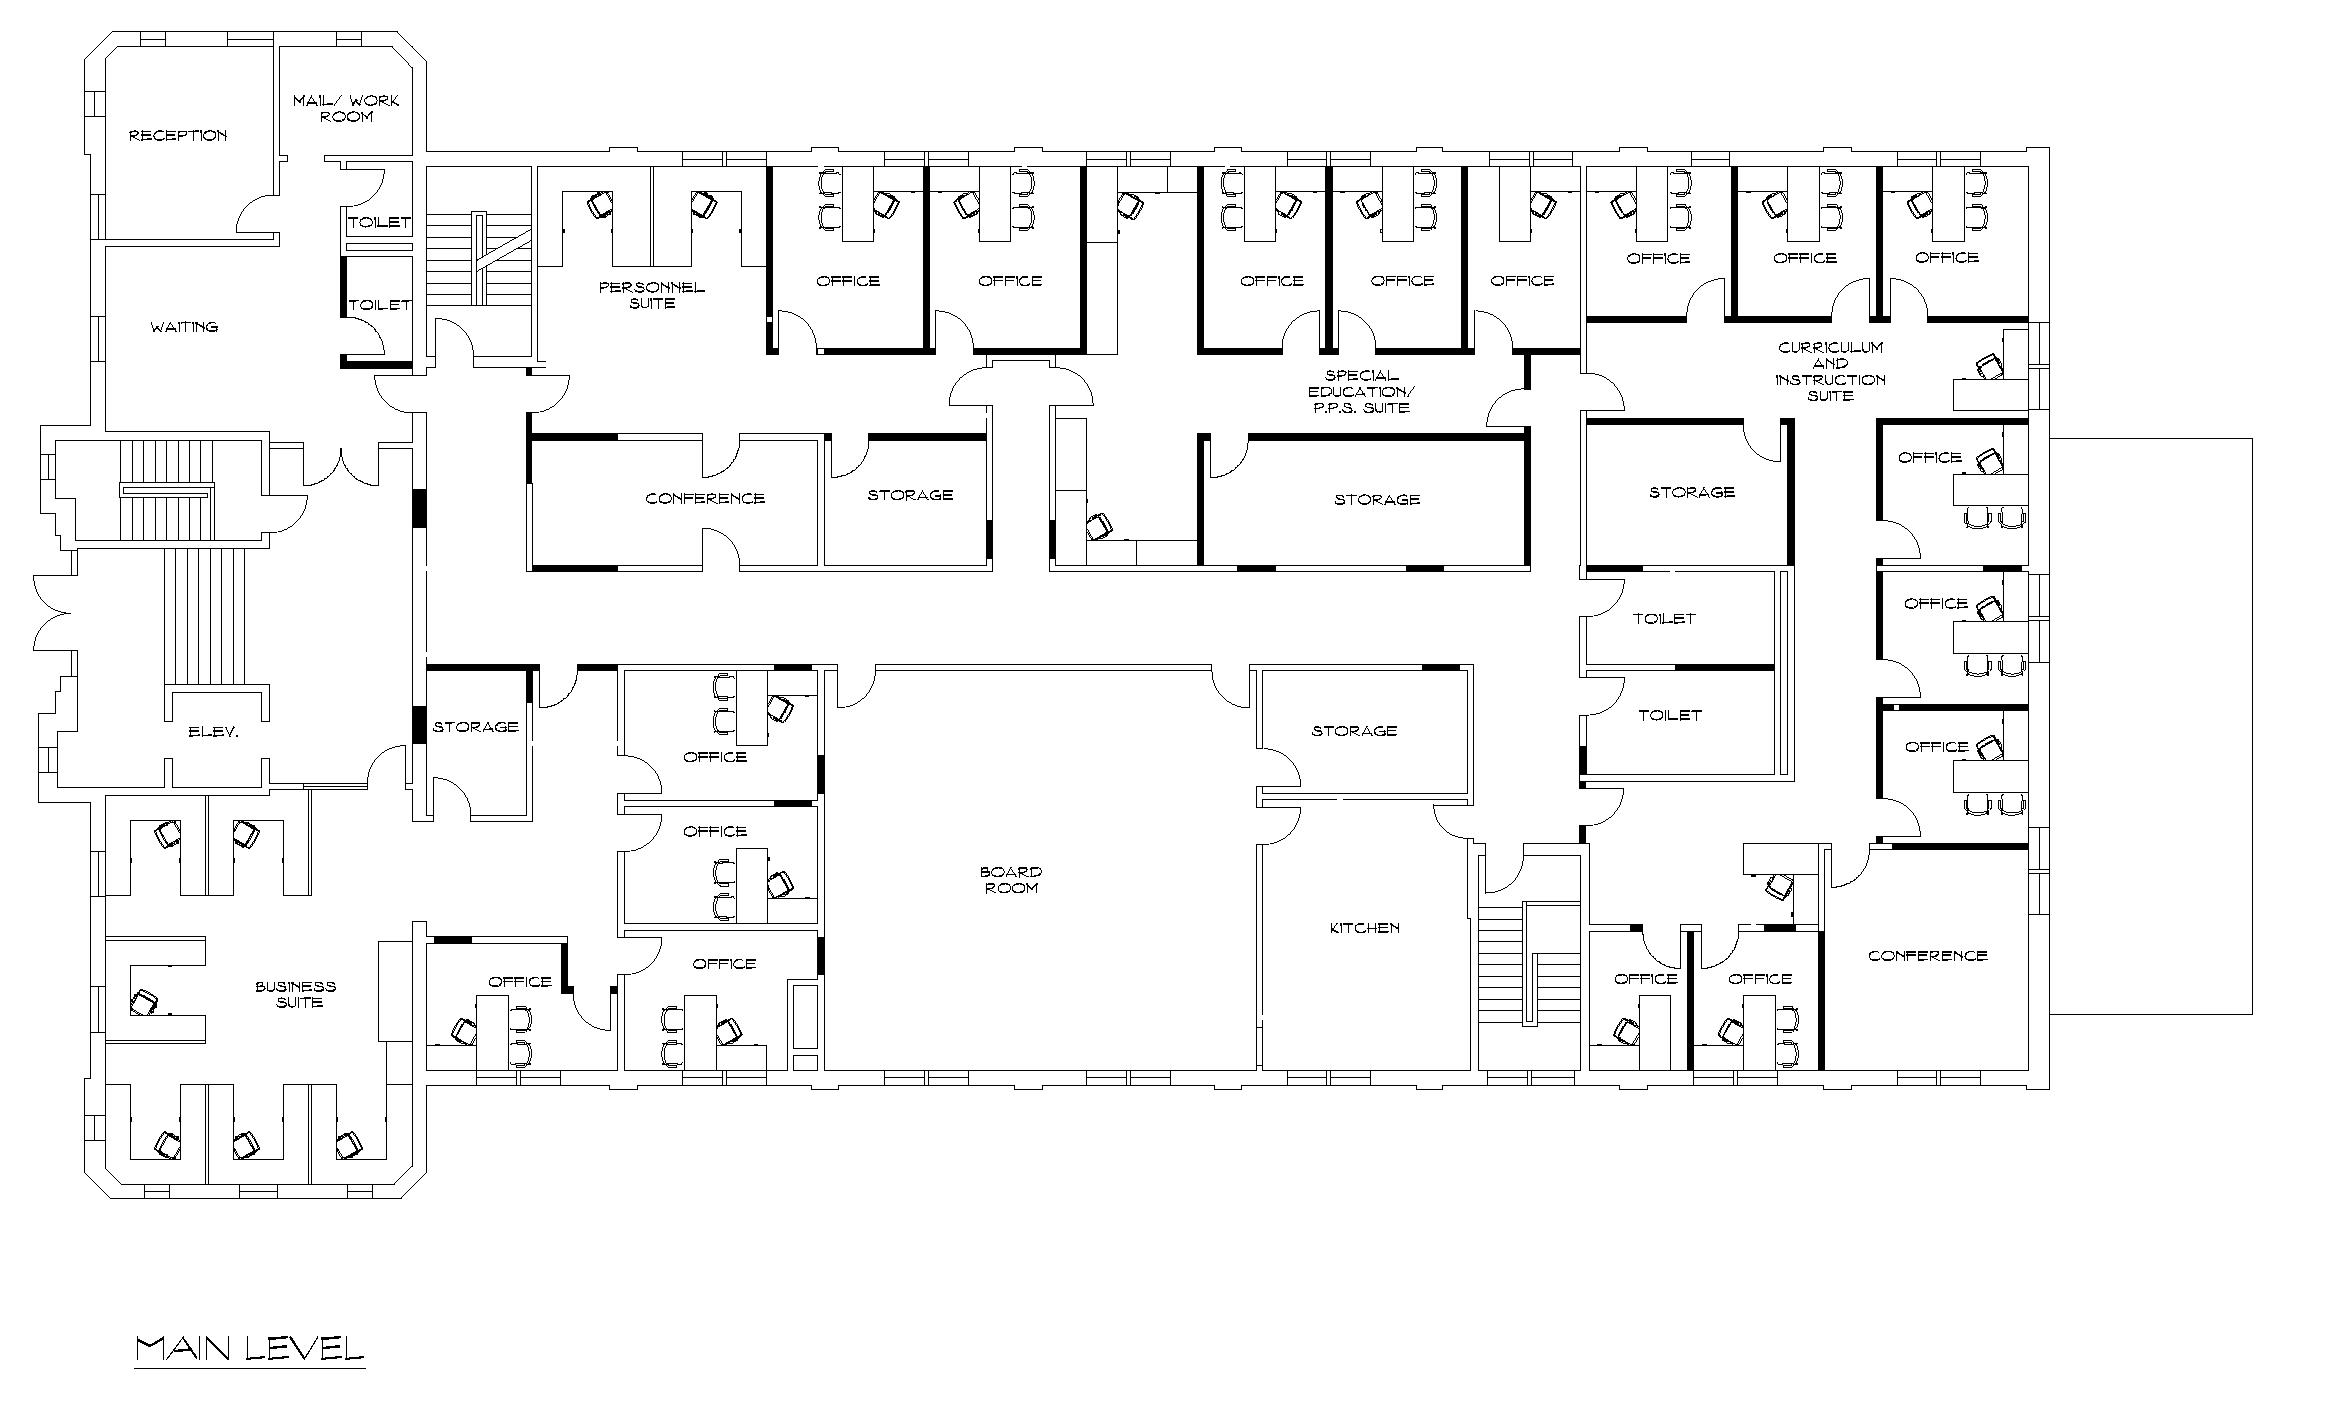
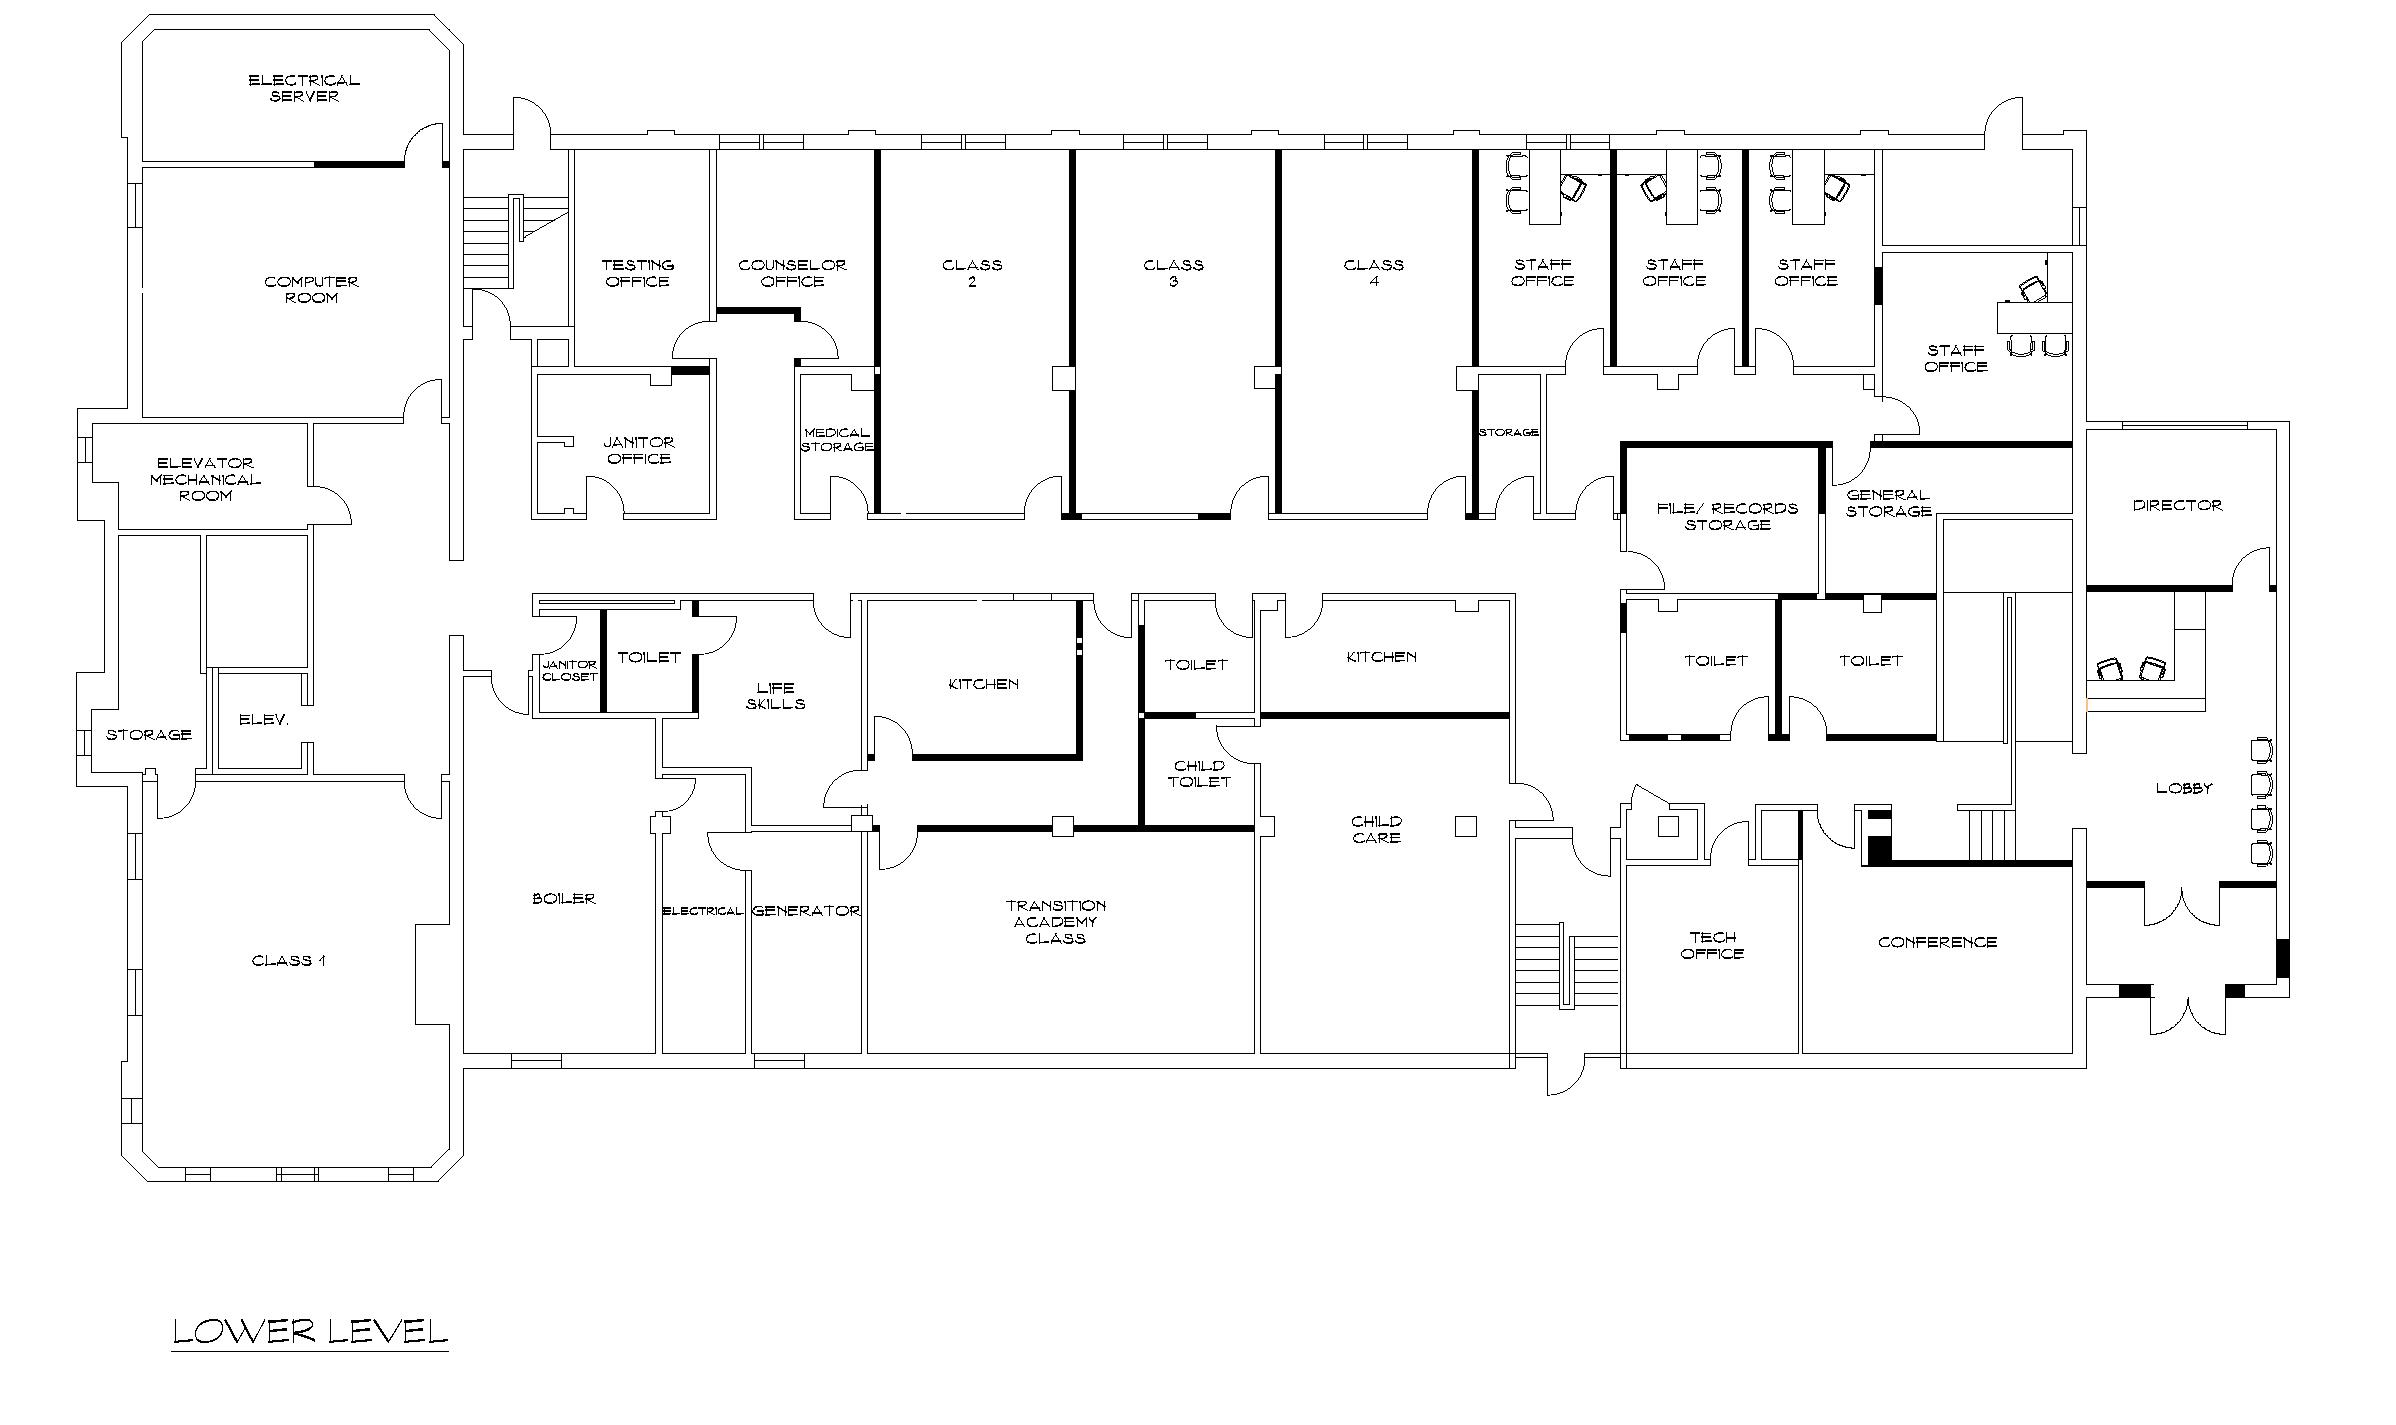
District
4,456,500
3,736,500
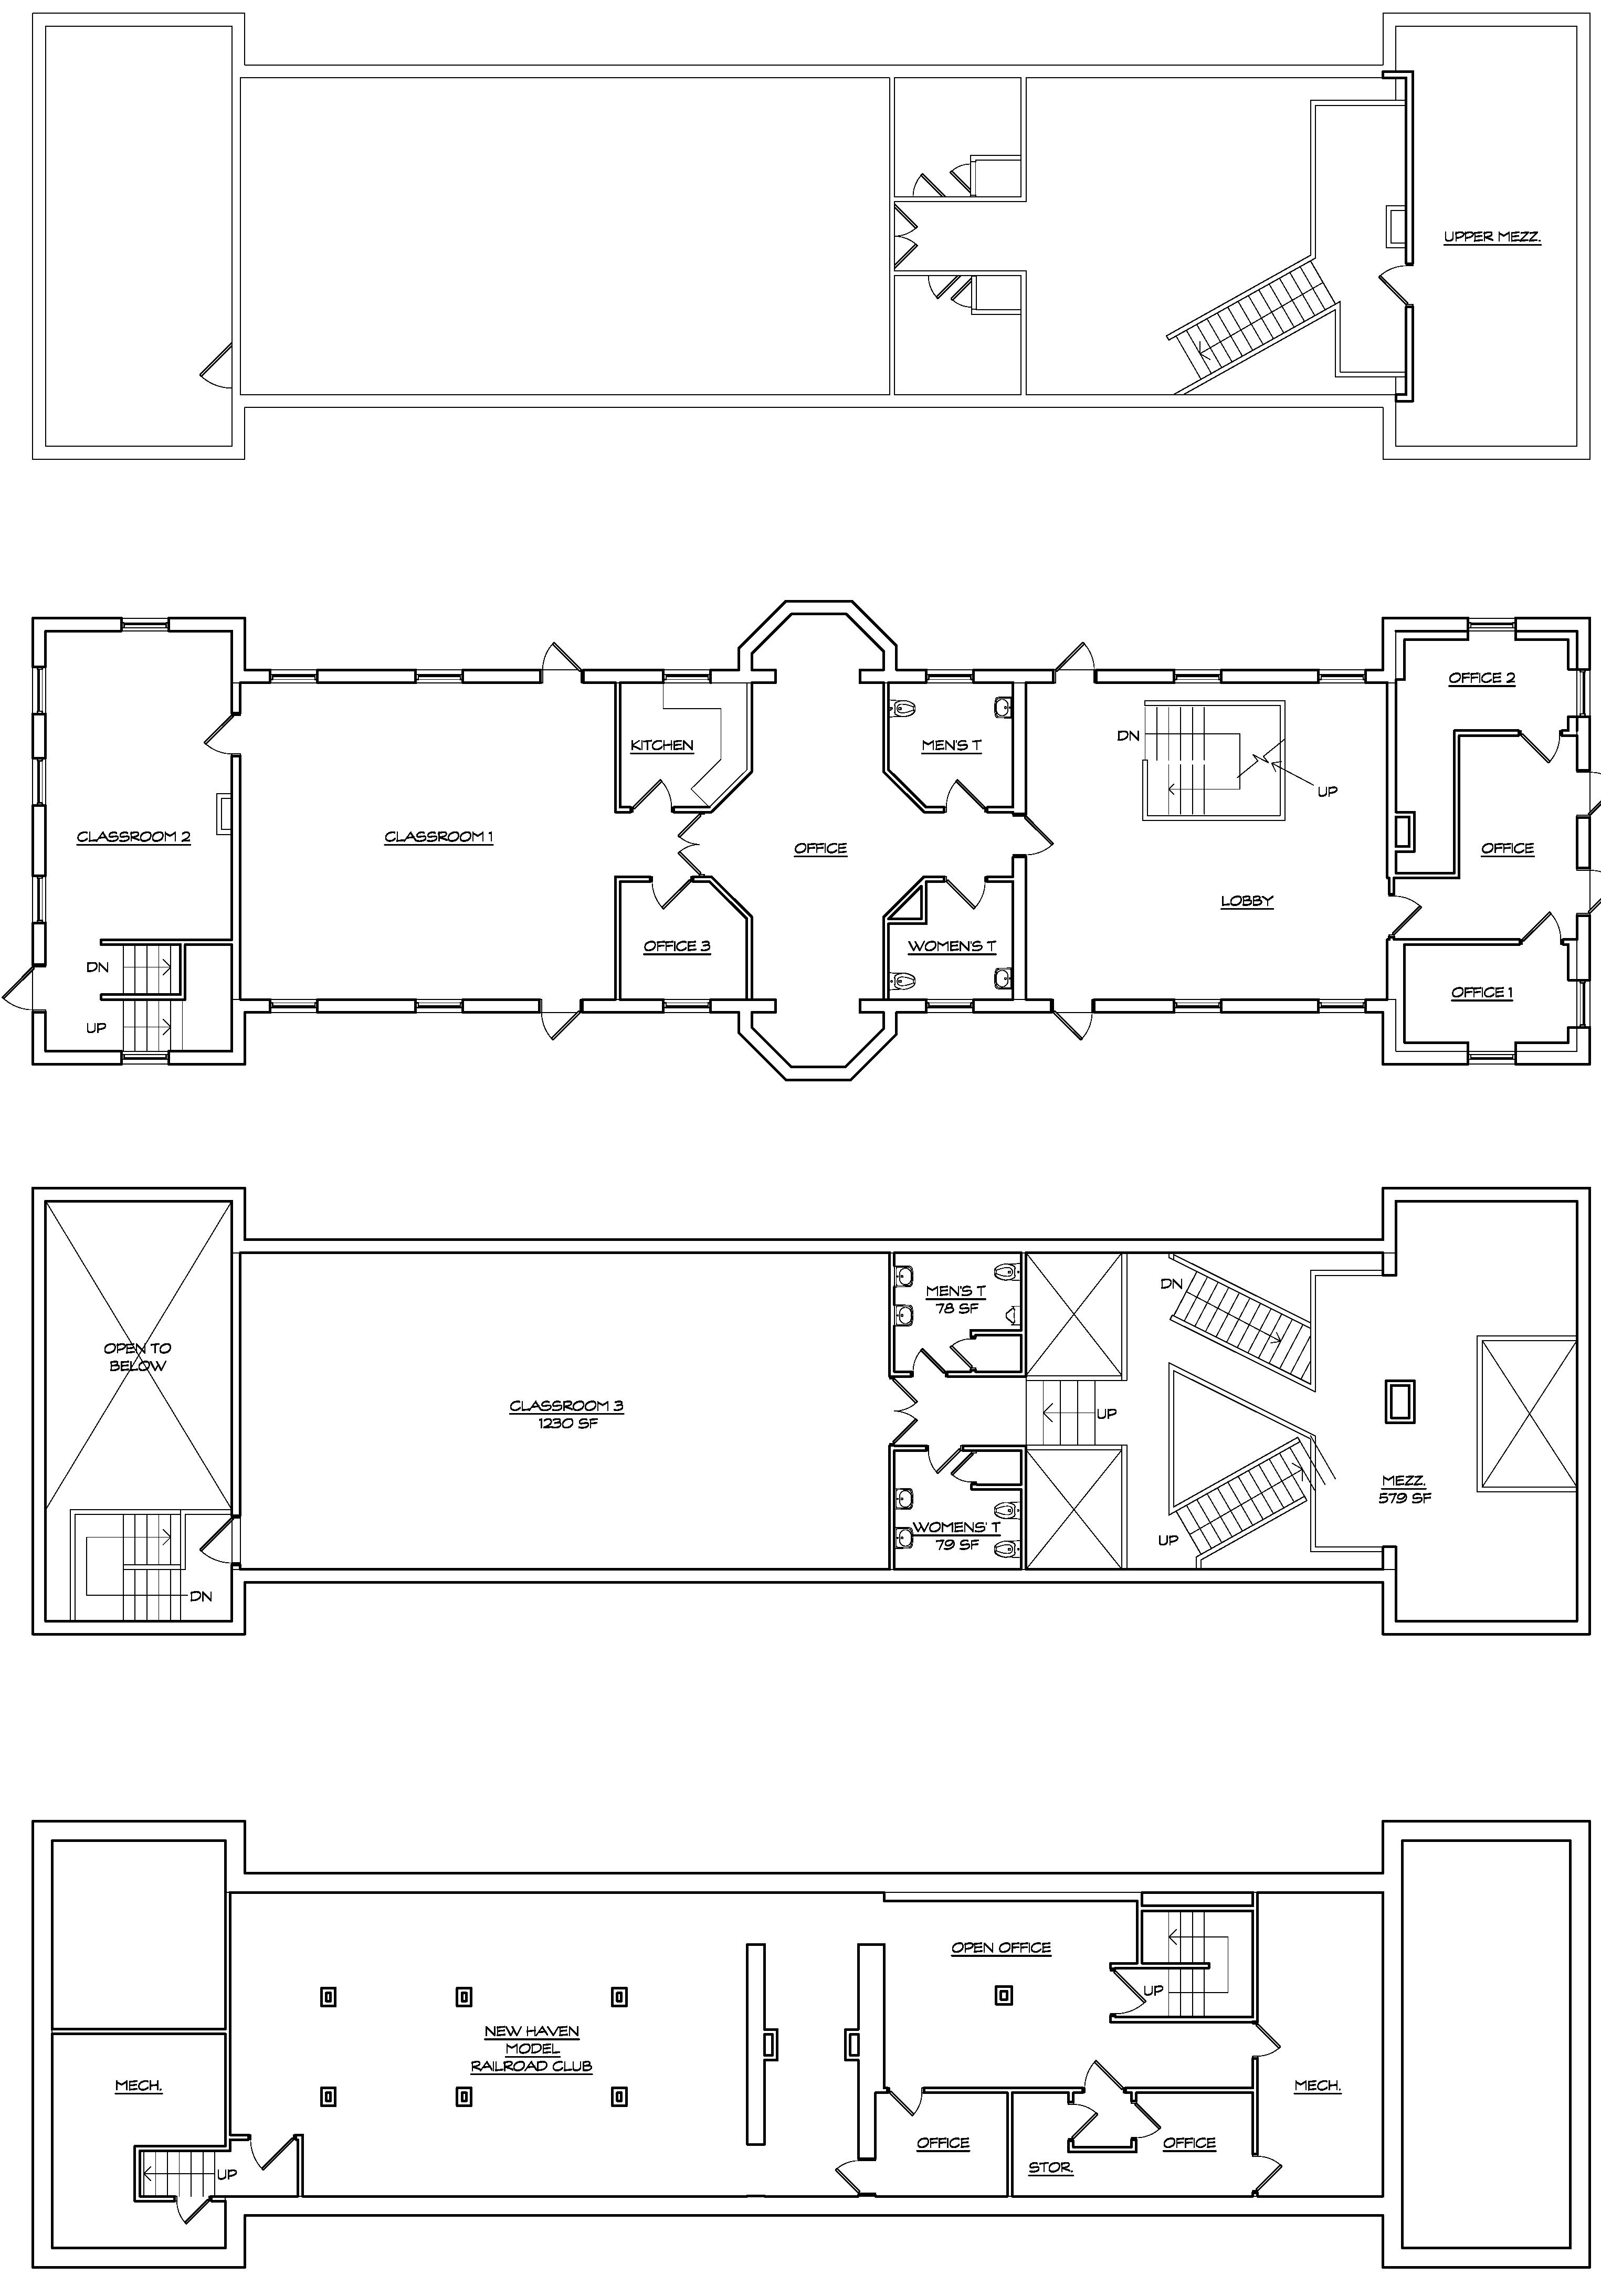
Programs Cost Central Office Adult Ed & Transition Academy Renovations to Police Station Project type Gross Square Feet cost per SF Subtotal Renovate main and 2nd floor to Central Office 14,855 300$
$ Renovate lower level to Adult Ed and Transition Academy 12,455 300$
$ Construction Subtotal 8,193,000$ Soft Costs @ 25% 2,048,250$ TOTAL 10,241,250$ School Construction - Central 26.61% Maximum Reimbursement* 1,482,343$ School Construction - Adult Ed 53.22% Maximum Reimbursement* 2,485,707$ ANTICIPATED TOWN SHARE 6,273,200$ * I f projects follow the Office of School Construction Grants & Review (OSCG&R) process and are deemed fully eligible 43
1. Consistent decline in enrollment
2. Utilization of the districts K-12 infrastructure
•
PreK- Grade 2: 87% average
• Grade 3- Grade 5: 79% average
• Middle School: 82% average
• High School: 68% average
3. Programmatic and Facility Improvements
• PreK -Grade 2: portables, restrooms, HVAC, STARS
• Grade 3 - Grade 5: restrooms, storage, HVAC, Benhaven
• Middle Schools: Science and HVAC
• High Schools: Science, CTE, Art, Music, Gym and HVAC
• Comparison of Alterations, Renovate as New and New Construction
4. Central Office, Adult Ed, Wallingford Transition Academy: Relocated to former Police Station
Conclusion
44
THANK YOU!
QUESTIONS?
45
Supplemental Information – Not included in PowerPoint Presentation
46
PreK
Elementary Schools:
• Cook Hill • Highland • Moses Y Beach • Stevens 47


Elementary Schools: PreK – Grade 2 Cook Hill Elementary School Key Plan Existing Cook Hill Elementary School (PK - 2) Addition: 2002 Existing Enrollment: 382 Students Construction: 1964 Space Division Quantity Square footage Subtotal Average Percentage GENERAL CLASSROOMS 16780-965 13,285 83023% PREK CLASSROOMS 5 782-853 4,250 850 7% SPECIAL EDUCATION/PPS 12116-801 5,064 422 9% SPECIALS (ART, MUSIC, COMPUTERS) 3 767-825 2,374 791 4% MEDIA CENTER 1 3,007 3007 5% PHYSICAL EDUCATION 2 1077-3165 4,307 2154 7% AUDITORIUM/STAGE 1 1,206 1206 2% FOOD SERVICE 2 2,750 1375 5% ADMINISTRATION 9 3,536 393 6% BUILDING INFRASTRUCTURE 4,001 7% CIRCULATION + STRUCTURE 14,448 25% TOTAL 58,228 47,750 DIFFERENCE 10,478 Max Classroom Capacity 336 Max Class Size Policy 21 Classroom Quantity 16 Max PreK Classroom Capacity 90 Max Class Size Policy 18 Classroom Quantity 5 Total Max Programed Capacity 426 Current Utilization 90% CONNECTICUT STATE SPACE STANDARD SPECIFICATIONS FOR 382 PREK - GRADE 2 STUDENTS 23% 7% 9% 4% 5%7%5%2% 6% 7% 25% CORE LEARNING 55% SCHOOL SUPPORT 13% FACILITY SUPPORT 32% 48
Plan


POTENTIALEXPANSION
PORTABLESEXCEEDED

Elementary Schools: PreK – Grade 2 Cook Hill Elementary School
USEFULLIFE,1998&OLDER RESTROOMS
Key
Cook Hill Elementary School Recommended Improvements and Alterations Renovate small restrooms 210,000$ Add 2 restrooms to K & SPED classrooms 170,000$ Remove mobile wall/rebuild 50,000$ Demo portables - Provide PreK additon 6,480,000$ HVAC 1,934,150$ Construction Subtotal 8,844,150$ Soft Costs @ 25% 2,211,038$ TOTAL 11,055,188$ School Construction Reimbursement Rate @ 53.22% 5,883,571$ Reduced Reimbursement* 4,824,835$ ANTICIPATED TOWN SHARE 6,230,352$ * I f projects follow the Office of School Construction Grants & Review (OSCG&R) process and are deemed fully eligible $429,664 $11,055,188 $$2,000,000 $4,000,000 $6,000,000 $8,000,000 $10,000,000 $12,000,000 $14,000,000 Cook Hill Projected Improvement Costs $11,484,852 RECOMMENDED ALTERATIONS CAPITAL NEEDS/STRATEGIC PLANNING 49


Elementary Schools: PreK – Grade 2 Highland Elementary School Existing Highland Elementary School (PreK - 2) Addition: 2002 Existing Enrollment: 303 Students Construction: 1958 Space Division Quantity Square footage Subtotal Average Percentage GENERAL CLASSROOMS 15 802 12,409 82726% PREK CLASSROOMS 2 946 2,059 946 4% SPECIAL EDUCATION/PPS 8 163-802 3,022 378 6% 2 639-1011 1,650 939 3% MEDIA CENTER 1 1,806 180613% WISE PROGRAM 2 1,704 852 4% PHYSICAL EDUCATION 1 3,429 3429 7% AUDITORIUM/STAGE 1 216 216 0% FOOD SERVICE 2 3,246 1623 7% ADMINISTRATION 6 114-1029 1,757 293 4% BUILDING INFRASTRUCTURE 3,135 6% CIRCULATION + STRUCTURE 13,806 29% TOTAL 48,239 37,875 DIFFERENCE 10,364 Max Classroom Capacity 315 Max Class Size Policy 21 Classroom Quantity 15 Max PreK Classroom Capacity 36 Max Class Size Policy 18 Classroom Quantity 2 Total Max Programed Capacity 351 Current Utilization 86% CONNECTICUT STATE SPACE STANDARD SPECIFICATIONS FOR 303 PreK - GRADE 2 STUDENTS SPECIALS (ART, MUSIC, COMPUTERS) 26% 4% 6% 3% 4%4%7%7%0% 4% 6% 29% CORE LEARNING 54% SCHOOL SUPPORT 11% FACILITY SUPPORT 35% 50


Elementary Schools: PreK – Grade 2 Highland Elementary School LONGCORRIDORS /SPRAWLING FIXEDPODSIZE -SECTIONS RESTROOMS Highland Elementary School Recommended Improvements and Alterations Renovate restrooms 750,000$ HVAC 2,062,350$ Construction Subtotal 2,812,350$ Soft Costs @ 25% 703,088$ TOTAL 3,515,438$ School Construction Reimbursement Rate @ 53.22% 1,870,916$ Reduced Reimbursement* 1,468,955$ ANTICIPATED TOWN SHARE 2,046,482$ * I f projects follow the Office of School Construction Grants & Review (OSCG&R) process and are deemed fully eligible $786,748 $3,515,438 $$1,000,000 $2,000,000 $3,000,000 $4,000,000 $5,000,000 Highland Projected Improvement Costs$4,302,186 RECOMMENDED ALTERATIONS CAPITAL NEEDS/STRATEGIC PLANNING 51
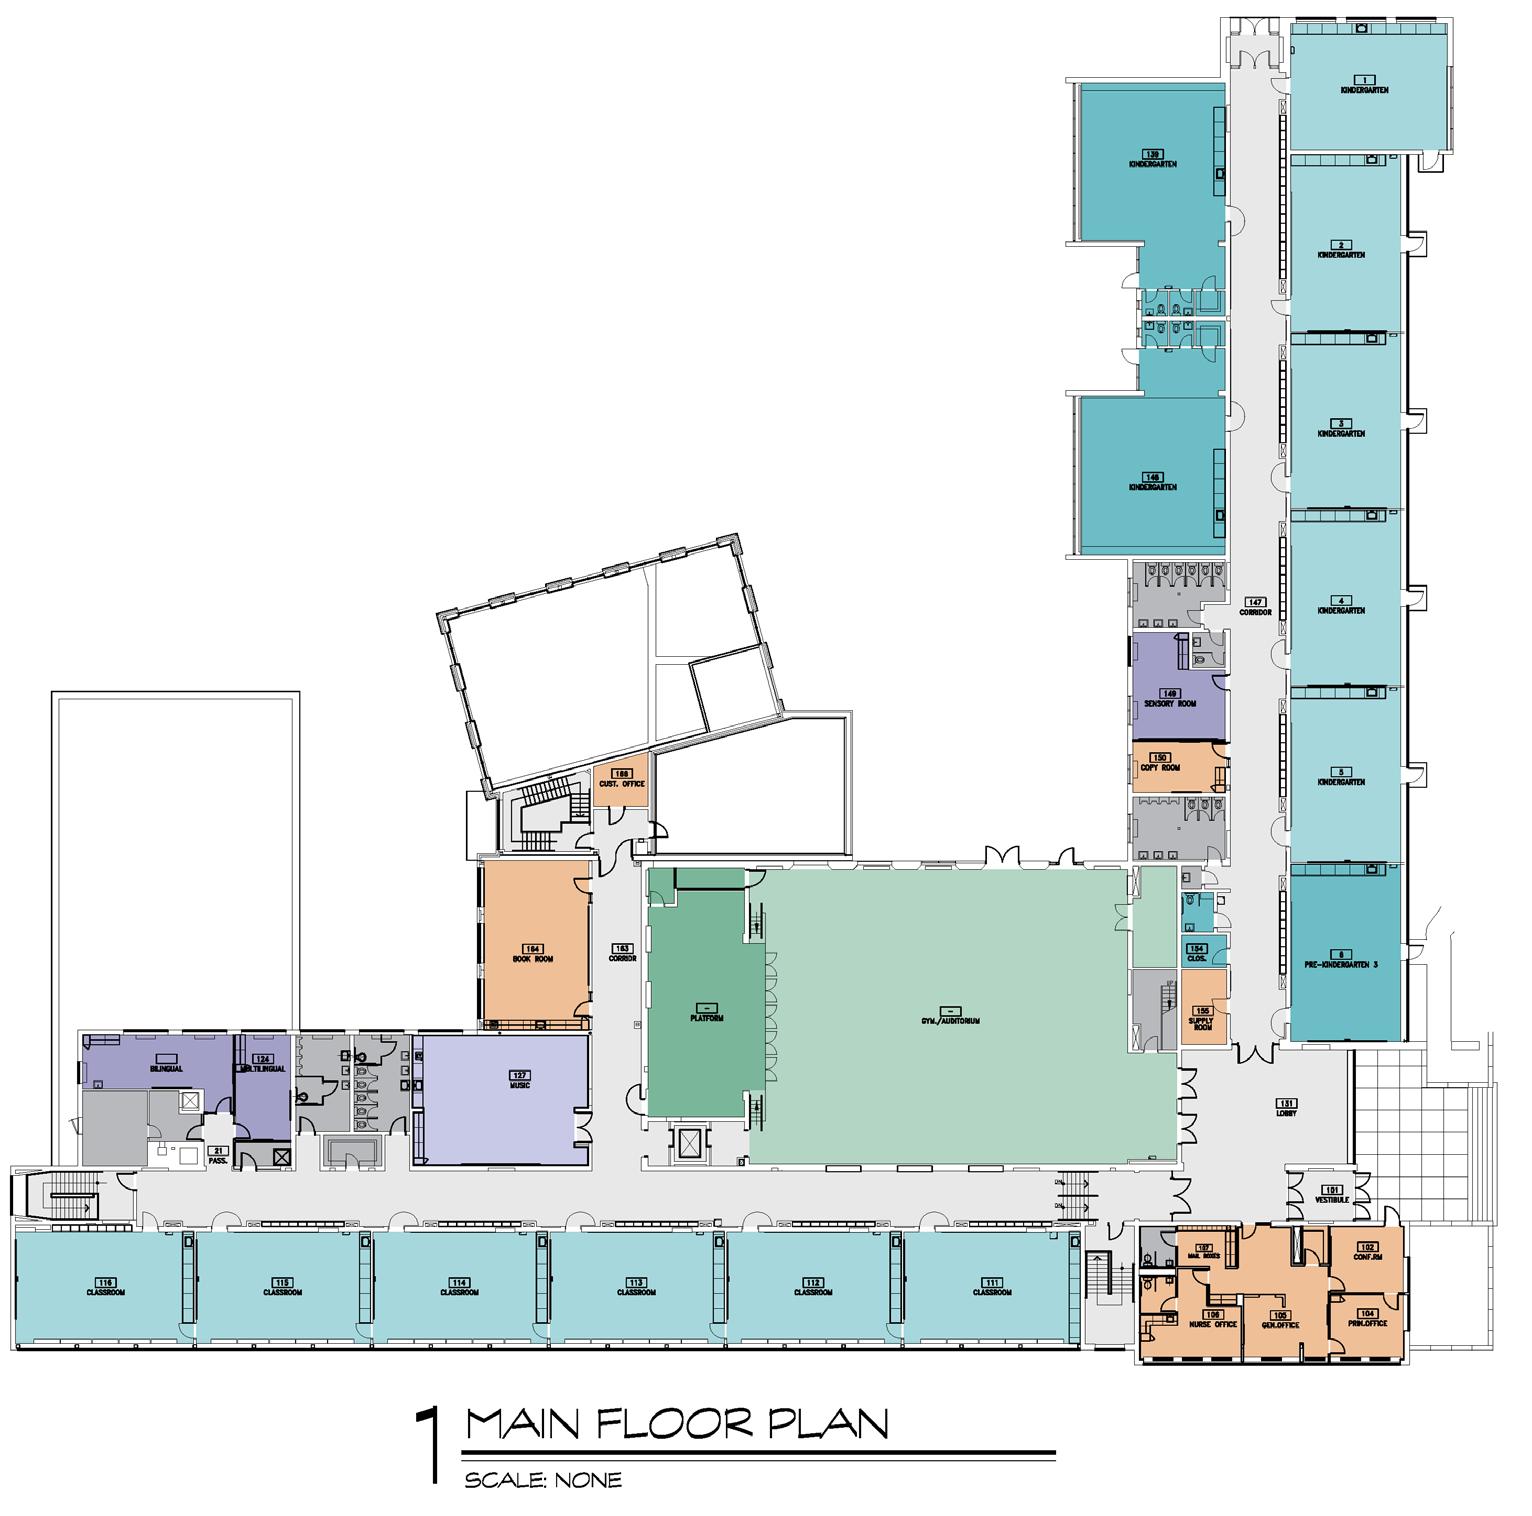


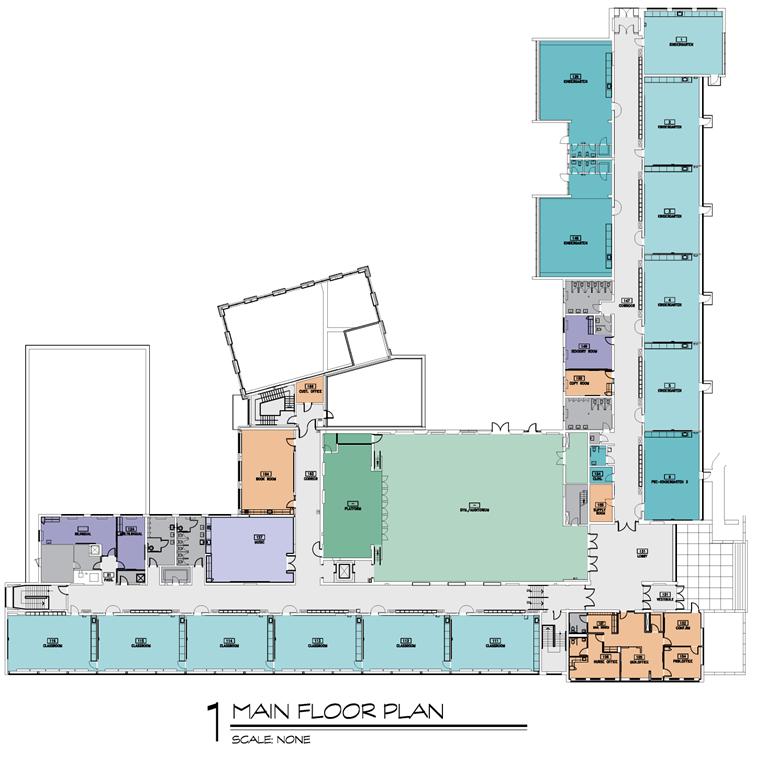
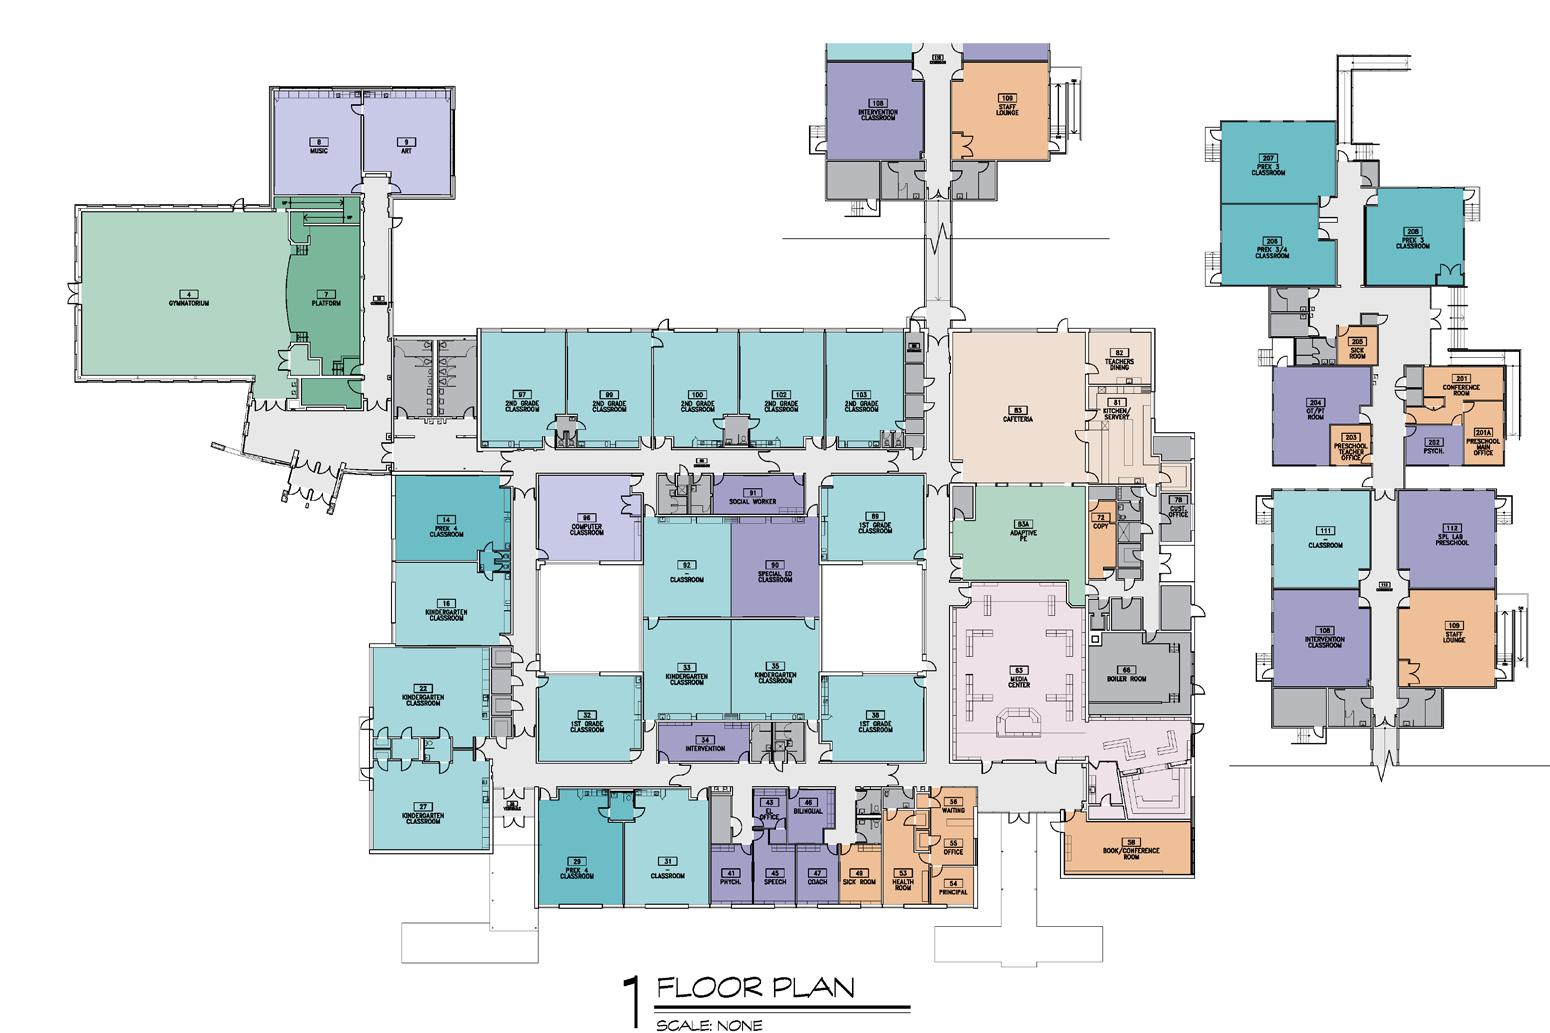
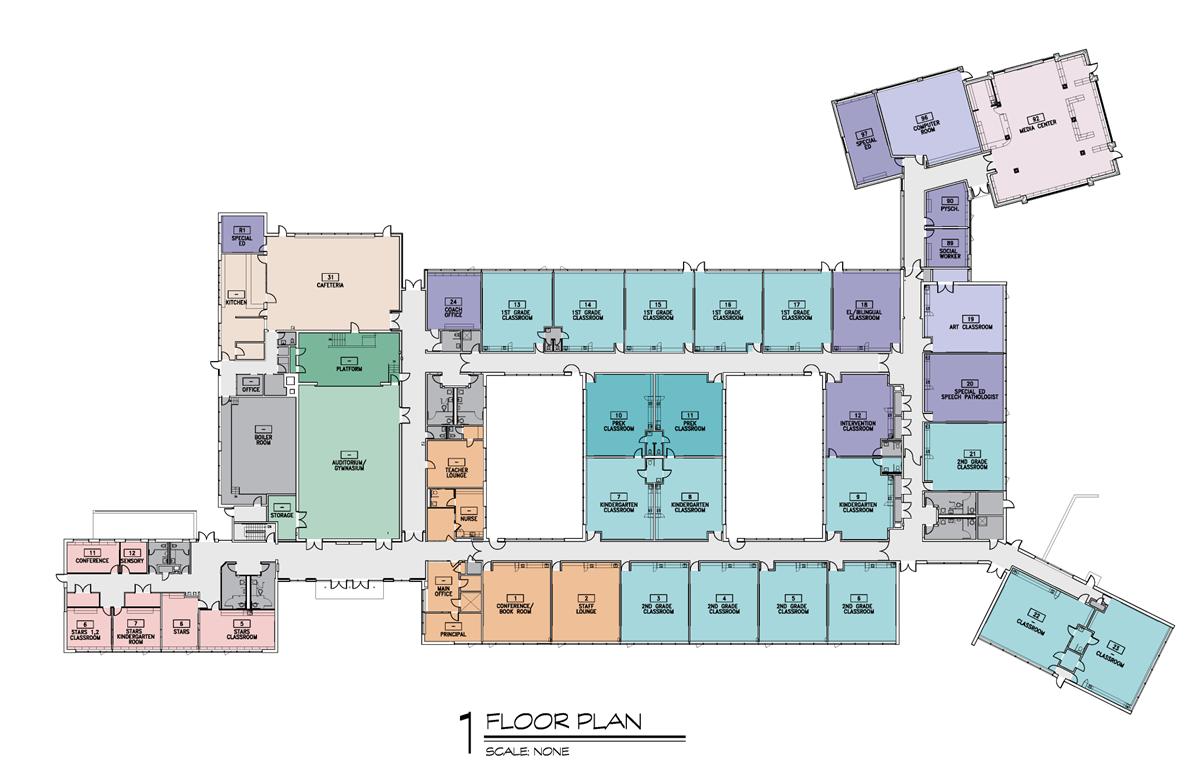
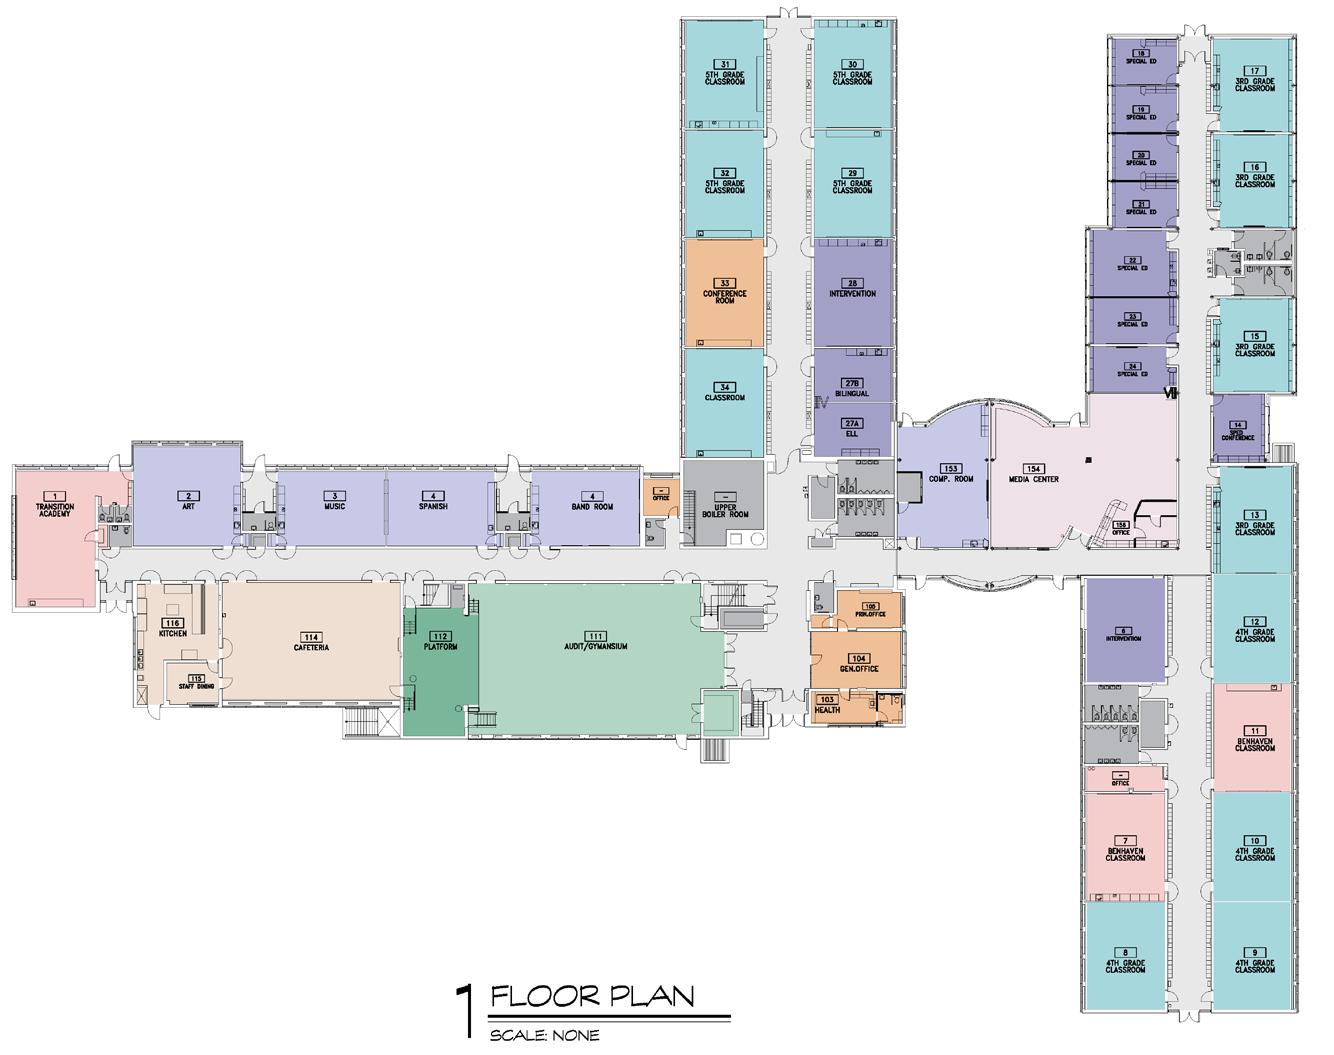
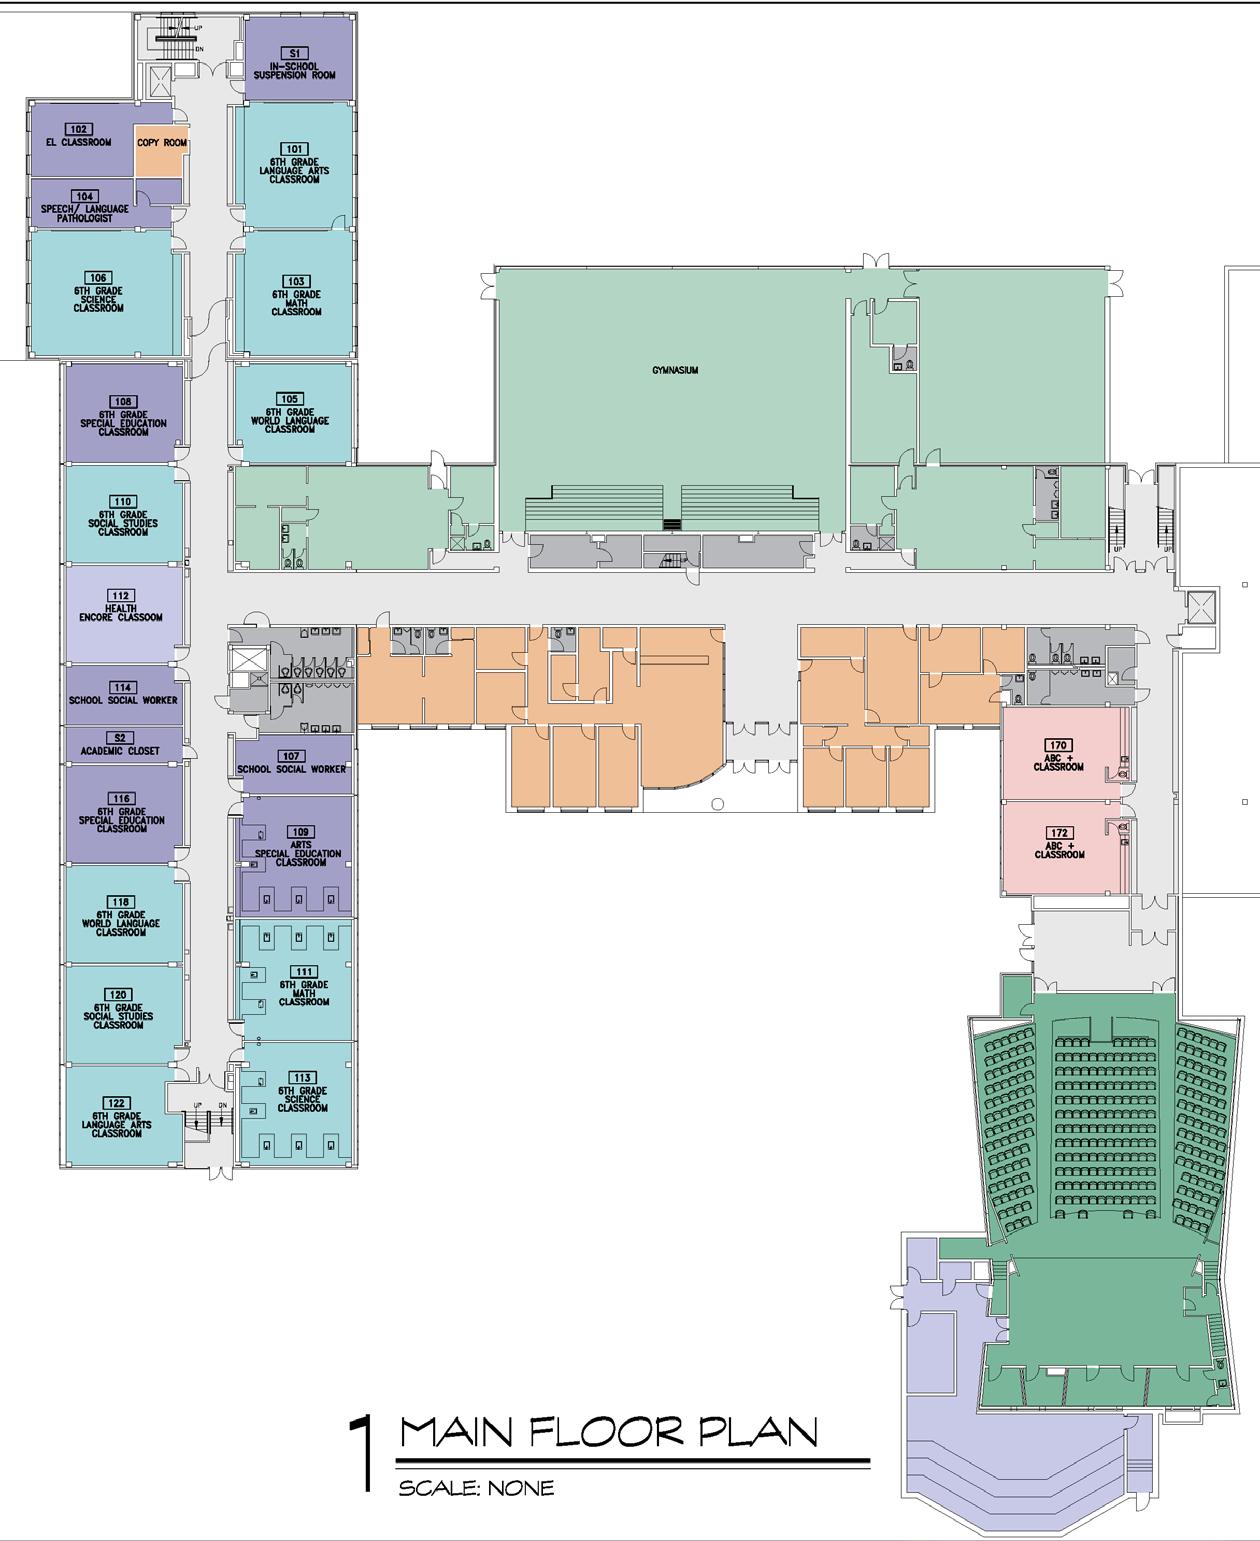
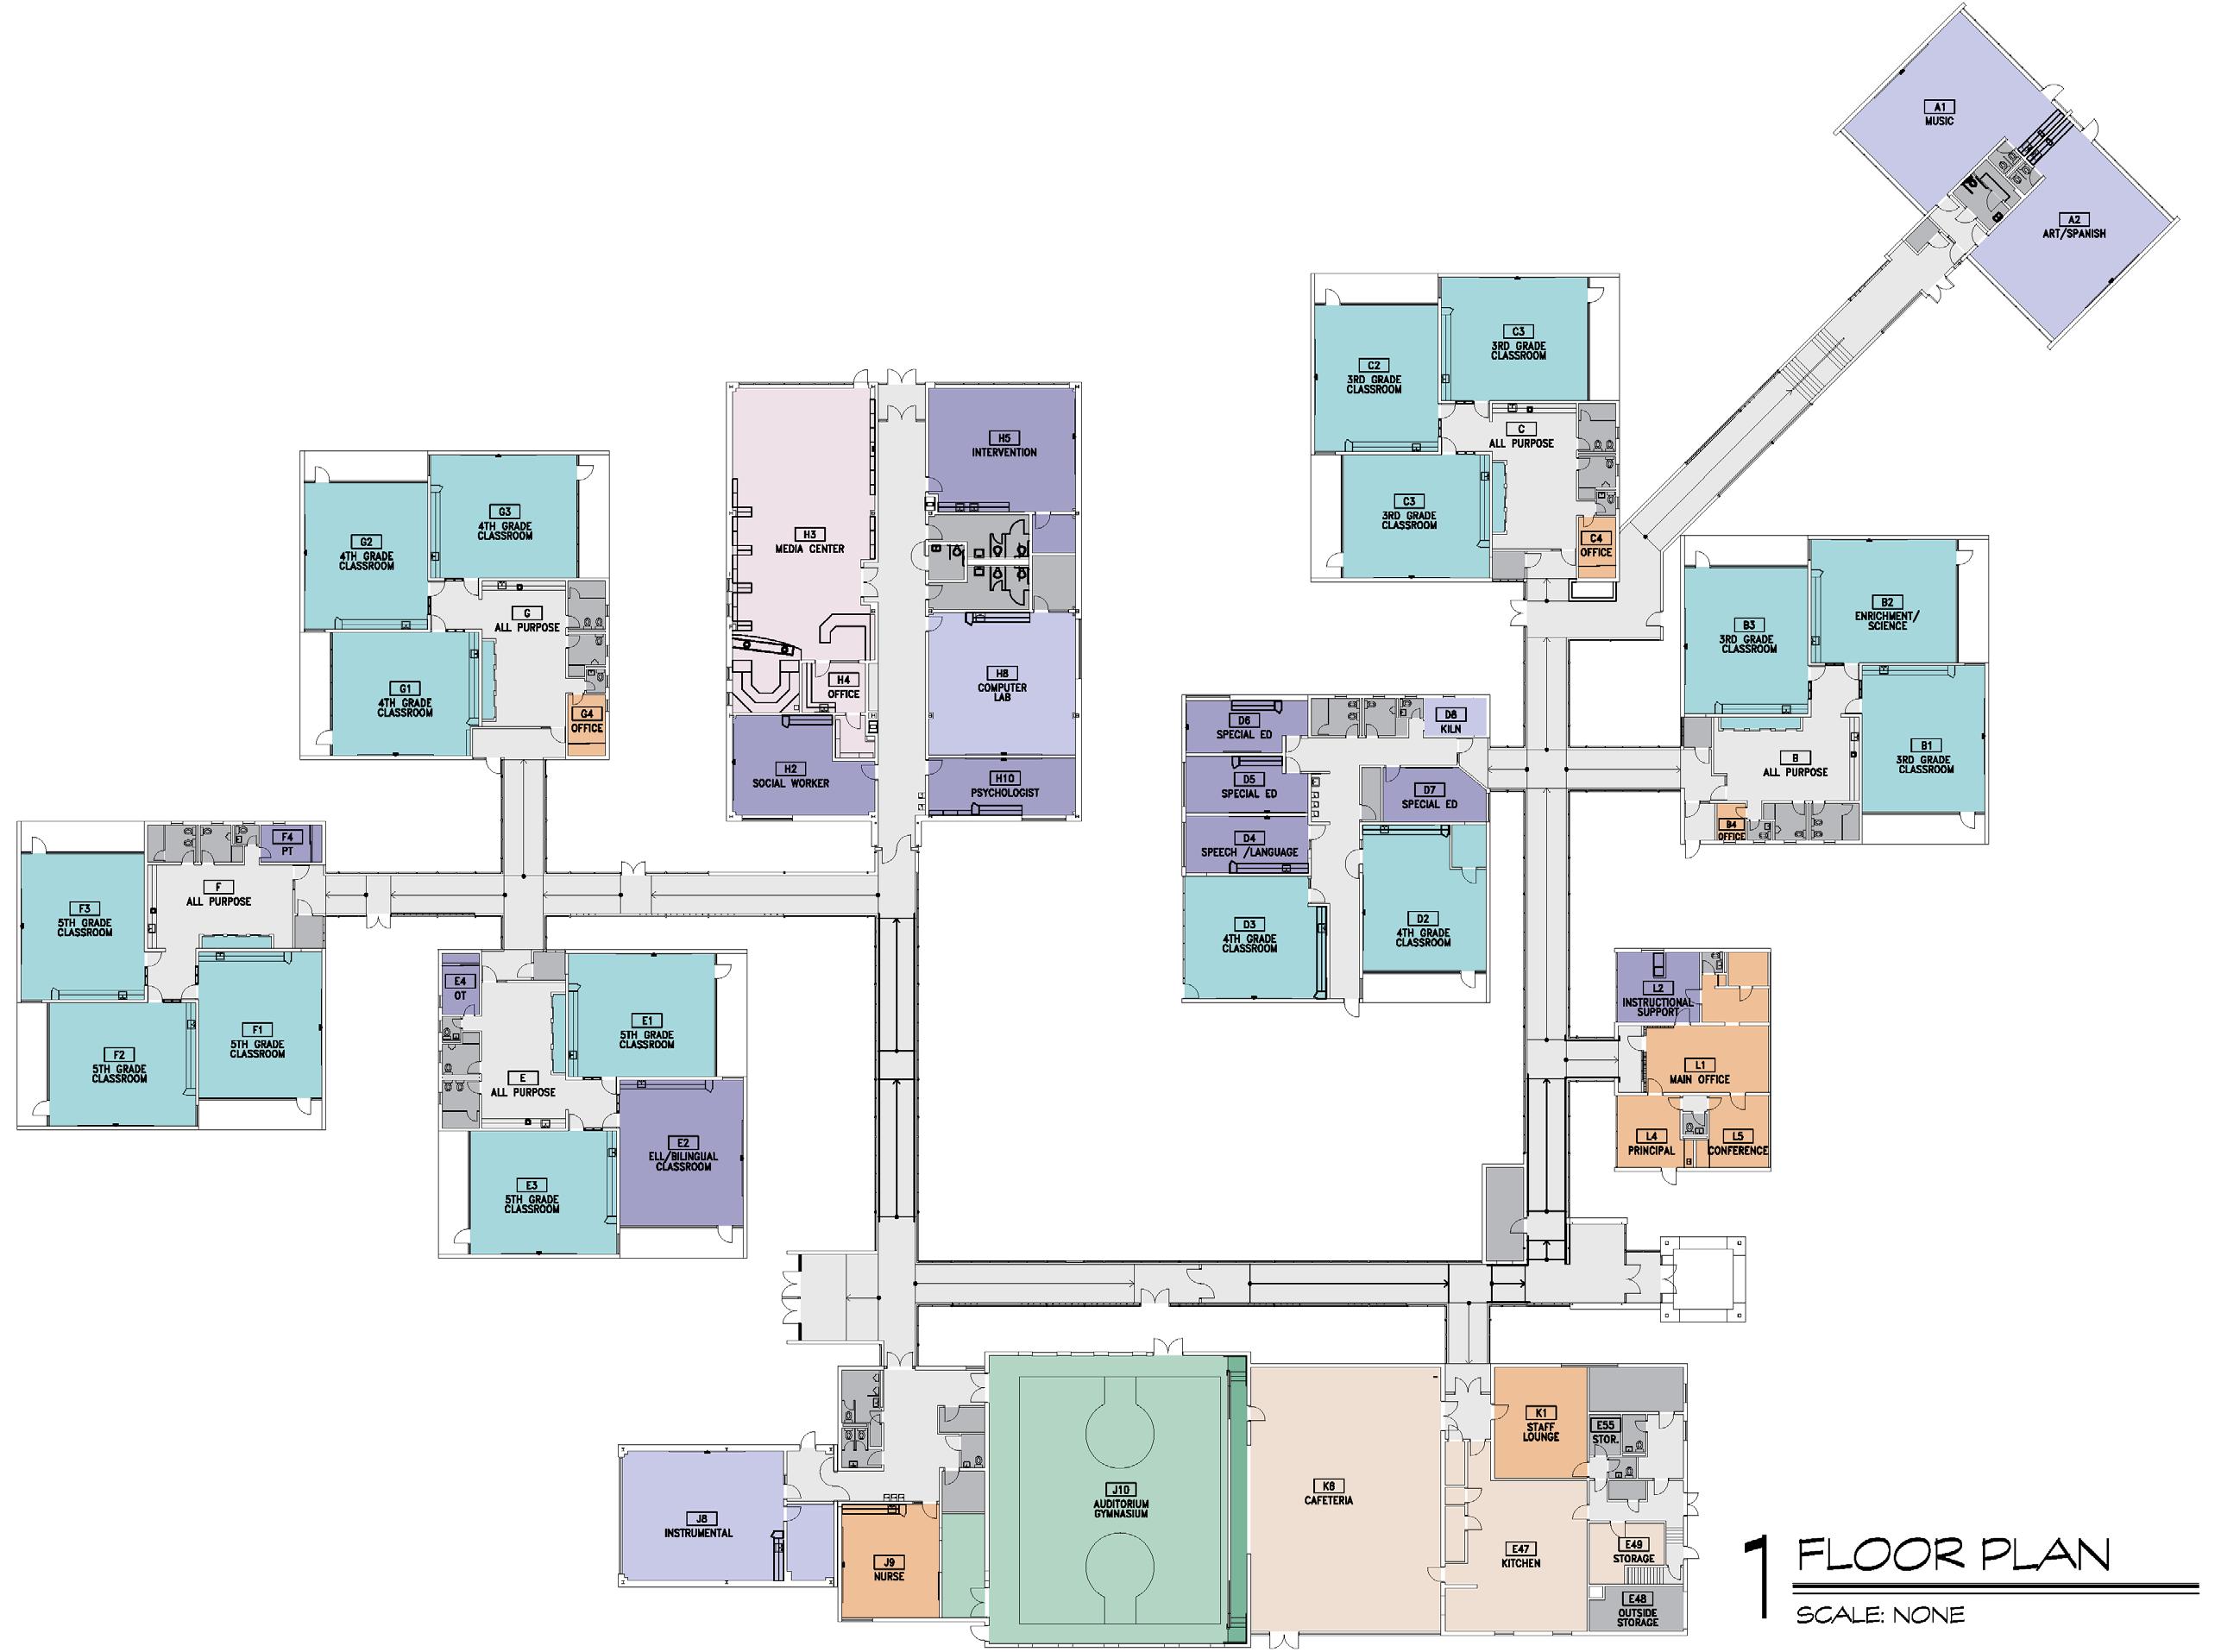
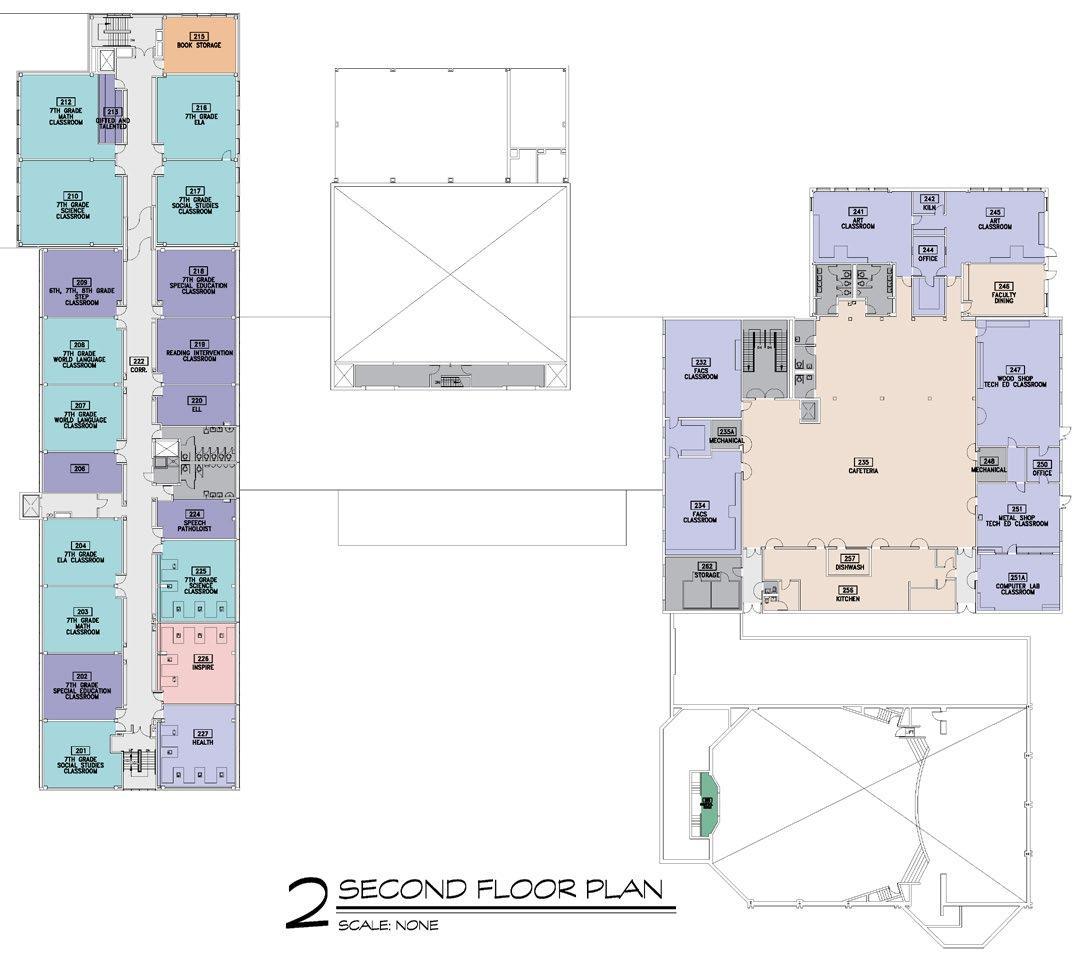
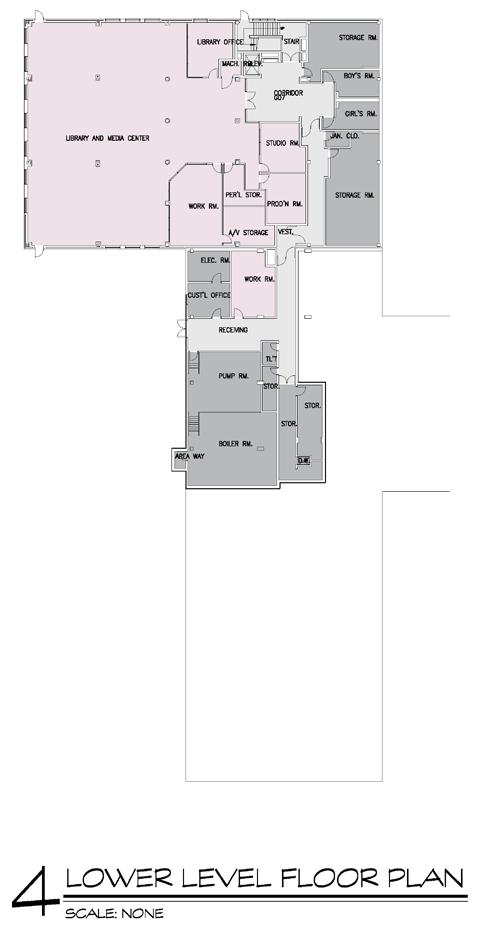
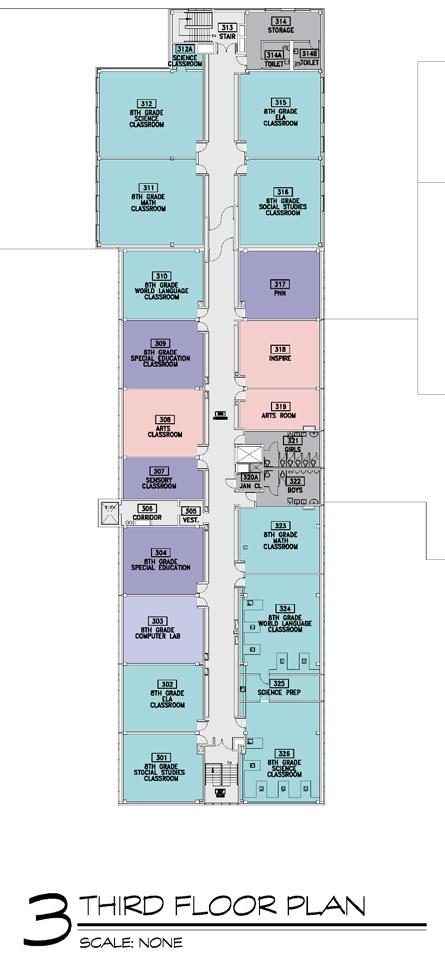
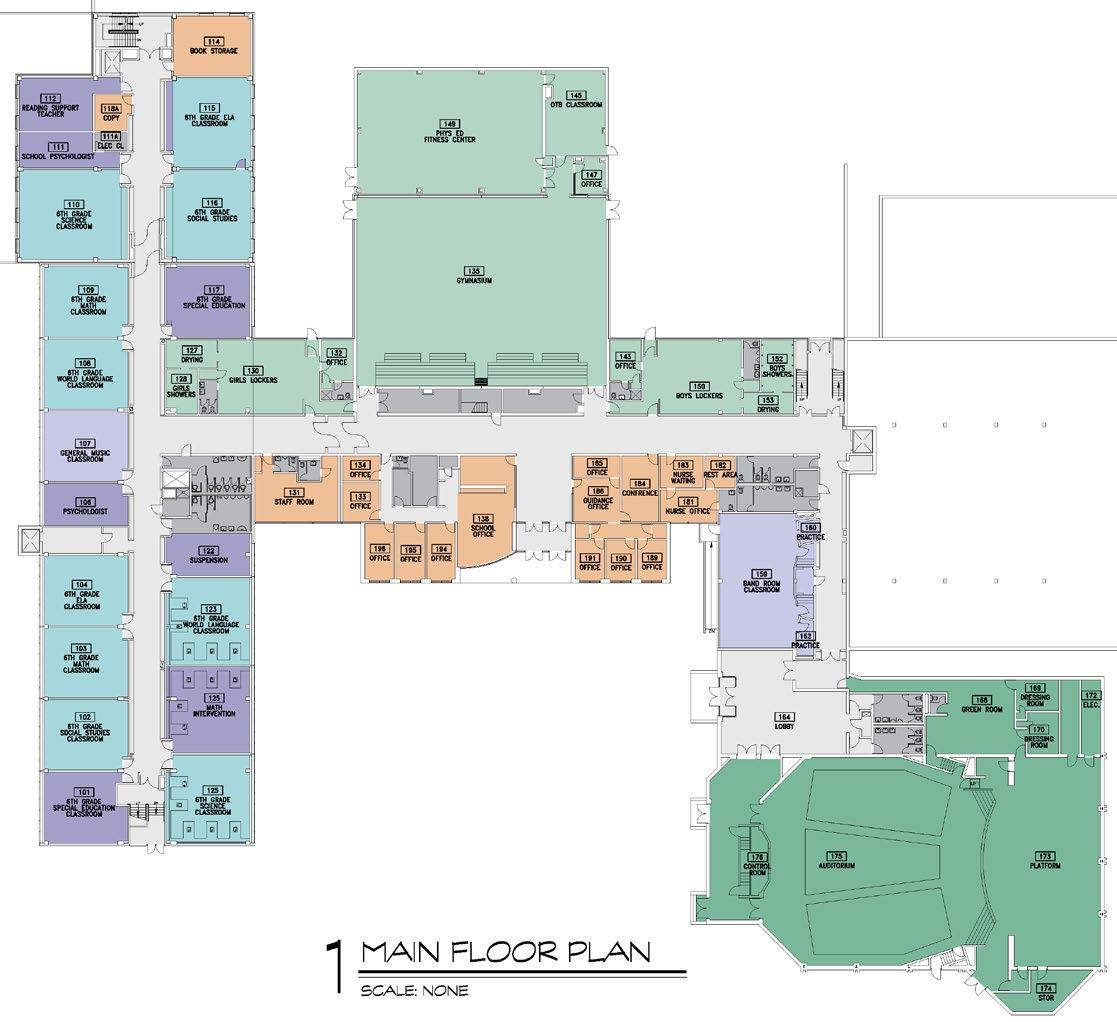
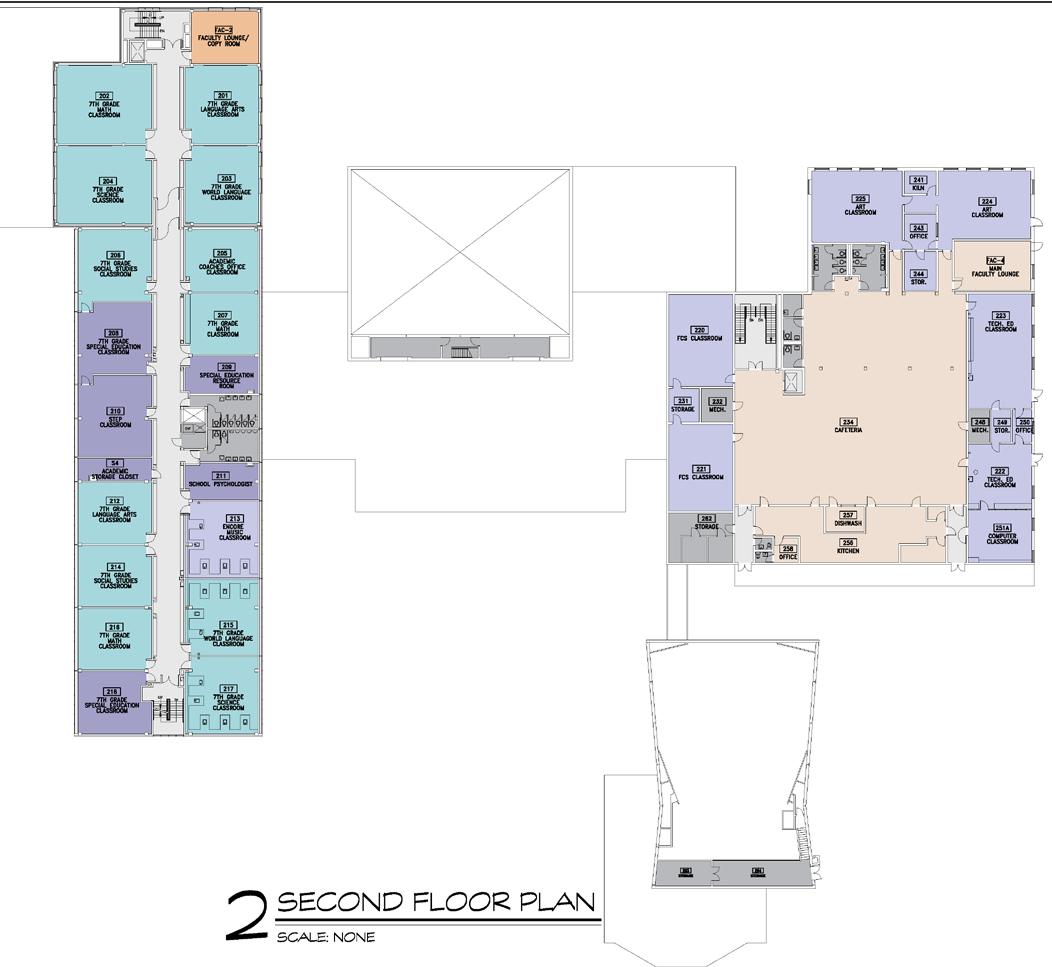
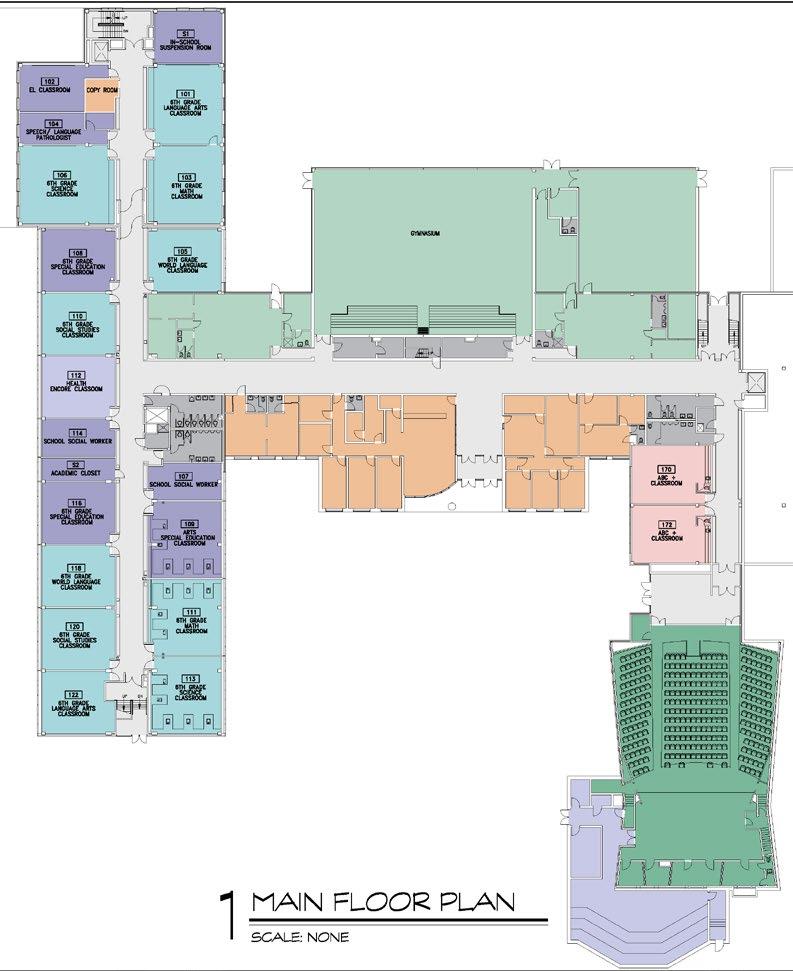
Elementary Schools: PreK – Grade 2 Moses Y Beach Elementary School Existing Moses Y Beach Elementary School (PK -2) Addition: 2002 Existing Enrollment: 332 Students Construction: 1951 Space Division Quantity Square footage Subtotal Average Percentage GENERAL CLASSROOMS 17797-817 13,608 80023% PREK CLASSROOMS 3 804-940 3,302 1101 6% SPECIAL EDUCATION/PPS 9 216-548 2,911 323 5% SPECIALS (ART, MUSIC, COMPUTERS) 3 848-900 2,759 920 5% MEDIA CENTER 1 2,107 2107 4% PHYSICAL EDUCATION 1 4,875 4875 8% AUDITORIUM/STAGE 1 1,098 1098 2% FOOD SERVICE 2 3,052 1526 5% ADMINISTRATION 9 286-621 3,226 358 5% BUILDING INFRASTRUCTURE 2,741 5% CIRCULATION + STRUCTURE 19,424 33% TOTAL 59,103 41,500 DIFFERENCE 17,603 Max Classroom Capacity 357 Max Class Size Policy 21 Classroom Quantity 17 Max PreK Classroom Capacity 54 Max Class Size Policy 18 Classroom Quantity 3 Total Max Programed Capacity 411 Current Utilization 81% CONNECTICUT STATE SPACE STANDARD SPECIFICATIONS FOR 332 PREK - GRADE 2 STUDENTS 23% 6% 5% 5% 3% 8%5%2% 5% 5% 33% CORE LEARNING 50% SCHOOL SUPPORT 12% FACILITY SUPPORT 38% 52
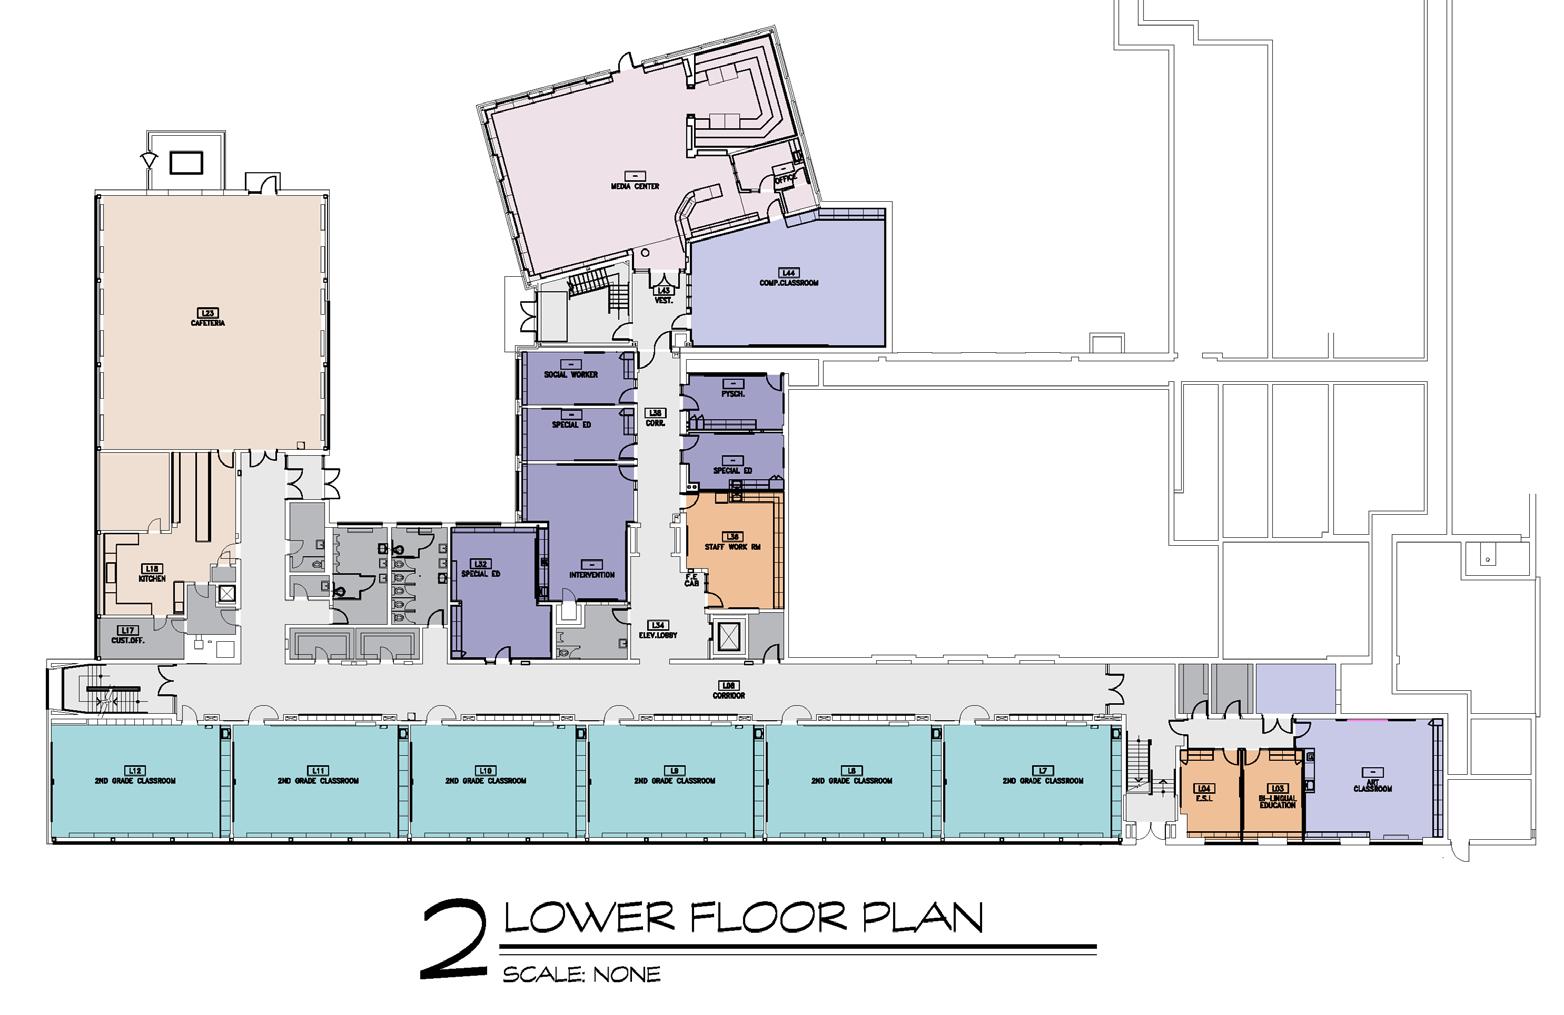
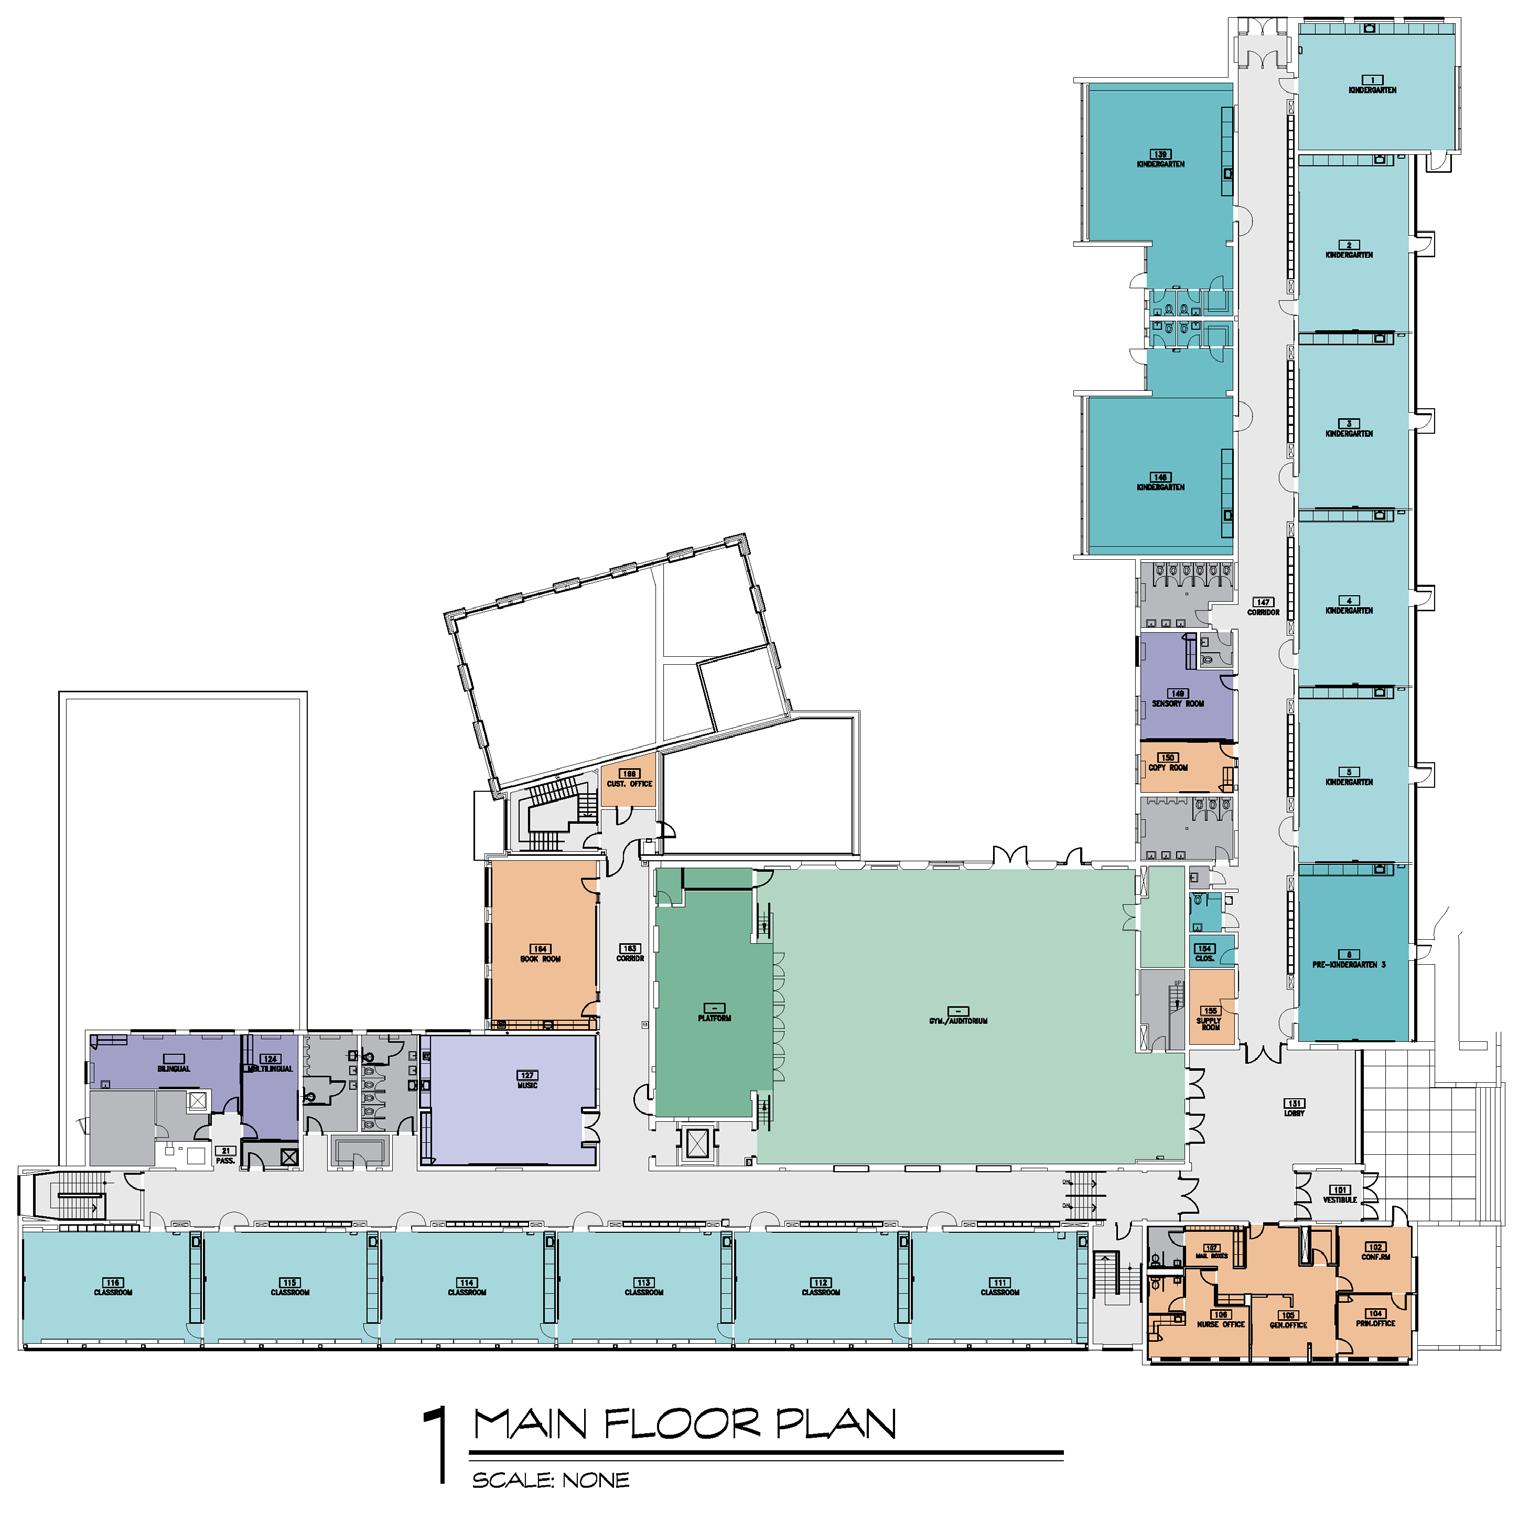


Elementary Schools: PreK – Grade 2 Moses Y Beach Elementary School LACKOFPARKING/ PARENTPICKUP STAFFRESTROOM USEDFORPREK Moses Y Beach Elementary School Recommended Improvements and Alterations Add restroom to PreK 85,000$ Add staff restroom 85,000$ Improve classroom storage 59,500$ Redesign front parking 150,000$ HVAC 2,688,500$ Construction Subtotal 3,068,000$ Soft Costs @ 25% 767,000$ TOTAL 3,835,000$ School Construction Reimbursement Rate @ 53.22% 2,040,987$ Reduced Reimbursement* 1,433,108$ ANTICIPATED TOWN SHARE 2,401,892$ * I f projects follow the Office of School Construction Grants & Review (OSCG&R) process and are deemed fully eligible $633,989 $3,835,000 $$1,000,000 $2,000,000 $3,000,000 $4,000,000 $5,000,000 Moses Y Beach Projected Improvement Costs$4,468,989 RECOMMENDED ALTERATIONS CAPITAL NEEDS/STRATEGIC PLANNING 53


Existing E.C. Stevens Elementary School (PK - 2) Additions: 2002 Existing Enrollment: 331 Students Construction: 1962 Space Division Quantity Square footage Subtotal Average Percentage GENERAL CLASSROOMS 15756-960 12,277 81825% PREK CLASSROOMS 2 767 1,599 767 3% SPECIAL EDUCATION/PPS 7 237-780 3,989 570 8% SPECIALS (ART, MUSIC, COMPUTERS) 3 773-1005 2,623 874 5% MEDIA CENTER 1 2,231 2231 4% STARS PROGRAM 1 1,915 1915 4% PHYSICAL EDUCATION 2 1077-3165 2,423 1212 5% AUDITORIUM/STAGE 1 795 795 2% FOOD SERVICE 2 2,466 1233 5% ADMINISTRATION 9 2,959 329 6% BUILDING INFRASTRUCTURE 3,118 6% CIRCULATION + STRUCTURE 13,510 27% TOTAL 49,905 41,375 DIFFERENCE Max Classroom Capacity 315 Max Class Size Policy 21 Classroom Quantity 15 Max PreK Classroom Capacity 36 Max Class Size Policy 18 Classroom Quantity 2 Total Max Programed Capacity 351 Current Utilization 90% CONNECTICUT STATE SPACE STANDARD SPECIFICATIONS FOR 331 PREK - GRADE 2 STUDENTS 25% 3% 8% 5% 4%4%5%2%5% 6% 6% 27% CORE LEARNING 54% SCHOOL SUPPORT 13% FACILITY SUPPORT 33% Elementary Schools: PreK – Grade 2 Stevens Elementary School 54


Elementary Schools: PreK – Grade 2 Stevens Elementary School STARSRESTROOMS PROGRAM–UNDERSIZEDSPACE E. C. Stevens Elementary School Recommended Improvements and Alterations Renovate small restrooms and add one 375,000$ Redesign STARS 1,040,000$ Improve classroom storage 45,500$ HVAC 2,134,650$ Construction Subtotal 3,595,150$ Soft Costs @ 25% 898,788$ TOTAL 4,493,938$ School Construction Reimbursement Rate @ 53.22% 2,391,674$ Reduced Reimbursement* 2,066,610$ ANTICIPATED TOWN SHARE 2,427,327$ * I f projects follow the Office of School Construction Grants & Review (OSCG&R) process and are deemed fully eligible $1,012,284 $4,620,313 $$1,000,000 $2,000,000 $3,000,000 $4,000,000 $5,000,000 $6,000,000 Stevens Projected Improvement Costs $5,632,597 RECOMMENDED ALTERATIONS CAPITAL NEEDS/STRATEGIC PLANNING 55
Elementary Schools: PreK – Grade 2 Elementary Schools Summary PreK - 2 Schools Cost Needs Comparison Chart Cook Hill Highland Moses Y Beach Stevens TOTAL STRATEGIC & CAPITAL NEEDS 429,664$ 786,748$ 633,989$ 1,012,284$ 2,862,685$ 11,055,188$ 3,515,438$ 3,835,000$ 4,620,313$ 23,025,938$ TOTAL 11,484,852$ 4,302,186$ 4,468,989$ 5,632,597$ 25,888,623$ 5,883,571$ 1,870,916$ 2,040,987$ 2,458,930$ 12,254,404$ ANTICIPATED TOWN SHARE* 5,254,499$ 2,657,664$ 2,674,976$ 3,050,922$ 13,638,061$ PAST SCG INVESTMENT 7,948,731$ 8,063,123$ 7,884,816$ 7,192,976$ 31,089,646$ PER: https://www.csde.state.ct.us/public/scgms/reports.asp RECOMMENDED IMPROVEMENTS & ALTERATIONS Maximum Reimbursement* * If projects follow the Office of School Construction Grants & Review (OSCG&R) process and are deemed fully eligible 56
Elementary Schools: Grade 3 • Fritz • Parker Farms • Pond Hill • Rock Hill 57
Fritz


Elementary Schools: Grade 3 – Grade 5 Mary
Elementary School Existing Mary G. Fritz Elementary School (3 - 5) Additions: 1995 Existing Enrollment: 290 Students Construction: 1925 Space Division Quantity Square footage Subtotal Average Percentage GENERAL CLASSROOMS 17664-845 13,643 80320% SPECIAL EDUCATION/PPS 11124-811 3,320 302 5% 5 849-1027 4,827 965 7% MEDIA CENTER 1 3,971 397120% 12167-1019 6,081 507 9% PHYSICAL EDUCATION 1 4,437 4437 6% AUDITORIUM/STAGE 1 1,168 1168 2% FOOD SERVICE 2 6,097 3049 9% ADMINISTRATION 8 286-621 2,118 265 3% BUILDING INFRASTRUCTURE 3,784 5% CIRCULATION + STRUCTURE 19,373 28% TOTAL 68,819 36,250 DIFFERENCE Max Classroom Capacity 391 Max Class Size Policy 23 Classroom Quantity 17 Total Max Programed Capacity 391 Current Utilization 74% CONNECTICUT STATE SPACE STANDARD SPECIFICATIONS FOR 290 GRADE 3 - GRADE 5 STUDENTS SPECIALS (ART, MUSIC, COMPUTERS, SPANISH, MAKERS) WISE PROGRAM / CENTER FOR INNOVATION & DESIGN 20% 5% 7% 6% 9% 6%2% 9% 3% 5% 28% CORE LEARNING 53% SCHOOL SUPPORT 14% FACILITY SUPPORT 34% 58
STAGEUSEDFOR

STORAGE


Elementary Schools: Grade 3 – Grade 5 Mary Fritz Elementary School
Mary G. Fritz Elementary School Recommended Improvements and Alterations Alteration to incorporate storage 160,000$ HVAC 3,136,500$ Construction Subtotal 3,296,500$ Soft Costs @ 25% 824,125$ TOTAL 4,120,625$ School Construction Reimbursement Rate @ 53.22% 2,192,997$ Reduced Reimbursement* 1,155,148$ ANTICIPATED TOWN SHARE 2,965,477$ * I f projects follow the Office of School Construction Grants & Review (OSCG&R) process and are deemed fully eligible $1,318,851 $4,120,625 $$1,000,000 $2,000,000 $3,000,000 $4,000,000 $5,000,000 $6,000,000 Fritz Projected Improvement Costs $5,439,476 RECOMMENDED ALTERATIONS CAPITAL NEEDS/STRATEGIC PLANNING 59


Elementary Schools: Grade 3 – Grade 5 Parker Farms Elementary School Existing Parker Farms Elementary School (3 - 5) Additions: 2002 Existing Enrollment: 232 Students Construction: 1955 Space Division Quantity Square footage Subtotal Average Percentage GENERAL CLASSROOMS 13621-722 8,995 69219% SPECIAL EDUCATION/PPS 11101-802 4,580 41610% 4 690-940 3,921 939 8% MEDIA CENTER 1 2,184 218416% BENHAVEN & TRANISTION PROGRAM 4 2,642 661 6% PHYSICAL EDUCATION 1 3,172 3172 7% AUDITORIUM/STAGE 1 777 777 2% FOOD SERVICE 2 2,592 1296 5% ADMINISTRATION 5 114-1029 2,646 529 6% BUILDING INFRASTRUCTURE 2,209 5% CIRCULATION + STRUCTURE 13,735 29% TOTAL 47,453 29,052 DIFFERENCE 18,401 Max Classroom Capacity 299 Max Class Size Policy 23 Classroom Quantity 13 Total Max Programed Capacity 299 Current Utilization 78% CONNECTICUT STATE SPACE STANDARD SPECIFICATIONS FOR 232 GRADE 3 - GRADE 5 STUDENTS SPECIALS (ART, MUSIC, COMPUTERS, SPANISH) 19% 10% 8% 5% 5%7%2%5% 5% 5% 29% CORE LEARNING 54% SCHOOL SUPPORT 13% FACILITY SUPPORT 33% 60


Elementary Schools: Grade 3 – Grade 5 Parker Farms Elementary School NEEDHANDICAP RESTROOM Parker Farms Elementary School Recommended Improvements and Alterations Benhaven restroom and swing 100,000$ HVAC 2,131,150$ Construction Subtotal 2,231,150$ Soft Costs @ 25% 557,788$ TOTAL 2,788,938$ School Construction Reimbursement Rates 53.22% School Construction Reimbursement Rate @ 53.22% 1,484,273$ Reduced Reimbursement* 908,711$ ANTICIPATED TOWN SHARE 1,880,226$ * I f projects follow the Office of School Construction Grants & Review (OSCG&R) process and are deemed fully eligible $747,746 $2,788,938 $$500,000 $1,000,000 $1,500,000 $2,000,000 $2,500,000 $3,000,000 $3,500,000 $4,000,000 Parker Farms Projected Improvement Costs $3,536,684 RECOMMENDED ALTERATIONS CAPITAL NEEDS/STRATEGIC PLANNING 61


Elementary Schools: Grade 3 – Grade 5 Pond Hill Elementary School Existing Pond Hill Elementary School (3 - 5) Additions: 2002 Existing Enrollment: 266 Students Construction: 1968 Space Division Quantity Square footage Subtotal Average Percentage GENERAL CLASSROOMS 14810-1051 11,821 84424% SPECIAL EDUCATION/PPS 13237-1051 6,680 51413% 4 542-816 2,804 701 6% MEDIA CENTER 1 2,189 218922% STARS PROGRAM 2 1,366 683 3% PHYSICAL EDUCATION 2,887 6% AUDITORIUM/STAGE 562 1% FOOD SERVICE 3,314 7% ADMINISTRATION 6 114-1029 5,498 91611% BUILDING INFRASTRUCTURE 2,909 6% CIRCULATION + STRUCTURE 10,053 20% TOTAL 50,083 33,250 DIFFERENCE 16,833 Max Classroom Capacity 322 Max Class Size Policy 23 Classroom Quantity 14 Total Max Programed Capacity 322 Current Utilization 83% CONNECTICUT STATE SPACE STANDARD SPECIFICATIONS FOR 266 GRADE 3 - GRADE 5 STUDENTS SPECIALS (ART, MUSIC, COMPUTERS, SPANISH) 24% 13% 5% 4%3%6%1% 7% 11% 6% 20% CORE LEARNING 55% SCHOOL SUPPORT 19% FACILITY SUPPORT 26% 62


Elementary Schools: Grade 3 – Grade 5 Pond Hill Elementary School MULTIPLEUSESINROOMS RESTROOOMS Pond Hill Elementary School Recommended Improvements and Alterations Restroom Renovations 450,000$ Split up rooms for special ed, group, news 110,000$ HVAC 2,051,500$ Construction Subtotal 2,611,500$ Soft Costs @ 25% 652,875$ TOTAL 3,264,375$ School Construction Reimbursement Rates 53.22% School Construction Reimbursement Rate @ 53.22% 1,737,300$ Reduced Reimbursement* 1,153,390$ ANTICIPATED TOWN SHARE 2,110,985$ * I f projects follow the Office of School Construction Grants & Review (OSCG&R) process and are deemed fully eligible $791,180 $3,264,375 $$1,000,000 $2,000,000 $3,000,000 $4,000,000 $5,000,000 Pond Hill Projected Improvement Costs $4,055,555 RECOMMENDED ALTERATIONS CAPITAL NEEDS/STRATEGIC PLANNING 63


Elementary Schools: Grade 3 – Grade 5 Rock Hill Elementary School Existing Rock Hill Elementary School (3 - 5) Addition: 2002 Existing Enrollment: 303 Students Construction: 1959 Space Division Quantity Square footage Subtotal Average Percentage GENERAL CLASSROOMS 16730-802 12,944 80924% SPECIAL EDUCATION/PPS 11101-802 4,143 377 8% 4 927-950 4,014 939 8% MEDIA CENTER 1 2,039 2039 4% PHYSICAL EDUCATION 1 3,259 3259 6% AUDITORIUM/STAGE 1 216 216 0% FOOD SERVICE 2 3,403 1702 6% ADMINISTRATION 8 286-621 2,152 269 4% BUILDING INFRASTRUCTURE 2,852 5% CIRCULATION + STRUCTURE 18,172 34% TOTAL 53,194 37,875 DIFFERENCE 15,319 Max Classroom Capacity 368 Max Class Size Policy 23 Classroom Quantity 16 Total Max Programed Capacity 368 Current Utilization 82% CONNECTICUT STATE SPACE STANDARD SPECIFICATIONS FOR 303 GRADE 3 - GRADE 5 STUDENTS SPECIALS (ART, MUSIC, COMPUTERS, SPANISH) 24% 8% 8% 4% 6%1%6% 4% 5% 34% CORE LEARNING 50% SCHOOL SUPPORT, 11% FACILITY SUPPORT 39% 64


Rock Hill Elementary School Recommended Improvements and Alterations Renovate Restooms 625,000$ Improve all purpose pod storage 150,000$ HVAC 2,450,150$ Construction Subtotal 3,225,150$ Soft Costs @ 25% 806,288$ TOTAL 4,031,438$ School Construction Reimbursement Rates 53.22% School Construction Reimbursement Rate @ 53.22% 2,145,531$ Reduced Reimbursement* 1,527,653$ ANTICIPATED TOWN SHARE 2,503,784$ * I f projects follow the Office of School Construction Grants & Review (OSCG&R) process and are deemed fully eligible Elementary Schools: Grade 3 – Grade 5 Rock Hill Elementary School INEFFICIENTSTORAGE RESTROOOMS LONGCORRIDORS /SPRAWLING $694,239 $4,031,438 $$1,000,000 $2,000,000 $3,000,000 $4,000,000 $5,000,000 Rock Hill Projected Improvement Costs $4,725,677 RECOMMENDED ALTERATIONS CAPITAL NEEDS/STRATEGIC PLANNING 65
Elementary Schools: Grade 3 – Grade 5 Elementary Schools Summary Existing 3-5 Schools Program Comparison Chart Space Division Fritz Parker Farms Pond Hill Rock Hill TOTAL 1925/19951955/20021968/20021959/2002 2952222533071,077 GENERAL CLASSROOMS 13,6438,99511,82112,94447,403 SPECIAL EDUCATION/PPS 3,3204,5806,6804,14318,723 4,8273,9212,8044,01415,566 MEDIA CENTER 3,9712,1842,1892,03910,383 WISE/CID Benhaven STARS SPECIALIZED PROGRAM 6,0811,5931,366 0 9,040 PHYSICAL EDUCATION 4,4373,1722,8873,25913,755 AUDITORIUM/STAGE 1,1687775622162,723 FOOD SERVICE 6,0972,5923,3143,40315,406 ADMINISTRATION 2,1183,6955,4982,15213,463 BUILDING INFRASTRUCTURE 3,7842,2092,9092,85211,754 CIRCULATION + STRUCTURE 19,37313,73510,05318,17261,333 TOTAL 68,81947,45350,08353,194219,549 36,25027,75031,62538,375134,000 32,56919,70318,45814,81985,549 MAX PROGRAMMED CAPACITY 3912993223681380 CURRENT UTILIZATION RATE 74%78%83%82%79% AVERAGE CONSTRUCTION/ADDITION YEAR CURRENT ENROLLEMENT STATE STANDARDS SPECIALS (ART, MUSIC, COMPUTERS, SPANISH) DIFFERENCE 3-5 Schools Cost Needs Comparison Chart Fritz Parker Farms Pond Hill Rock Hill TOTAL STRATEGIC & CAPITAL NEEDS 1,318,851$ 747,746$ 791,180$ 694,239$ 3,552,016$ 4,120,625$ 2,788,938$ 3,264,375$ 4,031,438$ 14,205,375$ TOTAL 5,439,476$ 3,536,684$ 4,055,555$ 4,725,677$ 17,757,391$ 2,192,997$ 1,484,273$ 1,737,300$ 2,145,531$ 7,560,101$ ANTICIPATED TOWN SHARE* 3,246,479$ 2,052,411$ 2,318,255$ 2,580,145$ 10,197,290$ PAST SCG INVESTMENT 7,800,000$ 6,496,053$ 6,269,565$ 6,966,790$ 27,532,408$ PER: https://www.csde.state.ct.us/public/scgms/reports.asp RECOMMENDED IMPROVEMENTS & ALTERATIONS Maximum Reimbursement* * If projects follow the Office of School Construction Grants & Review (OSCG&R) process and are deemed fully eligible 66
Middle Schools: Grade 6
Moran
• Dag •
67


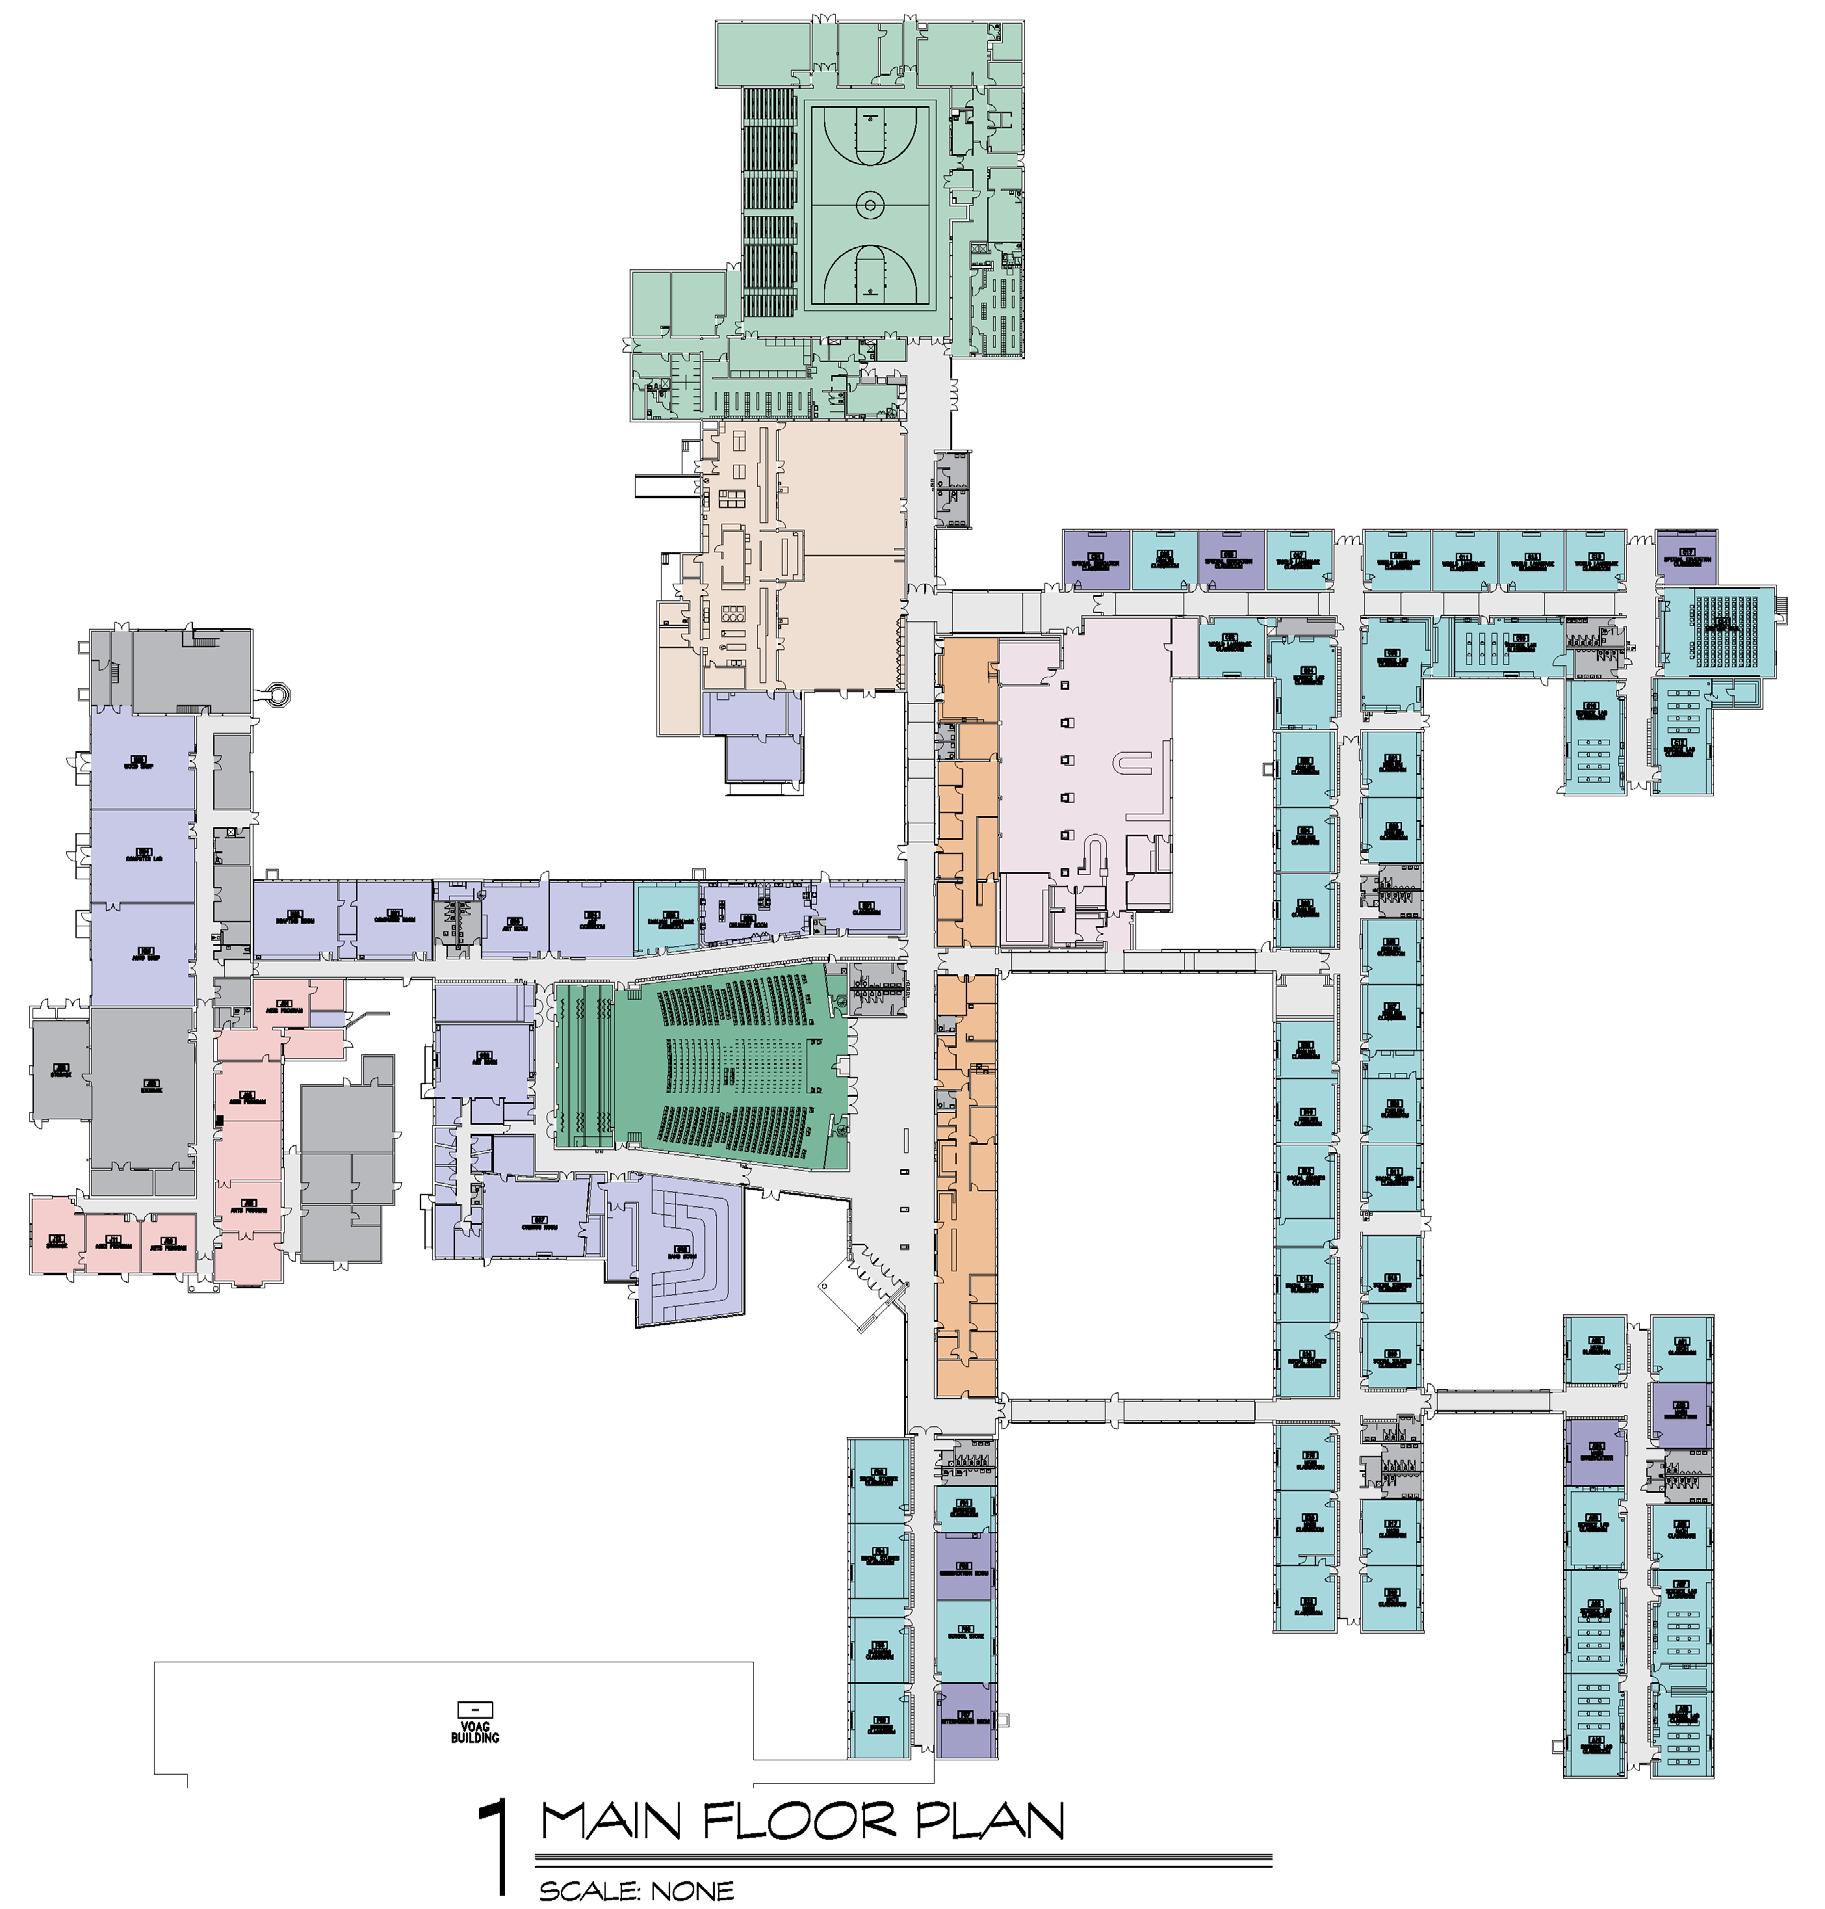
Middle Schools: Grade 6 – Grade 8 Dag Hammarskjold Middle School Existing Dag Hammarskjold Middle School (6 -8) Additions: 2002 Existing Enrollment: 593 Students Construction: 1962 Space Division Quantity Square footage Subtotal Average Percentage GENERAL CLASSROOMS 30608-1012 22,319 74419% SPECIAL EDUCATION/PPS 18366-613 9,175 510 8% SPECIALS (ART, MUSIC, TECH. FACS. COMP.) 9 555-1245 8,779 975 7% MEDIA CENTER 1 7,049 7049 6% INSPIRE/ARTS PROGRAM 1 2,576 2576 2% PHYSICAL EDUCATION 4 10,512 2628 9% AUDITORIUM/STAGE 1 9,639 9639 8% FOOD SERVICE 3 7,705 2568 6% ADMINISTRATION 1997-646 4,470 235 4% BUILDING INFRASTRUCTURE 8,712 7% CIRCULATION + STRUCTURE 28,966 24% TOTAL 119,902 84,898 DIFFERENCE 35,004 Max Classroom Capacity 690 Max Class Size Policy 23 Classroom Quantity 30 Total Max Programed Capacity 690 Current Utilization 86% CONNECTICUT STATE SPACE STANDARD SPECIFICATIONS FOR 593 GRADE 6-8 STUDENTS 19% 8% 7% 6% 2% 9%8% 6% 4% 7% 24% CORE LEARNING 50% SCHOOL SUPPORT 18% FACILITY SUPPORT 32% 68


Middle Schools: Grade 6 – Grade 8 Dag Hammarskjold Middle School Dag Hammarskjold Middle School Recommended Improvements and Alterations Renovate Science used for other programs 960,000$ HVAC 3,745,100$ Construction Subtotal 4,705,100$ Soft Costs @ 25% 1,176,275$ TOTAL 5,881,375$ School Construction Reimbursement Rate @ 53.22% 3,130,068$ Reduced Reimbursement* 2,216,278$ ANTICIPATED TOWN SHARE 3,665,097$ * I f projects follow the Office of School Construction Grants & Review (OSCG&R) process and are deemed fully eligible $826,735 $5,881,375 $$1,000,000 $2,000,000 $3,000,000 $4,000,000 $5,000,000 $6,000,000 $7,000,000 $8,000,000 Dag Projected Improvement Costs$6,708,110 CAPITAL NEEDS/STRATEGIC PLANNING RECOMMENDED ALTERATIONS 69


Middle Schools: Grade 6 – Grade 8 Moran Middle School Existing James Moran Middle School (6 -8) Additions: 2002 Existing Enrollment: 581 Students Construction: 1961 Space Division Quantity Square footage Subtotal Average Percentage GENERAL CLASSROOMS 32608-1012 24,819 77621% SPECIAL EDUCATION/PPS 20229-987 11,040 55210% SPECIALS (ART, MUSIC, TECH. FACS. COMP.) 9 460-1280 9,409 1045 8% MEDIA CENTER 1 7,049 7049 6% ABC PROGRAM 2 1,235 618 1% PHYSICAL EDUCATION 4 10,999 275010% AUDITORIUM/STAGE 1 5,187 5187 4% FOOD SERVICE 3 8,001 2667 7% ADMINISTRATION 1997-646 4,540 239 4% BUILDING INFRASTRUCTURE 8,034 7% CIRCULATION + STRUCTURE 25,187 22% TOTAL 115,500 138% 83,480 100% DIFFERENCE 32,020 Max Classroom Capacity 736 Max Class Size Policy 23 Classroom Quantity 32 Total Max Programed Capacity 736 Current Utilization 79% CONNECTICUT STATE SPACE STANDARD SPECIFICATIONS FOR 581 GRADE 6-8 STUDENTS 21% 10% 8% 6%1%10% 4% 7% 4% 7% 22% CORE LEARNING 56% SCHOOL SUPPORT 15% FACILITY SUPPORT 29% 70


Middle Schools: Grade 6 – Grade 8 Moran Middle School James Moran Middle School Recommended Improvements and Alterations Renovate Science used for other programs 1,200,000$ HVAC 3,525,000$ Construction Subtotal 4,725,000$ Soft Costs @ 25% 1,181,250$ TOTAL 5,906,250$ School Construction Reimbursement Rate @ 53.22% 3,143,306$ Reduced Reimbursement* 2,271,888$ ANTICIPATED TOWN SHARE 3,634,362$ * I f projects follow the Office of School Construction Grants & Review (OSCG&R) process and are deemed fully eligible $1,424,590 $5,906,250 $$1,000,000 $2,000,000 $3,000,000 $4,000,000 $5,000,000 $6,000,000 $7,000,000 $8,000,000 Moran Projected Improvement Costs$7,330,840 CAPITAL NEEDS/STRATEGIC PLANNING RECOMMENDED ALTERATIONS 71
Middle Schools: Grade 6 – Grade 8 Middle Schools Summary Existing 6-8 Schools Program Comparison Chart Space Division Dag Moran TOTAL 1962/2002 1961/2002 593 581 1,174 GENERAL CLASSROOMS 22,319 24,819 47,138 SPECIAL EDUCATION/PPS 9,175 11,040 20,215 8,779 9,409 18,188 MEDIA CENTER 7,049 7,049 14,098 SPECIALIZED PROGRAM 2,576 1,235 3,811 PHYSICAL EDUCATION 10,512 10,999 21,511 AUDITORIUM/STAGE 9,639 5,187 14,826 FOOD SERVICE 7,705 8,001 15,706 ADMINISTRATION 4,470 4,540 9,010 BUILDING INFRASTRUCTURE 8,712 8,034 16,746 CIRCULATION + STRUCTURE 28,966 25,187 54,153 TOTAL 119,902 115,500235,402 84,898 83,480 168,378 35,004 32,020 67,024 MAX PROGRAMMED CAPACITY 690 736 1426 CURRENT UTILIZATION RATE 86% 79% 82% AVERAGE CURRENT ENROLLEMENT SPECIALS (ART, MUSIC, TECH. FACS. COMP.) STATE STANDARDS DIFFERENCE CONSTRUCTION/ADDITION YEAR 6-8 Schools Cost Needs Comparison Chart Dag Moran TOTAL STRATEGIC & CAPITAL NEEDS 826,735$ 1,424,590$ 2,251,325$ 5,881,375$ 5,906,250$ 11,787,625$ TOTAL 6,708,110$ 7,330,840$ 14,038,950$ 2,216,278$ 2,271,888$ 4,488,166$ ANTICIPATED TOWN SHARE* 4,491,832$ 5,058,952$ 9,550,784$ PAST SCG INVESTMENT 7,895,531$ 7,406,179$ 15,301,710$ RECOMMENDED IMPROVEMENTS & ALTERATIONS Maximum Reimbursement* * If projects follow the Office of School Construction Grants & Review (OSCG&R) process and are deemed fully eligible 72