ISSN 2348-1218 (print)
International Journal of Interdisciplinary Research and Innovations ISSN 2348-1226 (online) Vol. 10, Issue 2, pp: (92-102), Month: April - June 2022, Available at: www.researchpublish.com

ISSN 2348-1218 (print)
International Journal of Interdisciplinary Research and Innovations ISSN 2348-1226 (online) Vol. 10, Issue 2, pp: (92-102), Month: April - June 2022, Available at: www.researchpublish.com
1,2 De La Salle University – Dasmariñas College of Tourism and Hospitality Management
1,2 City of Dasmariñas, Cavite, Philippines
DOI: https://doi.org/10.5281/zenodo.6675313
Published Date: 21-June-2022
Abstract: Numerous studies showed the relationship of academic performance and nutrition and wellness practices, but failed to indicate the correlation of academic satisfaction and nutrition. This paper aimed to determine the relationship between the two said variables. In addition, the researcher aimed to identify information concerning academic satisfaction and nutrition and wellness practices that may bring potential problems to students. This correlational research used Pearson correlation coefficient to determine the relationship of the variables. Sophomore and senior hospitality management college students completed an online self-completion survey (Google Forms) for data gathering. Most respondents were female with 49.11%, 80% of the college students were in the age of <20-year-old. The year level with the greatest number of respondents is seniors with 52.68%. The two factors have a correlation coefficient of 0.37, which results in weak positive correlations.
Keywords: Academic Satisfaction, Correlational Research, Nutrition, Wellness.
As said by the Department of Health of the Government of Western Australia, nutrition promotes a healthy pregnancy, growth, and aging process. It also aids in the maintenance of body weight, reduction of illnesses and improvement of well-being. Nutrition begins with conception and progresses through stages, going through birth, childhood, adolescence and so on.[1] This is in line with the editorial of Irmak (2020), where she stated that good nutrition reduces the risk of obesity, heart attack and other chronic diseases.[2]
In line with that, academic satisfaction is also an indicator of improvement in an individual. Antaramian (2017) stated that those who have high life satisfaction outscored those who have low and moderate life satisfaction, in terms of academic outcome.[3]
According to Abraham, Noriega & Ju (2018), college students tend to neglect the nutritional requirements needed for their body to function properly. As a result, they resort to eateries that provide unhealthy foods and drinks. In addition, Abraham et. al. also stated that if college students continue to care less about their nutrition intake, the academic and physical performance of the student may decrease. This would mean that students who fail to notice the predicament of their nutrition will be subjected to a decline of performance.[4]
To connect the previous studies, based on the conducted research of Dhaqane and Afrah (2016), there is a strong relationship between student satisfactions with their academic performance. To add, it was indicated that satisfaction promotes academic achievement and student retention.[5]
ISSN 2348-1218 (print)
International Journal of Interdisciplinary Research and Innovations ISSN 2348-1226 (online)
Vol. 10, Issue 2, pp: (92-102), Month: April - June 2022, Available at: www.researchpublish.com
Considering the studies and statements mentioned, it can be said that nutrition can help aid the performance of a student in academics. Academic satisfaction promotes academic achievement and those with high performance in academics will lead to high life satisfaction.
This research was conducted and inspired due to the observations and personal experience of the researcher during the prolonged home learning. The researcher observed that the online learning environment affected both the academics and nutrition of the students. With this, the researcher decided to take this as his research idea, and determine the relationship of the two variables.
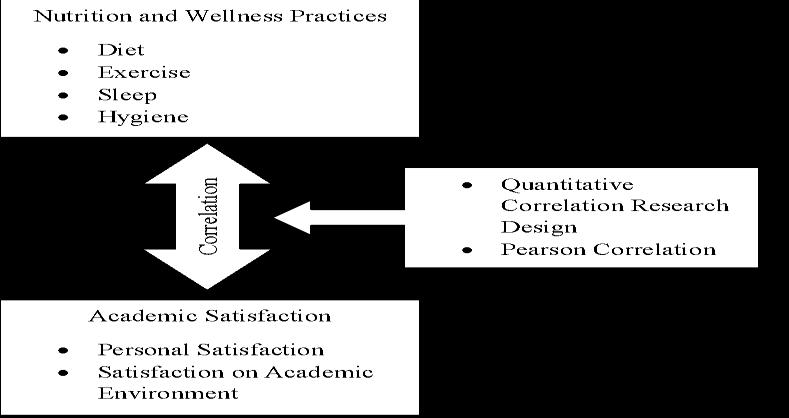
Fig. 1: Conceptual framework for correlational research.
The conceptual framework above shows the relationship between the two variables of the study. The nature of correlational research is to determine the extent of the relationship of two variables. Correlational research is used for determining if there is a relationship between two variables. However, a rule states that “correlation does not equal causation”. This means that though two variables may have a relationship, one does not cause the other to change.
The primary objective of this study is to determine if there is a relationship or correlation between the nutrition and wellness practices and academic satisfaction of hospitality management students. The extent of the relationship will also be answered and tackled within the research. Based on the requirements of this study, it is also essential to identify nutrition and wellness practices and degree of academic satisfaction of the students. The demographic profile will be gathered as well. These include age, gender, height, weight, and year level. The researcher hypothesizes that there is no relationship or correlation between the two variables mentioned.
Nutrition is a proven indicator of school performance. It was made clear in the analysis of Cristuta, Berongan, Radam, Saladaga, & Miranda (2019) that good nutrition and school attendance has favorable effects on the academic performance of learners. They also indicated that high malnutrition has a negative implication to the performance of learners within an institution, and those who lack sustainable nourishment fail to give their full participation in class activities.[6] It is common knowledge that food and nutrition is vital for body fuel, in order to perform tasks throughout the day.
Diet is not the only factor that affects the performance of students. Alfonsi, Scarpelli, D’Atri, Stella & De Gennaro (2020) said that lack of sleep leads to harmful effects (depressive symptoms, lack of physical activity, and increased body weight) that may be detrimental to the student’s academics.[7] This aligned with the findings of Dolezal, Neufeld, Boland, Martin, & Cooper (2017) in a study concerning the relationship of sleep and exercise. It was found that lack of sleep can lead to impairment of cognitive performance, which is essential in the learning process of students. Diet is also affected if an individual lacked the right amount of sleep. Appetite regulation, mood and immunity is affected negatively as well. This shows the interrelation of diet, sleep and performance. To add to that interrelation, exercise showed to have a positive effect on academic performance, and sedentary behavior engages individuals to risk their cognitive functions, which aligns to the study of Dolezal et. al. (Cid & Munoz, 2017) [8], [9]
The last factor of nutrition is hygiene, and Bagabaldo, Bonifacio, Layosa, Cayetano & Africa (2021) stated that there is no relationship between the academic grades to the students’ personal hygiene. However, personal and environmental hygiene may affect the factors included within the variable of nutrition and wellness practices.[10] Rohmah, Rini & Cholifah (2018) conducted a study on the relationship of hygiene and sanitation to the contamination of E. Coli. in school
ISSN 2348-1218 (print)
International Journal of Interdisciplinary Research and Innovations ISSN 2348-1226 (online) Vol. 10, Issue 2, pp: (92-102), Month: April - June 2022, Available at: www.researchpublish.com
campus cafeterias. The results show that there is a high relationship between the two in terms of the food handlers, ingredients, and facilities. This leads to the idea that, despite the zero correlation between hygiene and academic grades, other factors may be affected by hygiene that may cause an effect on the performance of an individual. [11]
As for academic performance, it has a high relationship with academic satisfaction. Dhaqane and Afrah utilized correlation in their research and found this result by asking 133 students questions circling around the roles and different factors of satisfaction and performance.[5] Unfortunately, few researches were available discussing academic satisfaction and performance, and none can be found about the connection of nutrition and academic satisfaction. There were more researches available involving life satisfaction. Caz & Tanyeri (2018) discussed and determined the relationship of life satisfaction and academic performance, but the results show that there is no relationship between them. [12]
Regardless of sources available, little to no sources tackled the relationship of nutrition and academic satisfaction. Furthermore, researches available focused on the dietary aspect of nutrition. The DNG Pyramid of the FNRI indicated that exercise, and personal and environmental hygiene is an important part of the pyramid.[13] An article by Sleep Foundation (2020) indicated the intertwining relationship of diet, exercise, and sleep. Diets fuel the body during exercise routines and affect the sleep duration and quality. Exercise decreases the appetite (especially high intensity workouts) and affects the sleep quality of an individual. Proper rest and sleep engage muscle recovery and stimulates appetite (sleep deprivation may lead to high calorie intake).[14]
This research utilized quantitative correlational research design. This design was used to determine the extent of a relationship between two variables.
This form of research design is usually used in fields of science, behavior, and psychology. Acosta, Alquizar, Junio & Buladaco (2020) utilized this design in determining the relationship of air temperature and the number of recoveries from COVID in the Philippines. They found no correlation, but it is noticeable that there are similarities in their methodology to the researcher’s design. They used scatterplots to determine the correlation in visual form. Pearson r was also used in the study. The difference, however, is that they utilized Spearman rho, a method to determine rank correlation. [15]
Behavior and psychology commonly use quantitative correlational research to find relationships between variables. Catacutan-Bangit, Fabito & Rodriguez (2019) found positive moderate correlation between entrance exam results and academic performance.[16] Indah Sari (2018) indicated in her research paper that there is positive correlation between vocabulary mastery and writing ability within eight grade students in Indonesia.[17] Hall (2018) stated in his study that transformational leadership behavior and job satisfaction has a significant relationship. All used to determine relationships, same as the study partook by the researcher.[18]
However, there were methods that contrasted the research’s methodology. Hall and Indah Sari failed to use scatterplots to visualize the correlation of the two variables. Acosta et. al. did not utilize a Likert scale to gather data. Finally, CatacutanBangit et. al. used data four to five years before their paper’s publication.[15], [16], [17], [18]
De La Salle University – Dasmarinas College of Tourism and Hospitality Management was the research locale, as the respondents, as well as the researcher, are currently within the department or college.
The respondents of the study were composed of one hundred (100) sophomore and senior college students (Academic Year 2021-2022) taking up a hospitality management degree course. The researcher chose this demographic to avoid biases from the researcher’s classmates from his year level.
Unrestricted random sampling was used for this research. The researcher asked the assistance of the Hospitality Management Department of De La Salle University – Dasmarinas in identifying the officially enrolled students to determine the sample size of respondents for the study.
ISSN 2348-1218 (print)
International Journal of Interdisciplinary Research and Innovations ISSN 2348-1226 (online) Vol. 10, Issue 2, pp: (92-102), Month: April - June 2022, Available at: www.researchpublish.com
Almeda, Capistrano & Sarte (2010) indicated the formula used for sampling with a known population.[19] �� = ��(���� 2 )2 (���� 2 )2 +4����2
With a Population (N) of 160 students from sophomore and senior years, a z-score of ±1.96 and a margin of error (e) of 5%, the total sample size for this study was 112.96 or 113 students.
The paradigm was in accord with the conceptual framework shown in Figure 1. The nature of this research is to determine the relationship of two variables and its extent. For it to be found, quantitative correlational research design was implemented, and Pearson correlation was utilized.
Due to the restrictions of COVID-19, the researcher used an online self-completion survey method as a tool to gather information from the respondents. According to Voxco (2020), respondents provide feedback in a self-completion survey tool even without the assistance from an interviewer or facilitator. [20]
The survey consists of three parts: the demographic profile, nutrition and wellness practices, and academic satisfaction. The survey’s design was based on the European Writing Survey (EUWRIT) – Students Survey (Chitez & Castello, 2015) [21]
For the demographic profile, age, gender, year level, height and weight of the respondents were asked.
The nutrition and wellness practices consist of four parts: diet, exercise, sleep, and hygiene, with thirteen, four, six and fifteen questions respectively. This section has a total of forty-one questions.
The section for academic satisfaction consists of two sections: personal satisfaction and satisfaction with the academic environment. The section has a total of eight questions, with each segment containing four questions each sector.
TABLE I: Six-Point Likert Scale
Likert Scale Interval Diff.
V.I. Code Verbal Interpretation 1 1.00-1.82 0.82 CDA Completely Disagree 2 1.83-2.65 0.82 DA Disagree 3 2.66-3.48 0.82 SDA Slightly Disagree 4 3.49-4.31 0.82 SA Slightly Agree 5 4.32-5.14 0.82 A Agree 6 5.15-6.00 0.85 CA Completely Agree
To get the numerical value for the data, the researcher used a 6-point Likert Scale. According to Pimentel (2019), it is a psychometric concept used to gather responses from the respondents of interests via a scale. The table above presents the difference, verbal, and numerical value of each point. [22]
The researcher formulated a survey questionnaire by using Google Forms. The survey contained a brief background of the study, demographic profile, and the survey questions. The survey question had two parts: the nutrition and wellness practices and academic satisfaction. The questions for the nutrition and wellness practices were based on the Daily Nutritional Guide (DNG) Pyramid formulated by the Food and Nutrition Research Institute (FNRI) of the Department of Science and Technology (DOST).
The DNG Pyramid indicates the number of servings per food group that would be optimal for healthy living. The pyramid also encourages participation in exercise and environmental hygiene, as both aspects are important in an individual’s nutrition. The pyramid has seven kinds, each catering to a certain group, namely: toddlers, kids, teens, adults, elderly, pregnant, and lactating.[23]
ISSN 2348-1218 (print)
International Journal of Interdisciplinary Research and Innovations ISSN 2348-1226 (online) Vol. 10, Issue 2, pp: (92-102), Month: April - June 2022, Available at: www.researchpublish.com
The content of the other would be based on the Academic Life Satisfaction Scale (ALSS) in the study of Nogueira, Antunes & Sequiera (2019). To define, Nogueira et. al. wrote “it measures the student's academic experiences on campus and the quality of their adjustment to the academic life and environment”. The section has two components: personal satisfaction and satisfaction with the academic environment. Personal satisfaction entails the internal aspects such as relationships between staff and colleagues, perception of academic performance, skills, and competencies. On the other hand, satisfaction with the academic environment tackles the physical teaching environment, activities, commitment to the course and learning conditions.[24]
The questions were transferred to Google Forms and dispersed to the respondents. The gathering procedure spanned from the last week of November 2021 to the first week of February 2022.
Pearson correlation coefficient was used as a statistical treatment for the data. Hall utilized this research design to determine the relationship between transformational research behavior and job satisfaction. In hindsight, this treatment is used to determine the strength and kind of correlation that two variables possess. The value of the coefficient lingers around the values -1 to 1. When the coefficient indicates a negative number, the correlation is negative, meaning that if one variable increases, the other decreases. If otherwise, and the coefficient is positive, it has positive correlation, which means if one variable increases, so does the other.
Pearson correlation uses continuous data, a contrast to Spearman correlation, which uses ordinal data. Though the Likert scale uses ordinal and ranking to gather responses, the researcher computed the mean of the responses in each section. Also, as indicated in Table 2, there is an almost equal interval, making the variables continuous. Continuous variables, as defined by Allen (2017), are metric and quantifiable, where each variable can have an infinite number or value between two given points, which is the interval.[25]
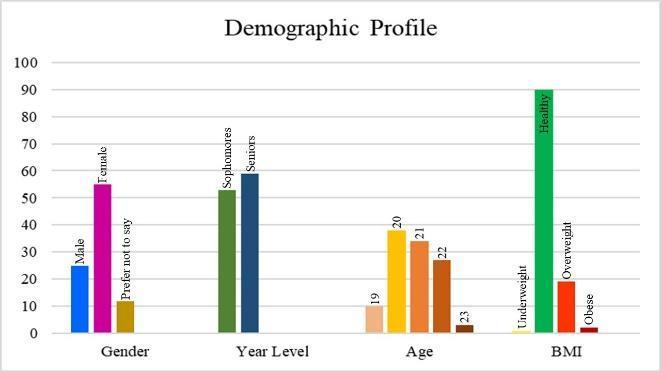
Firstly, the demographic profile of the hospitality management students was gathered and compiled.
Figure 3.1 shows the profile of sophomore and senior hospitality management students within De La Salle University –Dasmarinas. The figure indicates that 55 females (49.11%) participated in the study, while there were 45 males (40.18%) and 12 respondents (10.71%) with unspecified gender.
As for year level, seniors took over 59 slots (52.68%) of the overall respondents. The rest of the respondents were 53 (47.32%) sophomore students.
For age, 20-year-olds are the majority, with 38 respondents (33.93%) in total. 21-year-olds consist of 34 respondents (30.36%), while 22-year-olds have 27 (24.11%). The minority are 19- and 23-year-olds, which has 10 (8.93%) and 3 (2.68%) respondents respectively.
ISSN 2348-1218 (print)
International Journal of Interdisciplinary Research and Innovations ISSN 2348-1226 (online)
Vol. 10, Issue 2, pp: (92-102), Month: April - June 2022, Available at: www.researchpublish.com
Finally, the researcher garnered the height and weight of the respondents and calculated for their Body Mass Index Score (BMI). According to the Center for Disease Control and Prevention (CDCP, 2020), healthy or normal weight range spans from 18. 5 to 24.9. Anything less than 18.5 would be considered underweight. If the score exceeds the ideal weight range, particularly if an individual has a score reaching 25.0 to 29.9, they would be considered overweight. If the individual still exceeds the overweight range, they would be considered obese.[26] Ninety (90) respondents (80.36%) landed on the normal weight range. Overweight students consisted of 19 respondents (16.96%) from the sample. The least in numbers were the obese and underweight, with 2 (1.79%) and 1 respondent (0.89%) respectively.
The first segment of nutrition and wellness concerns dietary intake. These statements gained agreement, with some exceptions.
DIET Statement
Score Verbal Interpretation
1. Most of the beverages that I drink is water. 5.54 Completely Agree
2. I rarely drink soft drinks, sweetened beverages and the like. 4.40 Agree
3. I seldom drink alcoholic beverages. 4.56 Agree
4. Starch (bread, noodles, rice, root crops, etc.) is a major part of my meals. 5.70 Completely Agree
5. Egg (at least one) is regular in my daily diet. 3.78 Slightly Agree
6. I eat more fruits and vegetables than meat, fish, poultry, eggs, beans and nuts. 3.25 Slightly Disagree
7. I drink at least 1 glass of milk or milk products per day. 2.99 Slightly Disagree
8. My diet involves less fat, such as oil, margarine and butter. 4.21 Slightly Agree
9. I eat a variety of foods every day. 5.23 Completely Agree
10. I eat enough fruits and vegetables daily (2-3 servings of each). 3.61 Slightly Agree
11. I don’t eat for enjoyment but for fuel and energy. 4.29 Slightly Agree
12. I don’t eat sugary sweets regularly. 3.87 Slightly Agree
13. I seldom eat junk food. 3.79 Slightly Agree Mean Score 4.25 Slightly Agree
Table II shows the students’ responses on diet with mean scores and verbal interpretation. Based on the gathered responses, when diet is concerned, they responded in varying agreement with the majority of the statements. However, respondents reacted poorly to S6 and S7 which garnered a total mean score of 2.99 and 3.35 respectively. They slightly agreed at S5, S8, S10 – S13. Statements that gained a verbal interpretation of ‘agree’ include S2 – S3, which provided a score of 4.56 and 4.40 respectively. The statements with the highest scores and gained complete agreement revolve S1, S4 and S9. As a result, these gained scores amounting to 5.54, 5.70 and 5.23 respectively.
As seen from the results, there is a contradiction between statements 6 and 10. Respondents slightly disagreed that they consume more fruits and vegetables than protein, yet they slightly agreed that they eat sufficient fruits and vegetables daily.
Overall, the students perceived that they slightly participate in a diet beneficial for their health, having emphasis on starch and water consumption, as well as food variety. The mean score resulted in 4.25, which equates to a verbal interpretation of “slightly agree”. This is a great contrast in the study of Swetaa, Gayathri & Priya (2018), where they indicated that out of 110 students, 59.6% of college students engage in an unhealthy lifestyle.[27] In line with that, Choi (2020) indicated in their study that college students’ diets consisted mostly of meat rather than fruits, vegetables, and fish, which satisfies S6 on Table 3.1.[28] This same study indicated that the majority of the sample engaged in skipping breakfast for the entirety of the week, which is associated with unhealthy behavior.
Contrary to the previous section, the exercise segment of the survey contained favorable results, indicating that the respondents participate in regular exercise.
ISSN 2348-1218 (print)
International Journal of Interdisciplinary Research and Innovations ISSN 2348-1226 (online) Vol. 10, Issue 2, pp: (92-102), Month: April - June 2022, Available at: www.researchpublish.com
TABLE III: Student Responses on Exercise with Mean Scores and Verbal Interpretation.
Statement Score Verbal Interpretation
1. To me, exercise is a priority. 4.29 Slightly Agree
2. I do regular exercise for at least 30 minutes. 4.54 Agree
3. I don’t have any conditions that prevent me from doing physical exercise. 5.12 Agree
4. I would prefer to do physical activities than sedentary activities (watching television, playing video games, etc.). 3.79 Slightly Agree Mean Score 4.44 Agree
Respondents gave slight approval to S1 and S4. Prioritization of exercise and preference to physical activities gained a mean score of 4.29 and 3.79 respectively. They agreed S2 and S3 and gained 4.54 and 5.12 accordingly.
Based on the data from the two previous tables, the relationship of diet and exercise is in great difference to the study of Amatori, Donati Zeppa, Preti, Gervasi, Gobbi, Ferrini . . . Sisti (2020). There, they stated that high consumption of fruits, vegetables, and fish lead to higher rates of exercise.[29] Based on the diet segment of this study, it indicated that students slightly disagreed that they eat more fruits and vegetables, yet they were able to get a favorable mean score in terms of exercise. This created great contrast between the two results, which may be a result of difference in demographic. Exercise gained a favorable overall mean score amounting to 4.44, which translates to ‘agree’.
Sleep contained the most variety in terms of response. Half of the questions within the segment gained favorable results, while the other showed disagreement in terms of sleep practices.
Students indicated that the appropriate duration for sleep suffices their needs, and that they have well-constructed environments for their rest period.
TABLE IV: Student Responses on Sleep with Mean Scores and Verbal Interpretation.
Score Verbal Interpretation
1. I don’t take caffeinated drinks and alcohol before bed. 4.42 Agree
2. I have a regular sleeping schedule. 2.41 Disagree
3. 7-9 hours of sleep is sufficient for my daily activities. 4.83 Agree
4. I don’t stay up at night due to any reason. 2.33 Disagree
5. The environment I stay in optimizes my sleep. 4.85 Agree
6. Phones and gadgets are not a hindrance for my sleep schedule. 2.33 Disagree
Mean Score 3.53 Slightly Agree
Respondents disagreed with S2, S4 and S6. Respectively, they gained mean scores that value 2.41, 2.33 and 2.33. On the contrary they agreed to S1, S3 and S5, which garnered 4.42, 4.83 and 4.85 respectively. Sleep has the lowest overall score in all sections from both factors, having a mean of 3.53. Though this equates to slight approval, it doesn’t change the response of the sample, which consists of unhealthy sleeping practices.
As indicated above, technology and gadgets are a part of the sleep quality of the students. This notion fits well with the study by Dowdell & Clayton (2018). They explained that sleep texting influences poor sleep habits and it’s being a trend in college students. 25.6% of the sample mentioned that sleep texting and cell phones affect their sleep.[30]
The last part of nutrition and wellness, hygienic practices, which gained the most favorable responses out of all the segments within this study. The respondents clearly showed knowledge when it comes to sanitation and hygiene. This clarified that proper hygiene can be practiced despite the area of expertise. A study done by Qasem, Al-Rifaai & Al Haddad (2018) indicated that science and nursing students showed sufficient knowledge in hygiene, particularly in oral, hair, and bodily care.[31]
ISSN 2348-1218 (print)
International Journal of Interdisciplinary Research and Innovations ISSN 2348-1226 (online) Vol. 10, Issue 2, pp: (92-102), Month: April - June 2022, Available at: www.researchpublish.com
HYGIENE
Statement
Score Verbal Interpretation
1. I never smoke. 4.27 Slightly Agree
2. I wash my hands before and after contact 9e.g. before eating, after going to the toilet, etc.). 5.54 Completely Agree
3. I bathe with soap, shampoo and water daily. 5.87 Completely Agree
4. I use deodorant regularly. 5.54 Completely Agree
5. I brush my teeth morning noon and night. 5.46 Completely Agree
6. I use additional oral products, such as mouthwash, mouth spray, and dental floss. 4.82 Agree
7. I clip my nails on a regular basis. 5.15 Completely Agree
8. I change my clothes daily. 5.45 Completely Agree
9. I clean spaces where diseases 9e.g. dengue, leptospirosis, food poisoning, etc.) may arise. 5.26 Completely Agree
10.I strive to keep my surroundings free from germs and bacteria. 5.39 Completely Agree
11.The house where I am staying in is well kept. 5.35 Completely Agree
12.Food sanitations is a common practice in our/my household. 5.71 Completely Agree
13.I ensure that the water I am using, whether for drinking or hygiene, is clean. 5.63 Completely Agree
14.I dispose waste where it is proper and risk free. 5.64 Completely Agree
15.Pests are rare in my house. 5.03 Agree
Mean Score 5.34 Completely Agree
The respondents’ lowest score would be found in S1, with a score carrying a value of 4.27. They agreed to S6 and S15 with scores amounting to 4.82 and 5.03 respectively. S2-S5 and S7-S14 gained complete agreement. The range of the scores between the remaining twelve statements would be 5.15 – 5.87, thus, the overall average amounted to 5.34 which has a verbal interpretation of ‘completely agree’.
The final section of the survey pertains to the satisfaction of the students within their institution. This section has two segments namely, personal, and environmental satisfaction. Between the two, personal satisfaction gained the lowest score, with a small gap between the overall mean of environmental satisfaction. However, personal satisfaction showed greater alignment in agreement based on verbal interpretation.
TABLE VI: Student Responses on Personal Satisfaction with Mean Scores and Verbal Interpretation.
1. I am satisfied with the relationships I have with the teachers.
2. I am satisfied with my academic performance.
3.71 Slightly Agree
3.65 Slightly Agree
3. I am satisfied with my commitment to my course 3.77 Slightly Agree
4. I am satisfied with the relationship I have with my colleagues on campus. 4.59 Agree
Mean Score 3.93 Slightly Agree
For personal satisfaction, they slightly agreed to S1-S3 and gained a score of 3.71, 3.65 and 3.77 respectively. The highest score landed on the final statement, S4 which gained a score of 4.59, making the overall mean amounting to 3.93.
Environmental satisfaction gained a higher overall score, but one particular statement resulted in an unfavorable verbal interpretation.
ISSN 2348-1218 (print)
International Journal of Interdisciplinary Research and Innovations ISSN 2348-1226 (online) Vol. 10, Issue 2, pp: (92-102), Month: April - June 2022, Available at: www.researchpublish.com
TABLE VII: Student Responses on Satisfaction in Academic Environment with Mean Scores and Verbal Interpretation.
Statement
Score Verbal Interpretation
1. I am satisfied with the conditions for studying at campus. 4.12 Slightly Agree
2. I am satisfied with the institution of higher education that I attend. 4.30 Slightly Agree
3. I am satisfied with the extracurricular activities of the institution that I attend. 3.10 Slightly Disagree
4. I am satisfied with the course that I attended. 4.79 Agree Mean Score 4.08 Slightly Agree
Environmental contained a slight disagreement while the rest gained agreement. That disagreement came in S3, which gained a score of 3.10. However, they slightly agreed to S1 and S2. These statements gained a score of 4.12 and 4.30, respectively. They showed agreement in S4 which attributed a score of 4.79, making an overall mean score of 4.08.
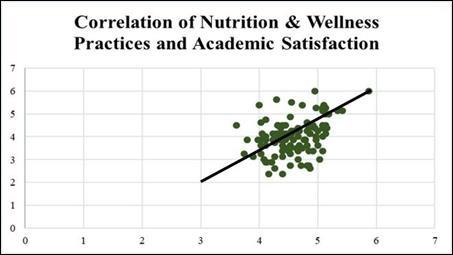
The researcher calculated the correlation coefficient for the two variables using Microsoft Excel according to the computation of the factors of a correlation coefficient of 0.370052934 or 0.37. Schober, Boer & Schwarte (2018) stated that this score equates to a weak correlation between the two factors.
This is a contrast to the study of Beredo (2019), which used weight and academic performance variables. Negligible negative correlation was detected between the variables by using Pearson correlation. This same study also tackled the correlation of each component’s average rather than the overall average.[32]
Based on the data gathered, it was confirmed that there is a weak positive correlation between the nutrition and wellness practices, and academic performance of hospitality management students in De La Salle University – Dasmarinas. Among the components of each section, hygiene showed the most satisfactory practices. On the contrary, students manifested in their response that sleep is their most lacking component, with lack of milk and produce in diet and dissatisfaction of extracurricular activities coming in next.
That being mentioned, this does not mean that nutrition and wellness practices are the cause of said academic satisfaction. Regardless of that notion, results clearly insinuate that sleep amongst hospitality students needs attention to avoid unhealthy. As for academic satisfaction, there is a call for improvement in terms of extracurricular activities in online learning during this pandemic.
Based on the results, it is recommended that the institutions should improve the content and quality of their extracurricular activities. The school should also go the extra measure to ensure that the students engage in a healthy lifestyle in terms of sleep and diet. Students should also be aware that their practices in diet and sleep can be improved through scheduling sleep and portioning the right amounts of food in their diet.
ISSN 2348-1218 (print)
International Journal of Interdisciplinary Research and Innovations ISSN 2348-1226 (online) Vol. 10, Issue 2, pp: (92-102), Month: April - June 2022, Available at: www.researchpublish.com
In terms of sample, the researcher suggests using convenience sampling instead of random sampling, since the data gathering period broadened because of the filters within the study.
Outside factors that affect nutrition can be included to add nuance to the reasoning of the participants’ response. The use of qualitative research such as interviews can be utilized for determining the effect of nutrition and wellness to academics. In addition, it is recommended to add additional notions to the previously noted statements, since it will clarify more information and give results with added depth.
Other researchers may also change the variables. In the field of culinary, one may use correlation in terms of home cooking. The researcher may use cooking methods and customer satisfaction, or the former with an allotted budget for food.
[1] Why is nutrition important? (n.d.). https://ww2.health.wa.gov.au/Articles/U_Z/Why-is-nutrition-important
[2] Irmak, S. (2020). The Importance of Nutrition for Health and Society. Journal of Food Nutrition and Health. https://www.alliedacademies.org/articles/the-importance-of-nutrition-for-health-and-society.pdf
[3] Antaramian, S. (2017). The importance of very high life satisfaction for students’ academic success. Cogent Education, 4(1). doi:10.1080/2331186x.2017.1307622
[4] Abraham, S., Noriega, B. R., & Ju, Y. (2018). College students' eating habits and knowledge of nutritional requirements. Journal of Nutrition and Human Health, 2(1), 13-17. doi:https://doi.org/10.35841/nutrition-humanhealth.2.1.13-17
[5] Dhaqane, M., & Afrah, N. (2016). Satisfaction of Students and Academic Performance in Benadir University. Journal of Education and Practice, 7(24), 59-63. https://files.eric.ed.gov/fulltext/EJ1112855.pdf
[6] Cristuta, M. A., Berongan, J. E., Radam, M. D., Saladaga, M. S., & Miranda, M. (2019). Nutrition and Academic Achievement of Filipino Learners: A Literature Review. International Journal of Trend in Scientific Research and Development, 4(1), 868-871.
[7] Alfonsi, V., Scarpelli, S., D’Atri, A., Stella, G., & De Gennaro, L. (2020). Later school start time: The impact of sleep on academic performance and health in the adolescent population. International Journal of Environmental Research and Public Health, 17(7). doi:10.3390/ijerph17072574
[8] Dolezal, B. A., Neufeld, E. V., Boland, D. M., Martin, J. L., & Cooper, C. B. (2017). Interrelationship between sleep and exercise: A systematic review. Advances in Preventive Medicine, 2017, 1-14. doi:10.1155/2017/1364387
[9] Cid, F., & Munoz, H. D. (2017). Physical Exercise and Academic Performance. MOJ Sports Medicine, 1(4). http://dx.doi.org/10.15406/mojsm.2017.01.00021
[10] Bagabaldo, P., Bonifacio, M., Layosa, M., Cayetano, A., & Africa, L. (2020). Relationship of Personal Hygiene Score with Sex, Nutritional Status, Morbidity, and Academic Grades Among Primary Grade School Children in a Public Elementary School in Pila, Laguna [Abstract]. Journal of Human Ecologuy, 9(1). https://ovcre.uplb.edu.ph/ journals-uplb/index.php/JHE/article/view/524
[11] Rohmah, J., Rini, C. S., & Cholifah, S. (2018). The relationship between hygiene and sanitation to escherichia coli contamination on foods in a campus cafeteria. IOP Conference Series: Materials Science and Engineering, 420. doi:10.1088/1757-899x/420/1/012143
[12] Caz, Ç, & Tanyeri, L. (2018). The relationship between life satisfaction and academic performance: An example of sports science. World Journal of Education, 8(5), 192-197. doi:10.5430/wje.v8n5p192
[13] Daily Nutritional Guide Pyramid. (n.d.). https://www.fnri.dost.gov.ph/index.php/tools-and-standard/nutritionalguide-pyramid
[14] Newsom, R. (2020). Diet and Exercise and Sleep. https://www.sleepfoundation.org/physical-health/diet-exercisesleep
[15] Cherry, K. (2020, July 13). How Correlational Studies Are Used in Psychology. Retrieved May 2, 2021, from https://www.verywellmind.com/correlational-research-2795774
[16] Schober, P., Boer, C., & Schwarte, L. A. (2018). Correlation coefficients: Appropriate Use and Interpretation. Anesthesia & Analgesia, 126(5), 1763-1768. doi:10.1213/ane.0000000000002864
ISSN 2348-1218 (print) International Journal of Interdisciplinary Research and Innovations ISSN 2348-1226 (online) Vol. 10, Issue 2, pp: (92-102), Month: April - June 2022, Available at: www.researchpublish.com
[17] Acosta, D., Alquizar, M. L., Junio, C. A., & Buladaco, M. V. (2020). Correlational Analysis of Hot Weather and Number of Recovery of the Pandemic Coronavirus in The Philippines. SSRN Electronic Journal. doi:10.2139/ ssrn.3597254
[18] Catacutan-Bangit, A. E., Fabito, B. S., & Rodriguez, R. L. (2018). Correlation between Student Entrance Exam Results and Academic Performance: Case of a College in a Philippine University. https://www.national-u.edu.ph/ wp-content/uploads/2019/08/6-JSTAR5-Fabito.edited.edited1.pdf
[19] Indah Sari, L. (2017). The Correlation between the Vocabulary Mastery and Writing Ability among the Eighth grade Students of Junior High School 2 Tumijajar in the Academic Year of 2017/ 2018. https://repository.metrouniv. ac.id/id/eprint/2793/1/LILIS%20NUR%20INDAH%20SARI%201292447.pdf
[20] Hall, L. H. (n.d.). A Quantitative Correlational Study between Transformational Leadership Behavior and Job Satisfaction among California Card Room Casino Employees. https://digitalcommons.brandman.edu/cgi/ viewcontent.cgi?article=1195&context=edd_dissertations
[21] Almeda, J., Capistrano, T., & Sarte, G. (2010). Elementary Statistics. University of the Philippines Press.
[22] Which Survey Mode Is Best: Face-To-Face or Self-Completion Surveys? (2020). https://www.voxco.com/blog/faceto-face-or-self-completion-surveys/
[23] Chitez, M., & Castello, M. (2015). Appendix 1: The European Writing Survey (EUWRIT) – Student Survey. In 1421095803 1034067327 O. Kruse (Ed.), The European Writing Survey (EUWRIT): Background, Structure, Implementation, and Some Results (pp. 36-40). ZHAW School of Applied Linguistics. https://core.ac.uk/download/ pdf/55329607.pdf
[24] Pimintel, J. L. (2019). Some Biases in Likert Scaling Usage and its Correction. International Journal of Sciences: Basic and Applied Research, 45(1), 183-191. https://www.researchgate.net/profile/Jonald-Pimentel/publication/3325 33000_Some_Biases_in_Likert_Scaling_Usage_and_its_Correction/links/5cbb357b299bf1209774718e/SomeBiases-in-Likert-Scaling-Usage-and-its-Correction.pdf
[25] Pinggang Pinoy: Healthy Food Plate for Filipino Adults. (n.d.). https://doh.gov.ph/node/223
[26] Nogueira, M. J., Antunes, J. P., & Sequiera, C. (2019). Development and Psychometric Study of the Academic Life Satisfaction Scale (ALSS) in a Higher Education Students Sample. Nursing & Healthcare International Journal, 3(2). doi:10.23880/nhij-16000183
[27] Allen, M. (Ed.). (2017). Continuous Variables. In The SAGE Encyclopedia of Communication Research Methods (Vol. 1-4). Thousand Oaks, California: SAGE Publications. https://methods.sagepub.com/reference/the-sageencyclopedia-of-communication-research-methods/i15322.xml.
[28] Assessing Your Weight. (2020). https://www.cdc.gov/healthyweight/assessing/index.html
[29] Swetaa, A., Gayathri, R., & Priya, V. (2018). Awareness on balanced diet and eating practices among college students - A survey. Drug Invention Today, 10(8), 1408-1210. https://web.p.ebscohost.com/abstract?direct=true& profile=ehost&scope=site&authtype=crawler&jrnl=09757619&AN=130903201&h=wUzf4LrvYCx4R2oW4E78Sp5 7ZlepInniZvcteoLb3wqe6cVm%2bfkdjHaNL%2bRKjI5Si4Gn%2f%2bSkedi32w%2fgX9AsmA%3d%3d&crl=c&re sultNs=AdminWebAuth&resultLocal=ErrCrlNotAuth&crlhashurl=login.aspx%3fdirect%3dtrue%26profile%3dehos t%26scope%3dsite%26authtype%3dcrawler%26jrnl%3d09757619%26AN%3d130903201
[30] Choi, J. (2020). Impact of stress levels on eating behaviors among college students. Nutrients, 12(5), 1241. doi: 10.3390/nu12051241
[31] Amatori, S., Donati Zeppa, S., Preti, A., Gervasi, M., Gobbi, E., Ferrini, F., . . . Sisti, D. (2020). Dietary habits and psychological states during COVID-19 home isolation in Italian college students: The role of physical exercise. Nutrients, 12(12), 3660. doi:10.3390/nu12123660
[32] Dowdell, E. B., & Clayton, B. Q. (2018). Interrupted sleep: College students sleeping with technology. Journal of American College Health, 67(7), 640-646. doi:10.1080/07448481.2018.1499655
[33] Qasem, J., Al-Rifaai, J., & Al Haddad, A. (2018). Personal hygiene among college students in Kuwait: A Health Promotion Perspective. Journal of Education and Health Promotion, 7(1), 92. doi:10.4103/jehp.jehp_158_17
[34] Beredo, A. (2019). Nutritional status and its impact on academic performance of selected grade 8 students. Journal of Physics: Conference Series, 1254(1). doi:10.1088/1742-6596/1254/1/012013