ISSN 2348-1218 (print)
International Journal of Interdisciplinary Research and Innovations ISSN 2348-1226 (online) Vol. 8, Issue 2, pp: (31-49), Month: April - June 2020, Available at: www.researchpublish.com

ISSN 2348-1218 (print)
International Journal of Interdisciplinary Research and Innovations ISSN 2348-1226 (online) Vol. 8, Issue 2, pp: (31-49), Month: April - June 2020, Available at: www.researchpublish.com
DBA, Ph.D., M B A., M.Sc., B.Sc.
American InterContinental University
School of Business
Email: dbull2@aiuniv.edu
Abstract: The association between demographic characteristics and Job Satisfaction Scores (JSS) was examined among 240 hospital staff. The population sample consisted of men and women, between the ages of 18 to 60 randomly selected from four different hospitals within the Southern region of the United States. The study was a descriptive correlational study guided by a positivist paradigm. Data was collected using the Spector (1997) Job Satisfaction Scale and a demographic survey designed by the researcher. Data analysis was enabled by SPSS 25 to identify any association Total Job Satisfaction and demographic characteristics among hospital staff. Differences among staff in relation to job satisfaction facets based on demographic characteristics was also examined. Results of the Spearman Rank-Order Correlation revealed a significant negative correlation between age and Total Job satisfaction (TS); and generational categories and (TS) [1 – tailed]. However, a similar [2 – tailed] test failed to reveal any significant relationship among the variables. A post-hoc Kruskal-Wallis (KW) test of independent samples failed to reveal a significant difference between demographic characteristics and (TS), and individual JSS facets. Further investigation into clinical and nonclinical staff yielded similar results.
Keywords: Staff, Job Satisfaction, Demographic Characteristics, Clinical, Nonclinical, Generational Categories.
Job satisfaction is a critical factor in employee retention in human capital management In fact, many people would hardly leave their jobs to seek other opportunities if they are satisfied with their current jobs. The question then is, what is job satisfaction? Different experts have come up with definitions, all of which revolve around the same concept. Spector (1997) considered job satisfaction to be the degree to which people like or feel about their jobs. When employees like their jobs – they are satisfied with certain or all aspects of the job, but when they dislike their jobs – they are dissatisfied with certain aspects of their jobs. Job satisfaction or dissatisfaction is a common phenomenon among the workforce today and has emerged as a very significant variable in employee turnover, absenteeism, tardiness, and stress. For many employees, work is the central part of their lifestyle, so liking their jobs is critical for them. On contrast, employees may hate their jobs and would only work because they must in order to survive. The study of employee attitude towards work is very important in organizational behavior, more especially in the healthcare industry where employees deal with human lives.
Many researchers have reported that a satisfied employee often performs better, stays longer on the job, refrains from absenteeism, and exhibits a better coworker relationship compared to a dissatisfied employee (Tawana, Barkhuizen, & du Plessis, 2019; Singh, 2017; Tinu, & Adeniji, 2015). In fact, communication and teamwork are more effective among satisfied workers resulting in higher productivity and efficiency. Mundt and Zakletskaia (2019) concluded that in order to
ISSN 2348-1218 (print)
International Journal of Interdisciplinary Research and Innovations ISSN 2348-1226 (online) Vol. 8, Issue 2, pp: (31-49), Month: April - June 2020, Available at: www.researchpublish.com
increase clinician job satisfaction, healthcare providers should encourage highly interconnected face-to-face communication among all team members. Communication, they said, helps employees to glean the strengths of interdisciplinary care and motivation associated with job satisfaction In the past, many experts had examined job satisfaction from the perspective of needs fulfillment, including the inherent capacity of the job to meet the employee’s psychological and physical needs. Recently, the study of job satisfaction has gone deeper into other aspects like cognitive processes not only the individual needs of the employee. Therefore, studies involving employee job satisfaction now examine the global perspective of the employee regarding their likes and dislikes of a specific job. This global perspective comprises different facets of job satisfaction such as pay, promotion, coworker, supervision, fringe benefits, communication, operational procedures, nature of work, and contingent rewards. Each of these facets is of different levels of importance to the employee which further differentiates the feeling of satisfaction or dissatisfaction of employees The goal of this study is to investigate the association between job satisfaction and demographic characteristics. Any study investigating employee job satisfaction, especially on the bases of demographic characteristics, is significant for the healthcare setting. Such studies have the potential to create a social change within the workforce for human capital managers.
Although numerous literatures exist about job satisfaction, it has not been clearly established as to what association exists between demographic variables and employee job satisfaction Many questions remain unanswered about the nature of job satisfaction and its association among specific demographic variables of gender, age, educational level, experience, and ethnicity.
The following research questions guided the study:
Research Question 1
What is the relationship between demographic characteristics and Total Job Satisfaction (T) among hospital staff located in the Southern region of the United States?
H1a: There is a significant relationship between Total Job Satisfaction and demographic characteristics of age, gender, experience, ethnicity, and educational level among hospital staff within the southern region of the United States.
H1o: There is no significant relationship between Total Job Satisfaction and demographic characteristics of age, gender, experience, ethnicity, and educational level among hospital staff within the southern region of the United States.
However, the total job satisfaction by itself may not reveal much about the individual difference among staff. In order to provide more insight into the investigation, I decided to further examine the differences among staff based on demographic characters of gender, age, education, experience, ethnicity, and generational categories in relation to the individual facets of job satisfaction including pay, promotion, supervision, operating conditions, coworker, nature of work, fringe benefits, contingent rewards, and communication.
Research Question 2
How do hospital staff Job Satisfaction facets differ based on gender?
Hypothesis 2
H2a: There are differences in facets of Job Satisfaction among hospital staff based on gender.
H2o: There are no differences in facets of Job Satisfaction among hospital staff based on gender.
Research Question 3
How do hospital staff Job Satisfaction facets differ based on age?
Hypothesis 3
H3a: There are differences in facets of Job Satisfaction among hospital staff based on age.
H3o: There are no differences in facets of Job Satisfaction among hospital staff based on age.
ISSN 2348-1218 (print)
International Journal of Interdisciplinary Research and Innovations ISSN 2348-1226 (online) Vol. 8, Issue 2, pp: (31-49), Month: April - June 2020, Available at: www.researchpublish.com
Research Question 4
How do hospital staff Job Satisfaction facets differ based on educational level?
Hypothesis 4
H4a: There are differences in facets of Job Satisfaction among hospital staff based on educational level.
H4o: There are no differences in facets of Job Satisfaction among hospital staff based on educational level.
Research Question 5
How do hospital staff Job Satisfaction facets differ based on experience?
Hypothesis 5
H5a: There are differences in facets of Job Satisfaction among hospital staff based on experience.
H5o: There are no differences in facets of Job Satisfaction among hospital staff based on experience.
Research Question 6
How do hospital staff Job Satisfaction facets differ based on ethnicity?
Hypothesis 6
H2a: There are differences in facets of Job Satisfaction among hospital staff based on ethnicity.
H2o: There are no differences in facets of Job Satisfaction among hospital staff based on ethnicity
Research Question 7
How do hospital staff Job Satisfaction facets differ based on generational categories?
Hypothesis 7
H7a: There are differences in facets of Job Satisfaction among hospital staff based on generational categories.
H7o: There are no differences in facets of Job Satisfaction among hospital staff based on generational categories.
Job satisfaction is a very broad subject, especially within the healthcare field. It means different things to different people. To examine the association between demographic characteristics and job satisfaction, this study used Vroom’s expectancy theory, because the theory explains worker motivation in factors related to worker satisfaction in relation to job expectations (Parks & Kim, 2017).
According to the Vroom’s Expectancy Theory, an employee exerts more effort when the reward has more personal value to that employee. Personal value gives the employee satisfaction. When that effort does not yield any personal value, that employee becomes dissatisfied with the job. The dissatisfaction is in part, as a result of unfulfilled expectations. Different people value different aspects of their jobs. While some are motivated by pay, others may be motivated by promotion, nature of work, coworker influence, supervisory style, and so on. These different facets of job satisfaction bring personal value to different employees.
It is well established in the literature that job satisfaction is a multi-faceted construct with employees having different feelings toward various aspects of their job (e.g. Kolo 2018; Bagus, Setiawan, & Prayoga, 2018). Total job satisfaction of itself does not explain much about an employee’s job satisfaction. In order to accurately reflect an employee’s job satisfaction, several job facets need to be evaluated as these may not be of equal importance to each employee (Tawana, Barkhuizen, & du Plessis, 2019). Thus, taking a multi-dimensional approach or considering each job satisfaction facet provides a more detailed and complete understanding of an employee’s satisfaction with their work (Yalabik, Rayton, & Rapti, 2017). Proponents of the expectancy theory argue that satisfaction with various facets translates into the employee’s perception of their total job and work engagement.
ISSN 2348-1218 (print)
International Journal of Interdisciplinary Research and Innovations ISSN 2348-1226 (online) Vol. 8, Issue 2, pp: (31-49), Month: April - June 2020, Available at: www.researchpublish.com
Spector’s (1997) job satisfaction scale considered job satisfaction facets including, pay, promotion, supervision, fringe benefits, contingent rewards, operating procedures, coworkers, nature of work, and communication as contributors to an employee’s total job satisfaction. An employee’s job satisfaction, therefore, is a measurement of job and work expectations not just a total manifestation of the employee’s attitude. A number of studies have explored demographic factors in relation to employee job satisfaction (Chirchir, 2016; Abdul-Nasiru & Mendah, 2016; Ghafoor, 2012), and have yielded mixed results. While some studies revealed significant positive relationships between the variables (Choudhary & Abbassi, 2015; Chirchir, 2016; Kolo, 2018), others have reported significant negative relationships and others revealed no relation at all (Brinkmann, 2017; Judge, Piccolo, & Podsakoff, 2010)
At the same time, some studies (Singh, 2017; Park & Kim, 2017; Kolo, 2018) have investigated the relationship between individual facets of job satisfaction and demographic characteristics in order to get a full insight into the subject. Choudhary and Abbassi (2015) revealed job satisfaction was significantly affected by demographic, financial and nonfinancial factors. The authors reported that employees older than 50 years with greater experience, and in higher managerial positions were satisfied with pay, promotion, work stress, work condition, and work environment. However, in the same study, the authors reported that the median group differences existed between responses based on age, work experience, and salary. Total job satisfaction was also significantly positively related to all job satisfaction facets. Considering pay (salary), a contractual agreement between an employer and the employee, it is fair to say that if an employee is paid a fair wage for work done, that employee may be happy with the job regardless of the demographic characteristics of that employee. While many employees express the value of pay, Brinkmann (2017) reported that higher pay may result in pay satisfaction and not job satisfaction. Similarly, Judge, Piccolo, and Podsakoff (2010) reported that between studies, there was little relationship between average pay and the average level of pay satisfaction regardless of the age, gender, experience, and educational level of the participants.
Riza, Ganzach, and Liu (2016) reported that job satisfaction tends to increase as employees get older and decrease as they stay longer on a particular job. In other words, the authors affirmed that age and tenure had opposite relationships with job satisfaction. Hunt and Saul (2017) reported that a survey of white-collar workers revealed that age and tenure had positive, linear relationships to total job satisfaction. In fact, the authors showed that age had a stronger relationship with satisfaction in males than tenure, and the reverse was true for females. However, when six or more facets of satisfaction were examined, the relationships with age and tenure became more complex Bakotić and Babić (2014) found no statistically significant difference in overall job satisfaction between workers who worked at the facility and those who in the administration. However, they found out that workers who work in normal working conditions are more satisfied with working conditions than workers who work under difficult working conditions For those who worked under difficult working conditions, the working conditions are important factor of their overall job satisfaction.
Also, Carvajal and Popovici (2019) suggested female pharmacists report higher levels of total job satisfaction, and also greater satisfaction with multiple facets, and with the profession itself. Women also report greater workload and stress than their male counterparts.
In another study, Agbure (2017) reported that trained teachers were not totally satisfied with their jobs but did find satisfaction with some aspects of their job including supervision, coworker relationships, and fringe benefits. However, the researcher did not find any relationship between the teacher’s job satisfaction and demographic characters of age, level of education, and years of teaching experience. Education Letter (2019) reported that a study from the University of Washington involving data from 1993 to 2008 found that schools nationwide were recruiting academically skilled college graduates into teaching in urban school districts. However, the study shows that nonwhite teachers showed lower job satisfaction than other teachers. Tarcan, G. Y., and Tarcan, M. (2017) reported that burnout and job satisfaction are affected by demographic characteristics of marital status, level of education and occupation. However, job satisfaction was not significantly affected by gender and gender did not affect employee perception of personal accomplishment. Likewise, Vorina, Simonič, and Vlasova (2017) found no statistically significant difference between job satisfaction and gender
ISSN 2348-1218 (print)
International Journal of Interdisciplinary Research and Innovations ISSN 2348-1226 (online) Vol. 8, Issue 2, pp: (31-49), Month: April - June 2020, Available at: www.researchpublish.com
González, Sánchez, and López-Guzmán, (2016) reported that employees with a lower educational level are more affected by lack of job and are likely to be grateful when they get one, although some of these jobs may not translate to job satisfaction. However, Rahman, Akhter, and Khan (2017) reported that workers with significantly higher educational levels are more satisfied than their less educated counterparts. The authors explained that individuals with higher educational qualifications are more concerned with the quality of the work they perform and productivity. Kosteas (n.d.) reported that workers who believe promotion is possible in their jobs reported higher job satisfaction, while participants who benefited from past promotions had no impact on job satisfaction. In addition, the author reported that those in positions that had no opportunity for promotion did not consider promotion in their job satisfaction inventory regardless of their demographic characteristics. Libi (2018) reported on the importance of communication in the workplace. Libi (2018) noted that effective communication enhances job satisfaction while ineffective communication is a recipe for dissatisfaction on the job.
Pirraglia (n.d.) reported that ethnic diversity can sometimes increase or decrease job satisfaction. The author suggested that where there is discrimination and prejudice due of cultural differences, employee dissatisfaction prevails.
A review of related literature has not provided a conclusive finding on the role of sociodemographic variables of how employees feel about their job satisfaction. It may be concluded that based on these different studies, different demographic factors play different roles regarding employee feelings about their job satisfaction in different settings
This descriptive correlational study was guided by a positivist paradigm. The researcher targeted hospital workers within the southern region of the United States.
The sampling process targeted approximately 7, 425 employees hospital workers in the Texas region (Bureau of Labor Statistics [BLS], 2019). Out of this population, (N=370) responses were received but only (N=240) were accepted and considered complete for analysis. Participants were randomly selected from four randomly selected hospitals and participation was voluntary with their responses treated with anonymity. The sample size selected was done by G⃰ Power analysis
The researcher used two types of instruments: The Job satisfaction Scale (JSS) (Spector, 1997) which measures employee perception on each of the facets of job satisfaction; and demographic scale designed by the researcher for demographic purposes. The survey was administered using survey monkey to consented participants only. Participants were given two weeks to complete surveys and data analysis was done using SPSS 25.
Two types of analyses were done: 1) Descriptive analysis and 2) Hypothesis testing.
i) Descriptive Statistics: The descriptive analysis was performed to examine the influence of demographic data on job satisfaction and to provide more insight into the study. The following results were obtained: TABLE 1 shows the distribution of demographic characteristics of participants starting with age distribution. The age group (18 – 30) had 63 participants 63/240 (26 3%), (31 – 40) had more participants 102/240 (42.5%), (41 – 50) years 65/240 (27%), and (51 –60) had 10/240 participants (4.2%) having the least number of participants compared to all other age groups.
The researcher also considered participants based on generational groups. The millennial group (18 – 34) had 109/240 (45.4%), Generation X (35 – 46) had 106/240 (44.2%), Young Boomers (47 – 56) had 24/240 (10%), older boomers (57 –65) had 1/240 (4%) which is the least among the generational groups.
The next demographic variable was gender. There were more female respondents 159/240 (66.2%) than males 81/240 (33.8%). Regarding the educational levels, 100/240 (41.7%) of the participants had high school diplomas and 90/240 (37.5%) had earned an Associate Degree. Out of the 20.7% remaining, 17.1% had a bachelor’s degree, 3.3% had a master’s degree, and 0.4% had a doctorate degree. Regarding experience on the job, 94 2% had at least 11 years of experience or less on the job, and 5.4% had more than 12 years of experience on the job.
ISSN 2348-1218 (print)
International Journal of Interdisciplinary Research and Innovations ISSN 2348-1226 (online) Vol. 8, Issue 2, pp: (31-49), Month: April - June 2020, Available at: www.researchpublish.com
Next, ethnicity was considered. There were 48/240 (20%) Asian respondents, 83/240 (34.6%) black respondents, 23/240 (9.6%) Hispanic respondents, and 86/240 (35.8%) white respondents. Overall, there were more whites’ respondents, followed by blacks and Asians. These results are available on TABLE 1 below.
TABLE
Demographics characteristics n %
Age 18 – 30 31 – 40 41 – 50 51 – 60
Generational Category (18 – 34) Millennials (35 – 46) Gen. X (47 – 56) Young Boomers (57 – 65) Older Boomers Gender Male Female Educational level High school Associates Bachelors Masters Experience in years 0 – 3 4 – 7 8 – 11 >12
Ethnicity Asian Black Hispanic White
63 102 65 10 109 106 24 1 81 159 100 90 42 8 100 85 39 13 48 83 23 86
26.3 42.5 27.0 4.2 45.4 44.2 10.0 4 33.8 66.2 41.7 37.5 17.5 3.3 42.5 35.4 16.3 5.4 20.0 34.6 9.6 35.8
Table 2 represents statistics for demographic variables. The results were as follows: Gender (M = 1.34, SD = .470); Age (M = 2.09, SD = .830); Education (M = 1.82, SD = .83); Experience (M = 1.84, SD = .89); and Ethnicity (M = 2.61, SD = 1.17).
Percentiles 25th 50th (Median) 75th Gender 1.3375 .47385 1.00 2.00 1.0000 1.0000 2.0000 Age 2.0917 .83336 1.00 4.00 1.0000 2.0000 3.0000 Education 1.8250 .83503 1.00 4.00 1.0000 2.0000 2.0000 Experience 1.8417 .88687 1.00 4.00 1.0000 2.0000 2.0000 Ethnicity 2.61 1.166 1 4 2.00 2.00 4.00
Mean Std. Deviation Minimum Maximum
Table 3 represents statistics for JSS facets. Results were as follows: Supervision (M = 16.90, SD = 1.70); fringed benefits (M = 16.30, SD = 1.27); contingent rewards (M = 20.10, SD = 1.30); operating conditions (M = 15.90, SD = 1.04);
ISSN 2348-1218 (print)
International Journal of Interdisciplinary Research and Innovations ISSN 2348-1226 (online) Vol. 8, Issue 2, pp: (31-49), Month: April - June 2020, Available at: www.researchpublish.com
coworkers (M = 16.70, SD = 1.00); nature of work (M = 16.90, SD = 1.58); communication (M = 13.30, SD = 1.00); pay (M = 16.20, SD = 1.67); and promotion (M = 15.80, SD = 1.67).
Minimum Maximum Mean Std. Deviation
Supervision 14.00 19.00 16.9000 1.70355
Fringe benefits 14.00 18.00 16.3000 1.27151
Contingent rewards 18.00 22.00 20.1000 1.30272
Operating conditions 14.00 17.00 15.9000 1.04621
Coworkers 15.00 19.00 16.7000 1.00709
Nature_of_work 15.00 19.00 16.9000 1.58127
Communication 12.00 15.00 13.3000 1.00709
Pay 15.00 19.00 16.2000 1.16863
Promotion 14.00 18.00 15.8000 1.16863
Total satisfaction 135.00 159.00 148.1000 7.61127
Valid N (listwise)
N= 240
The first step in any data analysis is to conduct an exploratory data analysis (EDA), which enable the researcher to identify abnormalities in the data and dictates the types of test to be conducted. The (EDA) consists of three tests: test for reliability, test for outliers, and test for normality. The reliability analysis test for the Job Satisfaction Scale (JSS) resulted in a Cronbach’s alpha (α) of 0.80; an (α) of .84 when the scaled was grouped into the nine individual facets; and an (α) of .76 when Total Job Satisfaction scores were included in the analysis. All of the resulting alpha values were above the acceptable level of α ≥ .70, which is the recommended α value for data analysis (Gliem & Gliem, 2003).
The test of Outliers was evaluated using boxplots to get rid of any undue influence on the results in hypothesis testing, but the records were retained because the researcher did not want to interfere with the integrity of the data. If the data is normal, parametric testing will occur, but if abnormal, nonparametric testing will occur
The researcher evaluated the distribution of variables for normality using the Kolmogoroff-Smirnov (K-S) test. The results showed that the p-value is less than .05 for both the demographic and Job Satisfaction data, which meant that the variables were not normally distributed. See tables 2 and 3
One-Sample Kolmogorov-Smirnov Test Gender Age Education Experience Ethnicity Normal Parametersa,b Mean 1.3375 2.0917 1.8250 1.8417 2.61 Std. Deviation .47385 .83336 .83503 .88687 1.166
Most Extreme Differences Absolute .424 .231 .255 .258 .246 Positive .424 .231 .255 .258 .246 Negative -.256 -.194 -.166 -.171 -.241
Test Statistic .424 .231 .255 .258 .246 Asymp. Sig. (2-tailed) .000c .000c .000c .000c .000c a. Test distribution is Normal. b. Calculated from data. c. Lilliefors Significance Correction.
ISSN 2348-1218 (print)
International Journal of Interdisciplinary Research and Innovations ISSN 2348-1226 (online) Vol. 8, Issue 2, pp: (31-49), Month: April - June 2020, Available at: www.researchpublish.com
TABLE 5. TEST FOR NORMALITY AMONG MULTIFACETED JOB SATISFACTION VARIABLES
One-Sample Kolmogorov-Smirnov Test
PA PRO SUP FB CR OC CW NW CM
Normal Parametersa,b Mean 16.2 15.8 16.9 16.3 20.1 15.9 16.7 16.9 13.3
Std. D. 1.168631.168631.703551.271511.302721.046211.007091.581271.00709
Most Extreme Differences Absolute .268 .253 .201 .209 .201 .253 .283 .208 .317
Positive .268 .253 .201 .147 .201 .205 .283 .185 .317 Negative -.152 -.148 -.191 -.209 -.155 -.253 -.217 -.208 -.183
Test Statistic .268 .253 .201 .209 .201 .253 .283 .208 .317 Asymp. Sig. (2-tailed) .000c .000c .000c .000c .000c .000c .000c .000c .000c
a. Test distribution is Normal.
b. Calculated from data.
c. Lilliefors Significance Correction.
PA = pay; PR = promotion; SP = Supervisor; FB = Fringe benefits; CR – contingent rewards; OC = Operational conditions; CW = Coworker; NW = Nature of work; CM = Communication.
Nonparametric testing of hypotheses was conducted.
To answer research question 1. What is the relationship between demographic characteristics of age, gender, experience, ethnicity, and educational level and Total Job Satisfaction (TS) among hospital staff located in the Southern region of the United States?
A Spearman Rank-Order Correlation Coefficient test was conducted for any relationship between Total Job Satisfaction (TS) and Demographic characteristics of age, gender, educational level, experience, and ethnicity. The following results were obtained (Table 6):
1. The correlation between Total Job Satisfaction (TS) and age was found to be statistically significant, rs(239) = -.115, p = .042, 1 tailed
2. The correlation between Total Job Satisfaction (TS) and gender was not statistically significant, rs(239) = -.037, p = .285, 1 tailed
3. The correlation between Total Job Satisfaction (TS) and education was not statistically significant, rs(239) = .008, p = .452, 1 tailed
4. The correlation between Total Job Satisfaction (TS) and ethnicity was not statistically significant, rs(239) = -.019, p = .385, 1 tailed
5. The correlation between Total Job Satisfaction (TS) and experience was not statistically significant, rs(239) = -.017, p = .399, 1 tailed
6. The correlation between Total Job Satisfaction (TS) and generational categories was found to be statistically significant, rs(239) = -.112, p = .038, 1 tailed.
Results of the test revealed significant negative relationships between TS and Age [rs(239) = -.115, p = .038, 1 tailed], and TS and Generational categories [rs(239) = -.112, p = .042, 1 tailed]. However, results of the Spearman’s Rank-Order, 2 -tailed did not show any significant difference between TS and age and Generational categories, respectively TS and Age [rs(239) = -.115, p = .038, 2 tailed], and TS and Generational categories [rs(239) = -.112, p = .042, 2 tailed]. The remaining demographics characteristics did not reveal any significant relationship with TS in both the 2-tailed and the 1tailed tests Overall, age, gender, ethnicity, experience, and generational categories revealed a negative relationship with TS, while education alone showed a positive relationship with TS but not at a level of significance.
ISSN 2348-1218 (print)
International Journal of Interdisciplinary Research and Innovations ISSN 2348-1226 (online) Vol. 8, Issue 2, pp: (31-49), Month: April - June 2020, Available at: www.researchpublish.com
Spearman’s
GD GN AG ED EX ET PA PR SP FB CR OC CW NW CM TS
TS Rho -.037 -.112* -.115* .008 -.017 -.019 .641** .739** .648** .683** .572** .685** .539** .814** .594** 1.000 Sig. .285 .042 .038 .452 .399 .385 .000 .000 .000 .000 .000 .000 .000 .000 .000
**. Correlation is significant at the 0.01 level (1-tailed).
*. Correlation is significant at the 0.05 level (1-tailed).
GN = Gender; PA = Pay; PR = Promotion; SU = Supervision; FB = Fringe benefits; CR = Contingent rewards; OC = Operational conditions; CW Coworker; NW = Nature of Work; CM = Communication; TS = Total satisfaction; AG = age; ED = Education; EX = experience; ET = Ethnicity; GC = Generational category
A Post-hoc test was conducted to examine which specific facet of job satisfaction was impacted by age and generational categories. A Bonferroni correction was used to AVOID Type 1 errors with an adjusted p-value of .008 (.05/6) to reject null hypotheses. Results of the test revealed no significant relationship between demographic characteristics of age, gender, education, experience, ethnicity and generational categories, and Total Job satisfaction. Results were as follows:
TS x Gender [rs(239) = .569, p > .008]; TS x Age [rs(239) = .076, p > .008]; TS x Generational categories [rs(239) = .084, p > .008]; TS x Education [rs(239) = .903, p > .008]; TS x Experience [rs(239) = .798, p > .008], and TS x Ethnicity [rs(239) = .770, p > .008]
Since TS by itself does not give a complete insight into individual JSS facets. The researcher conducted a Kruskal-Wallis (K-W) test to examine how the individual JSS facets differ based on demographic characteristics. The results below provided answers to research questions 2 – 7 accordingly.
Facets GN AG EX ED ET GC df 1 3 3 3 3 3
PA .567 .840 .486 .458 .398 .401 PR .153 .227 .644 .303 .840 .635 SP .543 .954 .608 .538 .501 .456 FB .981 .101 .989 .142 .898 .605 CR 1.00 .842 .673 .271 .248 .293 OC .518 .234 .555 .103 .636 .791 CW .857 .945 .553 535 .788 .841 NW .362 .093 .786 .081 .653 .378 CM .779 .230 .888 .165 .979 .056 TS .568 .113 887 .061 .821 .263
GN = Gender; PA = Pay; PR = Promotion; SU = Supervision; FB = Fringe benefits; CR = Contingent rewards; OC = Operational conditions; CW Coworker; NW = Nature of Work; CM = Communication; TS = Total satisfaction; AG = age; ED = Education; EX = experience; ET = Ethnicity; GC = Generational category
Research Question 2: To answer RQ 2. How do hospital staff Job Satisfaction facets scores differ based on gender? A KW test of independence samples was performed to examine the difference among the variables (Table 7). The results showed no significant differences between gender and total job satisfaction scores, as well as individual job satisfaction facets. Post-hoc test was not conducted. The results were as follows: Pay = [X2(1, N=240) = .327, p = .567]; Promotion = [X2(3, N=240) = 2 040, p = .153]; Supervision = [X2(3, N=240) = .369, p = .543]; Fringe Benefits = [X2(3, N=240) = .001, p = .981]; Contingent Reward = [X2(3, N=240) = .000, p = 1 00]; Operating Conditions = [X2(3, N=240) = .418, p = .518]; Coworker = [X2(3, N=240) = .032, p = .867]; Nature of Work = [X2(3, N=240) = .830, p = .362]; Communication [X2(3, N=240) = .079, p = .779], and Total Job Satisfaction [X2(3, N=240) = .326, p = .568]
ISSN 2348-1218 (print)
International Journal of Interdisciplinary Research and Innovations ISSN 2348-1226 (online) Vol. 8, Issue 2, pp: (31-49), Month: April - June 2020, Available at: www.researchpublish.com
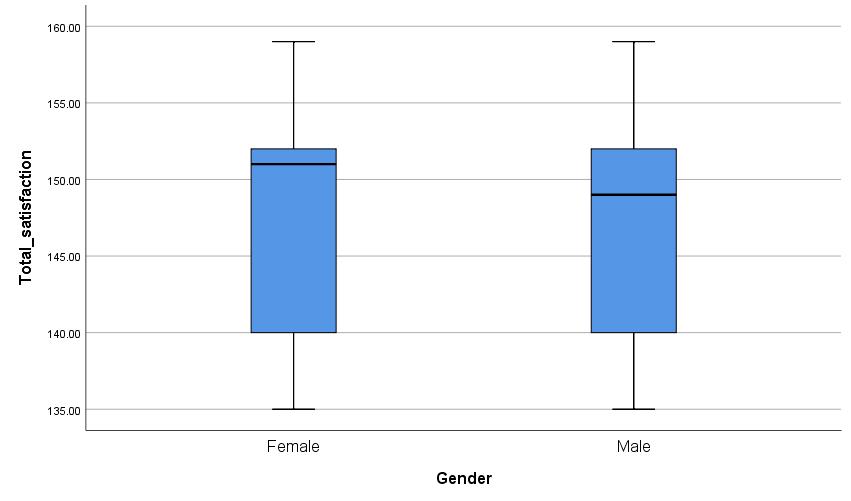
The researcher constructed a boxplot for TS by gender (fig. 1) and JSS facets by gender (fig.2). Overall, the boxplot presented no significant differences among staff regarding TS and the individual facets when analyzed by gender.
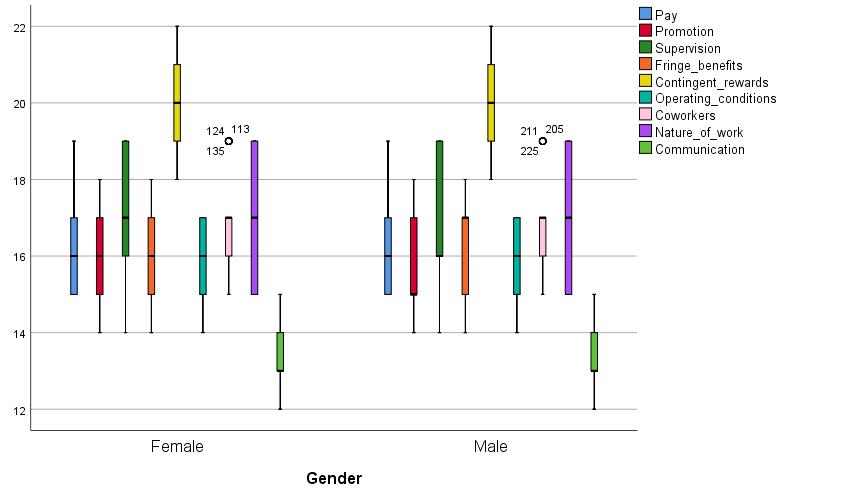
However, there were differences in median scores for supervision and promotion (fig. 2). However, these differences were not significant to cause an overall difference in total job satisfaction among staff.
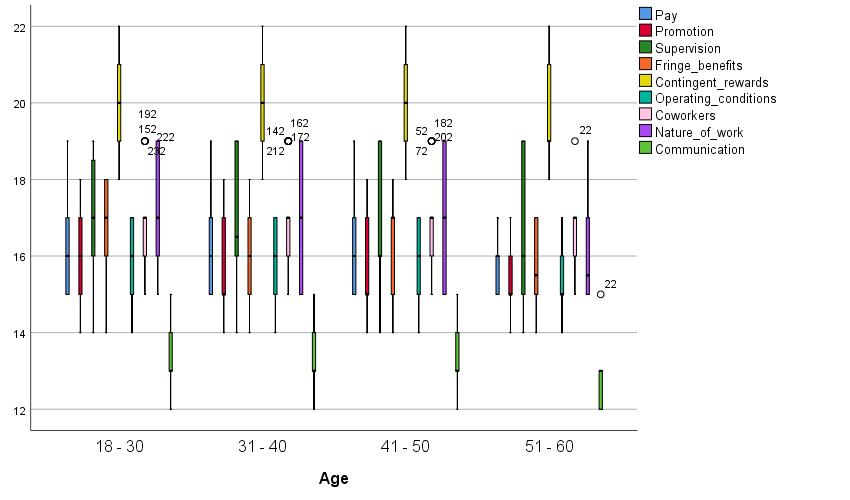
Research Question 3. To answer RQ 3: How do hospital staff Job Satisfaction facets differ based on age? A K-W test of independence samples was performed to examine the difference among the variables (Table 7). The results showed no significant differences between age and total job satisfaction scores, as well as individual job satisfaction facets. A posthoc test was not conducted. The results were as follows: Pay = [X2(3, N=240) = .839, p = .840]; Promotion = [X2(3, N=240) = 4.337, p = .227]; Supervision = [X2(3, N=240) = .333, p = .954]; Fringe Benefits = [X2(3, N=240) = 6.240, p = 101]; Contingent Reward = [X2(3, N=240) = .832, p = .842]; Operating Conditions = [X2(3, N=240) = 4.263, p = .234]; Coworker = [X2(3, N=240) = .375, p = .945]; Nature of Work = [X2(3, N=240) = 6.414, p = .093]; Communication [X2(3, N=240) = 4.304, p = .230]; and Total Job Satisfaction [X2(3, N=240) = 5.971, p = .113].
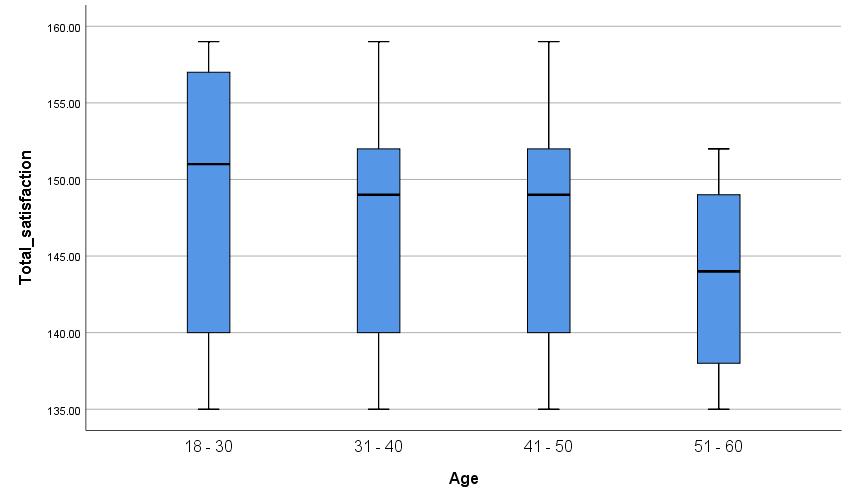
The researcher also constructed a boxplot for TS by age (fig. 3) and JSS facets (fig.4). Overall, the boxplot presented no significant differences among staff regarding TS and the individual facets when analyzed by age The minimum scores for all the age groups were the same, so are the maximum scores except for the age group (51 – 60). The boxplots are long showing participants differ in opinion even within their age group on the various facets of JS. Finally, the boxplots show more agreement among participants in the upper quartile than in the lower quartile. However, these differences were not significant to cause an overall difference among participants in their total job satisfaction.
ISSN 2348-1218 (print)
International Journal of Interdisciplinary Research and Innovations ISSN 2348-1226 (online) Vol. 8, Issue 2, pp: (31-49), Month: April - June 2020, Available at: www.researchpublish.com
The multifacet job satisfaction analysis showed a similar trend. Most of the job facets showed a similar pattern except for contingent rewards and communication. Again, these differences were not significant to cause an overall difference among participants in their total job satisfaction.
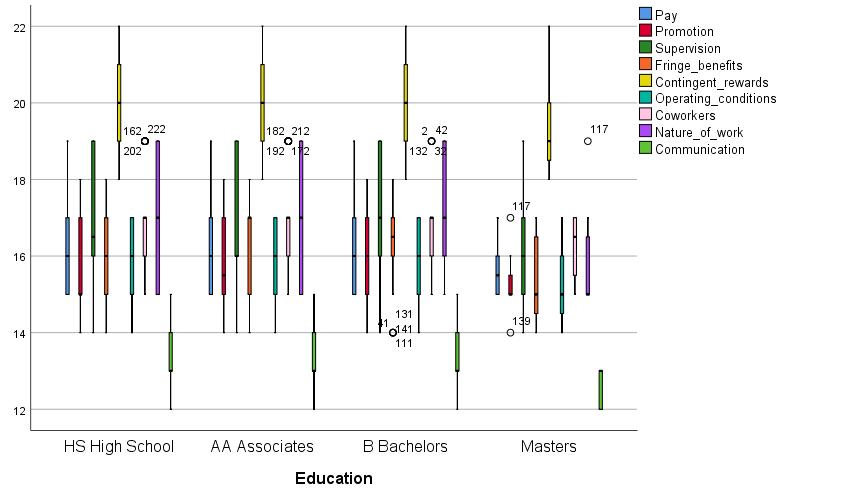
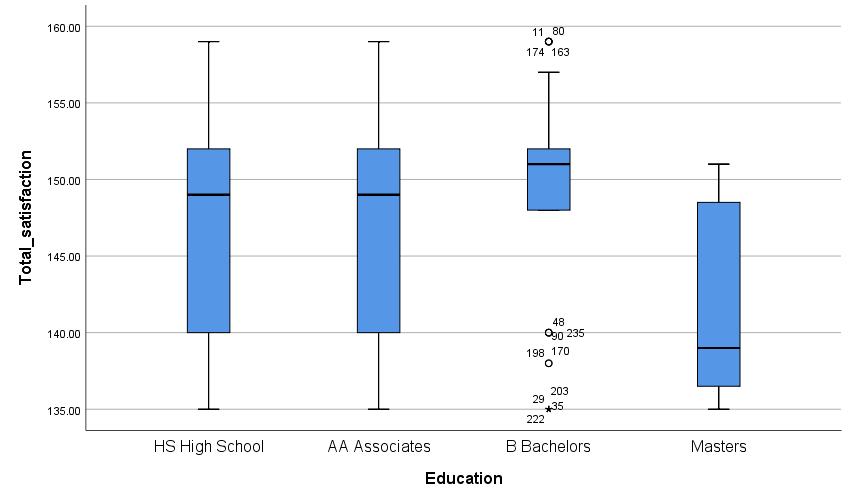
Research Question 4 To answer RQ 4: How do hospital staff Job Satisfaction facets differ based on Education? A K-W test of independence samples was performed to examine the difference among the variables (Table 7). The results showed no significant differences between education and total job satisfaction scores, as well as individual job satisfaction facets. No post-hoc test was conducted. The results were as follows: Pay = [X2(3, N=240) = 2.598, p = .458]; Promotion = [X2(3, N=240) = 3.641, p = .303]; Supervision = [X2(3, N=240) = 2.168, p = .538]; Fringe Benefits = [X2(3, N=240) = .5.442, p = .142]; Contingent Reward = [X2(3, N=240) = 3.914, p = .271]; Operating Conditions = [X2(3, N=240) = 6.185, p = 103]; Coworker = [X2(3, N=240) = 1.627, p = .535]; Nature of Work = [X2(3, N=240) = 6.743, p = .081]; Communication [X2(3, N=240) = 5.098, p = .165]; Total Job Satisfaction [X2(3, N=240) = 7.362, p = .061]
Further, the researcher constructed a boxplot for TS scores by education (fig. 5) and JSS facets (fig. 6). Overall, the boxplot presented no significant differences among staff regarding TS and the individual facets when analyzed by education The boxplot revealed similar perceptions for participants with high school and associated degree qualifications and they represented 79.2% of the total number of participants. Bachelors and master’s degree holders represented 20.81% of the participants. As a result, the differences revealed by bachelor’s and master’s degree holders were not significant to cause a significant difference in total job satisfaction scores among participants.
ISSN 2348-1218 (print)
International Journal of Interdisciplinary Research and Innovations ISSN 2348-1226 (online) Vol. 8, Issue 2, pp: (31-49), Month: April - June 2020, Available at: www.researchpublish.com
Again, the multifaceted job satisfaction analysis showed a similar trend. Most of the job facets showed similar pattern high school, associates, and bachelor’s degree holders for the most part. However, bachelor’s and master’s degree holders showed differences in fringe benefits and promotions, respectively. These differences, however, were not significant to cause an overall difference among participants in their total job satisfaction.
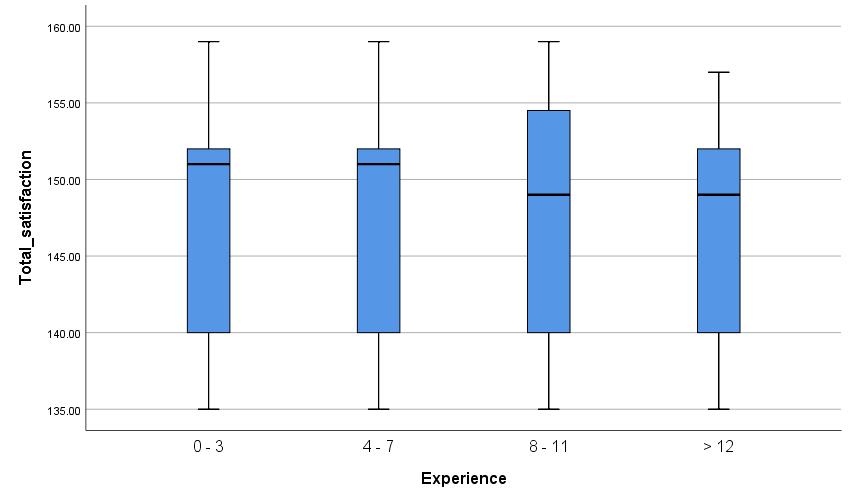
Research Question 5 To answer RQ 5: How do hospital staff Job Satisfaction facets differ based on experience? A K-W test of independence samples was performed to examine the difference among the variables (Table 7). The results showed no significant differences between years of experience on current job and total job satisfaction, as well as job satisfaction facets. No post-hoc test was conducted. The results were as follows: Pay = [X2(3, N=240) = 2.444, p = .486]; Promotion = [X2(3, N=240) = 1.833, p = .644]; Supervision = [X2(3, N=240) = .369, p = .543]; Fringe Benefits = [X2(3, N=240) = .120, p = .989]; Contingent Reward = [X2(3, N=240) = 1.542, p = .673]; Operating Conditions = [X2(3, N=240) = 2.084, p = .555]; Coworker = [X2(3, N=240) = 2.097, p = .553]; Nature of Work = [X2(3, N=240) = 1.061, p = .786]; Communication [X2(3, N=240) = .637, p = .888]; Total Job Satisfaction [X2(3, N=240) = .640, p = .887] A post hoc analysis was not conducted.
ISSN 2348-1218 (print)
International Journal of Interdisciplinary Research and Innovations ISSN 2348-1226 (online) Vol. 8, Issue 2, pp: (31-49), Month: April - June 2020, Available at: www.researchpublish.com
Again, the researcher constructed a boxplot for TS scores by experience (fig. 7) and JSS facets (fig. 6). Overall, the boxplot presented no significant differences among staff regarding TS and the individual facets when analyzed by experience years on the current job. All categories had the same minimum and maximum scores except for the category with experiences greater than 12 years. All participants had different views as indicated by the length of the boxes, but a greater percentage of the scores lie in the second quadrant with apparently no significant difference among participants regarding the median scores.
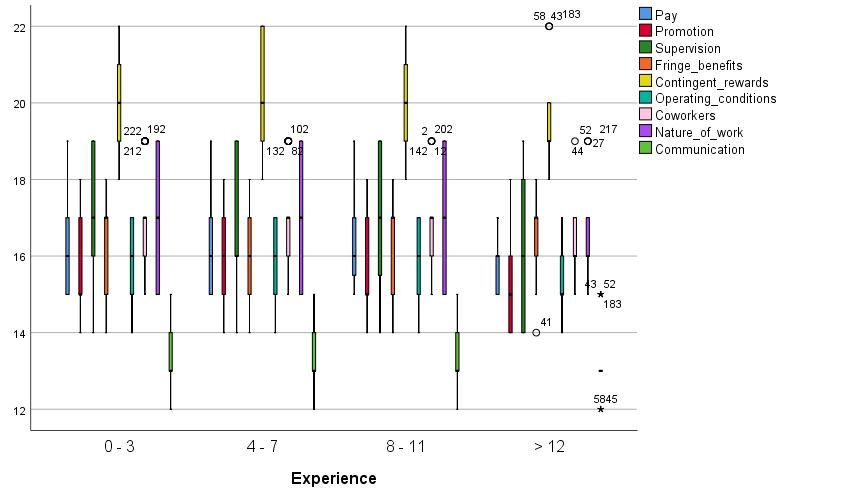
The multifaceted job satisfaction analysis showed a similar trend (fig. 8). Most of the job facets showed a similar pattern except for contingent rewards, communication, supervision, and promotion. Again, these differences were not significant to cause an overall difference among participants in their total job satisfaction. The staff with over 12 years of experience differ from the others but they only form 5.4% of the participants and as a result, were not able to impact the overall job satisfaction of the entire staff.
ISSN 2348-1218 (print)
International Journal of Interdisciplinary Research and Innovations ISSN 2348-1226 (online) Vol. 8, Issue 2, pp: (31-49), Month: April - June 2020, Available at: www.researchpublish.com
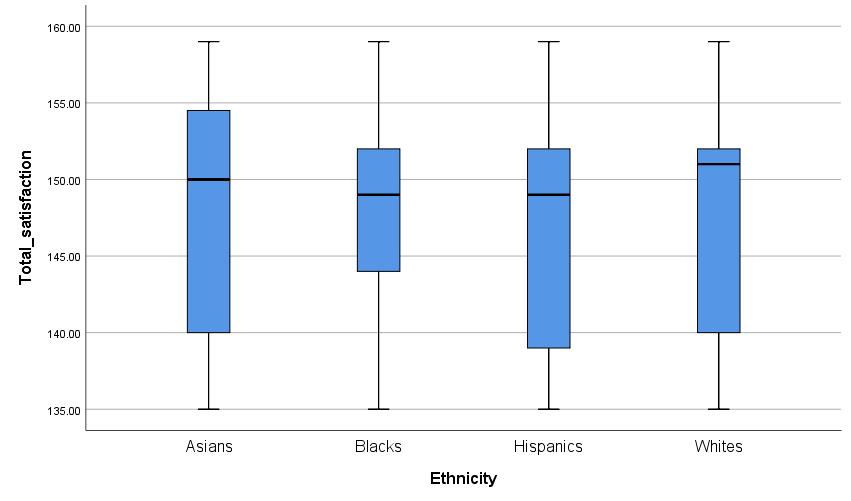
Research Question 6 To answer RQ 6: How do hospital staff Job Satisfaction facets differ based on ethnicity? A K-W test of independence samples was performed to examine the difference among the variables (Table 7). The results showed no significant differences between ethnicity and total job satisfaction, as well as job satisfaction facets. A post-hoc test was not conducted. These are the results: Pay = [X2(3, N=240) = 3.014, p = .398]; Promotion = [X2(3, N=240) = .841, p = 840]; Supervision = [X2(3, N=240) = 2.360, p = .501]; Fringe Benefits = [X2(3, N=240) = .595, p = .898]; Contingent Reward = [X2(3, N=240) = 4.132, p = .248]; Operating Conditions = [X2(3, N=240) = 1.702, p = .636]; Coworker = [X2(3, N=240) = 1.056, p = .788]; Nature of Work = [X2(3, N=240) = 1.627, p = .653]; Communication [X2(3, N=240) = .189, p = .979]; Total Job Satisfaction [X2(3, N=240) = .917, p = .821]. A post-hoc test was not conducted.
The researcher constructed a boxplot for TS scores by ethnicity (fig. 9) and JSS facets (fig. 10). Overall, the boxplot presented no significant differences among staff regarding TS and the individual facets. The maximum and minimum scores were the same and there were no significant differences among participants based on median scores. The boxplot revealed that blacks were in more agreement regarding their job satisfaction compared to the other ethnic groups
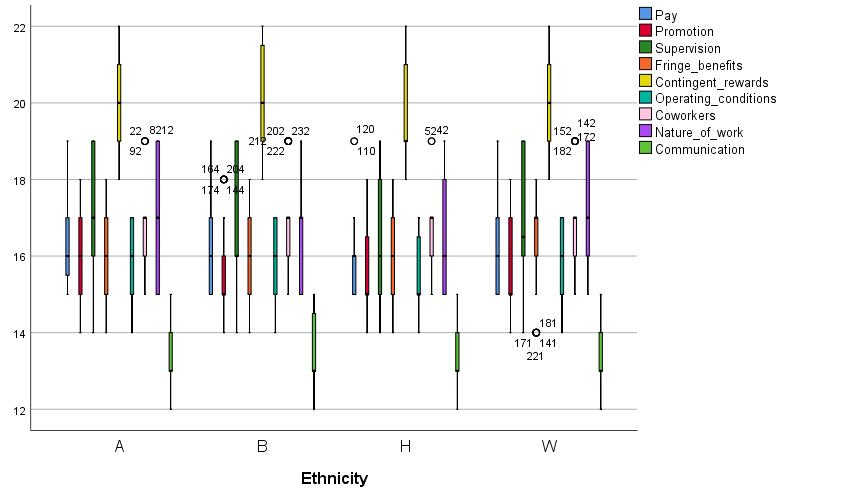
The multifaceted job satisfaction analysis showed a similar trend (fig. 10). Most of the job facets showed similar patterns except for the nature of work for Hispanics. Again, these differences were not significant to cause an overall difference among participants in their total job satisfaction. Hispanics represented only 9.6% of the total number of participants.
ISSN 2348-1218 (print)
International Journal of Interdisciplinary Research and Innovations ISSN 2348-1226 (online) Vol. 8, Issue 2, pp: (31-49), Month: April - June 2020, Available at: www.researchpublish.com
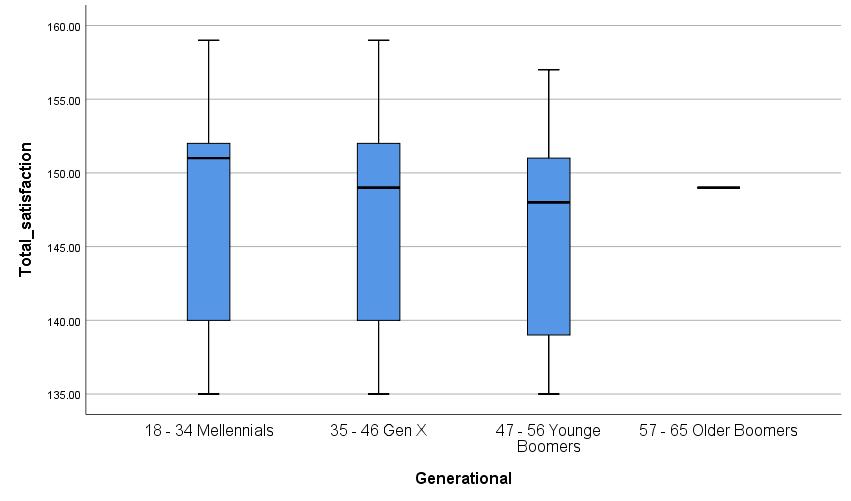
Research Question 7: To answer RQ 7: How do hospital staff Job Satisfaction facets differ based on generational categories? A K-W test of independence samples was performed to examine the difference among the variables (Table 7). The results showed no significant differences between generational categories and total job satisfaction, as well as job satisfaction facets of pay, promotion, supervision, fringe benefits, contingent rewards, operating conditions, coworkers, nature of work, and communication. A post-hoc test was not conducted. These were the results: Pay = [X2(3, N=240) = 2.939, p = .401]; Promotion = [X2(3, N=240) = 1.710, p = .635]; Supervision = [X2(3, N=240) = 2.606, p = .456]; Fringe Benefits = [X2(3, N=240) = 1.844, p = .605]; Contingent Reward = [X2(3, N=240) = 3.722, p = .293]; Operating Conditions = [X2(3, N=240) = 1.044, p = 791]; Coworker = [X2(3, N=240) = .836, p = .841]; Nature of Work = [X2(3, N=240) = 3.090, p = .378]
Communication [X2(3, N=240) = 7.548, p = .056]; Total Job Satisfaction [X2(3, N=240) = 3.982, p = .263]. A post-hoc test was not conducted.
Again, the researcher constructed a boxplot for TS scores by generational categories (fig. 11) and JSS facets (fig. 12). Overall, the boxplot presented no significant differences among staff regarding TS and the individual facets. There was no significant difference among participants regarding their median scores. The maximum and minimum scores were the same for participants, except for older boomers. The older boomers form 4 % of the participants. As a result, differences created by them were not significant to cause a change in total job satisfaction among participants.
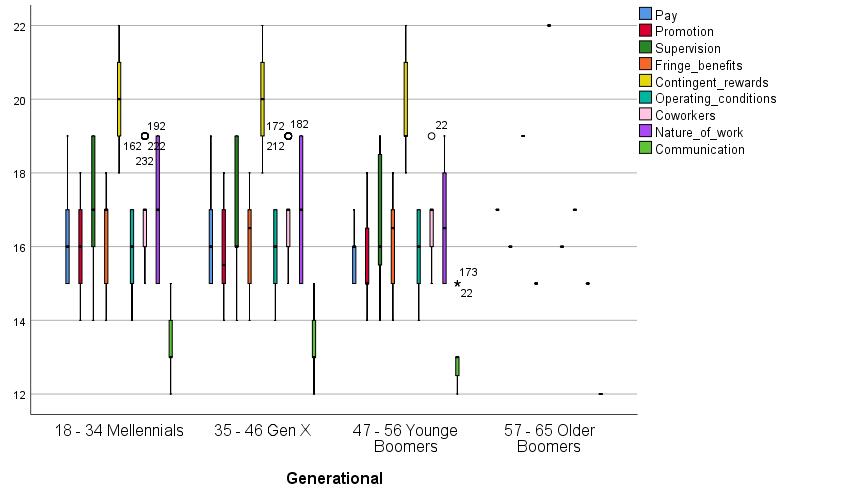
The trend was the same for the individual JSS facets.
FIG.
ISSN 2348-1218 (print)
International Journal of Interdisciplinary Research and Innovations ISSN 2348-1226 (online) Vol. 8, Issue 2, pp: (31-49), Month: April - June 2020, Available at: www.researchpublish.com
Further examination based on job categories also revealed no significant differences among clinical and nonclinical staff concerning their job satisfaction (See fig. 13)
FIG. 13. MULTIFACET JOB SATISFACTION BY JOB CATEGORIES
The purpose of the study was to investigate the association between job satisfaction and demographics characteristics of age, gender, years of experience, educational level, ethnicity, and generational categories. Analysis of results using Spearman’s Rank-Order Correlation (1 – tailed) revealed a significant negative relationship between Total Job Satisfaction and age; and generational categories [rs(239) = -.115, p = .042; rs(239) = -.112, p = .038] respectively. However, a (2 – tailed) Spearman’s Rank-Order Correlation test did reveal a negative relationship but not at a level of significance [rs(239) = - .115, p = .076; rs(239) = - .115, p = .084] respectively. A post-hoc test conducted failed to reveal any specific demographic character impacting total Job satisfaction. The reason for this is that there were fewer older participants in the study. Participant 51 years and above comprised only 4.2% of the entire sample. An increase in age has a negative effect on job satisfaction while decrease in age had a positive effect on job satisfaction. While in some studies increase in age positively correlated to job satisfaction, in this study, younger staff showed a positive relationship with job satisfaction. The reason for this maybe most of the participants were of younger to middle age and were nurses and technical healthcare professionals with high pay and better work conditions and were in the professions they have always dreamed of.
The other demographic characters of gender, and ethnicity, and experience showed a negative relationship with TS. The results were [TS x gender: rs(239) = -.037, p = .285, 1 tailed]; [TS x ethnicity: rs(239) = -.019, p = .385, 1 tailed] and [TS x years of experience on current job: rs(239) = -.017, p = .399, 1 tailed], while educational level alone showed a positive but not a significant relationship [TS x Education: rs(239) = .008, p = .452, 1 tailed]. Several studies (Pirraglia, n.d., Carvajal & Popovici, 2019; Riza, Ganzach, & Liu, 2016) have reported complicated relationships among variables about job satisfaction. Tenure or experience in years on the current job, age, and ethnicity sometimes show negative relationships with job satisfaction. For example, an employee with several years of experience may exhaust all avenues for benefits and promotions and may become bored of the job. The same way, older employees may become bored and frustrated with their job if they lack the qualification, see no room for promotion, and get caught up with the worries of lower productivity, and possible retirement or layoff. With regard to gender, studies show women report more in favor of job satisfaction but as the same time report more also on burnout, and work stress.
Since total job satisfaction alone could not reveal much about an employee’s feeling about their job, the researcher examined other facets of job satisfaction. The results of the independent sample Kruskal-Wallis test did not reveal any significant differences among participants concerning their feelings about job satisfaction based on demographic

ISSN 2348-1218 (print)
International Journal of Interdisciplinary Research and Innovations ISSN 2348-1226 (online) Vol. 8, Issue 2, pp: (31-49), Month: April - June 2020, Available at: www.researchpublish.com
characters. Demographic characteristics of age, gender, educational level, and tenure of years of experience on the job, and ethnicity did not produce significant differences among staff with how they feel about their job, even though there were wide differences in scores among staff. Over the years, results of studies regarding demographic characteristics and job satisfaction have produced mixed results. While some studies significant differences among staff concerning their job satisfaction, others do not Concerning job satisfaction, this study did not find any significant differences among staff based on demographic characters. This finding was consistent with the findings of Vorina, Simonič, and Vlasova,(2017). However, the results did show that participants felt differently about individual facets of their jobs as revealed by boxplots.
The researcher has the following implications for the study.
While the researcher’s findings were consistent with other studies (Brinkmann, 2017; Judge, Piccolo, & Podsakoff, 2010), other researchers have reported significant differences among staff with their job satisfaction (Agbure 2017; Abbassi, 2015; Chirchir, 2016; Kolo, 2018). The researcher, however, found a significant negative relationship between job satisfaction and age; and generational categories. This finding was consistent with Riza, Ganzach and Liu (2016) who reported that although previous studies revealed that as people age with better pay benefits, job satisfaction increases. But studies looking at how long people have been at an organization shows a decline in job satisfaction. Therefore, increases in job satisfaction depend on the time metrics the researcher is using, that is, biological age or number of years on a specific job. In any case, as a person get older on a job, there is an increase in biological age and years of experience in the same job. Over time, with fewer or no opportunities, they become bored and sometimes dissatisfied
(B)Implications
The results of the study showed that total job satisfaction alone does not reveal the employee’s feelings about their jobs. Employees value different aspects of their jobs. Even though the results did not reveal significant differences among staff based on their demographic characters, employers must consider what is of value to an employee when they are hired. Employers should not consider demographic characters in their hiring practices if the candidate meets the minimum requirements for the job. Many employees come to the job motivated to succeed and may, in fact, do a better job if treated with respected and given the necessary tools to empower themselves
The United States is a melting pot where diversities merge or blend. In the quest for the American dream, it is possible that many people may blend in and share common values. This phenomenon may have an impact on people’s perspectives about how they feel about certain aspects of their jobs and may have implications for practice and research.
Generally, it is expected to have significant differences among staff regarding their satisfaction and dissatisfaction for a job based on their demographic characteristics as many studies show. Therefore, the researcher suggests further investigation into the subject using a larger and culturally diverse sample. Interested researchers may consider other demographic characters, a wider and different geographical location, and participants from different healthcare disciplines.
Secondly, employers should not consider hiring staff based on demographic characters if candidates meet the requirements for the job. During interviews or onboarding, employers must try to understand what the employee values most about the job and try to work towards meeting in most part some of those values. Doing that may help reduce job dissatisfaction, absenteeism, tardiness, and may enhance job satisfaction, retention, and subsequently loyalty.
Employee job satisfaction is critical to the success of any organization. In most cases, as studies have shown, demographic characteristics of age, gender, educational level, years of experience on the current job, and ethnicity do impact an employee’s job satisfaction. However, in this study, that is not the case and this finding is consistent with other studies. Job satisfaction means different things to different people and in fact, it is a collection of different facets or aspects of a job that the employee values bring him/her satisfaction. This study considered the following aspects of job
ISSN 2348-1218 (print) International Journal of Interdisciplinary Research and Innovations ISSN 2348-1226 (online) Vol. 8, Issue 2, pp: (31-49), Month: April - June 2020, Available at: www.researchpublish.com
satisfaction: pay, promotion, nature of work, operating conditions, supervision, coworker, communication, fringe benefits, and contingent rewards. Many employees value different facets regardless of demographic characters. Employers must try to provide fair conditions that meet some of these facets.
[1] Abdul-Nasiru, I. & Mendah, R. (2016). Personality and Demographic Variables: Antecedents of Job Satisfaction Among Selected Employees in the Ghanaian Banking Sector. European Journal of Business and Management, 8(26), ISSN 2222-2839 (Online). Retrieved from https://www.iiste.org/Journals/index.php/EJBM/article/viewFile/32903/ 33799
[2] Agebure, A. B. (2014). Relationship between demographics characteristics and job satisfaction of senior high school teachers in the Bolgatanga Municipality of Ghana. Journal of Business and Management, 6(16), SSSN 2222 – 2839 Online.
[3] Bakotić, D. & Babić, T. (2014). Relationship between Working Conditions and Job Satisfaction: The Case of Croatian Shipbuilding Company. International Journal of Business and Social Science, 4(2), 206 – 213.
[4] Bureau of Labor Statistics [BLS] (2019). Labor force statistics from the current population survey. Retrieved from https://www.bls.gov/cps/cpsaat18.htm
[5] Carvajal, M. J., & Popovici, I. (2019). Gender, age, and pharmacists' job satisfaction in the United States. Pharmacy practice, 16(4), 1396. https://doi.org/10.18549/PharmPract.2018.04.1396
[6] Ceyda, M. (2014). Impact of fit, involvement, and tenure on job satisfaction and turnover intention, The Service Industries Journal, 34:14, 1113-1133, DOI: 10.1080/02642069.2014.939644
[7] Gliem, J. A, & Gliem, R. R. (2003). Calculating, interpreting, and reporting Cronbach’s alpha reliability coefficient for Likert-Type scales. Retrieved from http://pioneer.netserv.chula.ac.th/~ppongsa/2013605/Cronbach.pdf
[8] Chung, T., Rutherford, B. and Park, J. (2012), "Understanding multifaceted job satisfaction of retail employees", International Journal of Retail & Distribution Management, Vol. 40 No. 9, pp. 699-716. https://doi.org/10.1108/ 09590551211255974
[9] Dugguh, S. I., & Dennis, A. (2014). Job satisfaction theories: Traceability to employee performance in organizations IOSR Journal of Business and Management (IOSR-JBM), 16(5), 11 - 18
[10] Park, S., & Kim, S. (2017). The Linkage Between Work Unit Performance Perceptions of U.S. Federal Employees and Their Job Satisfaction: An Expectancy Theory. Transylvanian Review Of Administrative Sciences, 13(52), 7793. doi:http://dx.doi.org/10.24193/tras.52E.5
[11] Kolo, E. (2018). Job Satisfaction among Healthcare Workers in a Tertiary Center in Kano, Northwestern Nigeria. Nigerian Journal of Basic & Clinical Sciences, 15(1), 87–91. https://doi-org.proxy.cecybrary.com/10.4103/ njbcs.njbcs_31_17
[12] Frempong, L., Agbenyo, W. & Darko, P. (2018). The Impact of Job Satisfaction on Employees' Loyalty and Commitment: A Comparative Study Among Some Selected Sectors in Ghana. European Journal of Business and Management,10(12),95-105 Retrieved from https://www.iiste.org/Journals/index.php/EJBM/article/view/42154
[13] Bagus, B. N. K., Setiawan, W. G., Prayoga, S. M. (2018). Compensation, organizational culture and job satisfaction in affecting employee loyalty. Retrieved from http://ejournal.aibpm.org/index.php/JICP/article/view/638/626
[14] Brinkmann, J. T. (2017). Pay and Job satisfaction. Retrieved from https://www.opedge.com/Articles/ViewArticle/ 2017- 10-01/pay-job-satisfaction
[15] ChirChir, R. (2016). Demographic factors and job satisfaction: A case of teachers in public primary schools in Bomet County, Kenya. Journal of Education and Practice, 7(13), ISSN 2222-288X (Online). Retrieved from https://files.eric.ed.gov/fulltext/EJ1102798.pdf
[16] Ghafoor, M. (2012). Role of demographic characteristics on job satisfaction. Far East Journal of Psychology and Business, 6(3), 30 – 45.
ISSN 2348-1218 (print) International Journal of Interdisciplinary Research and Innovations ISSN 2348-1226 (online) Vol. 8, Issue 2, pp: (31-49), Month: April - June 2020, Available at: www.researchpublish.com
[17] González, F., Sánchez, S. M., & López-Guzmán, T. (2016). The effect of educational level on job satisfaction and organizational commitment: A case study in Hospitality, International Journal of Hospitality & Tourism Administration, 17:3, 243-259
[18] Hunt, J. W., & Saul, P. N. (2017). The relationship of age, tenure, and job satisfaction in males and females. Academy of Management Journal, 18(4). Retrieved from https://journals.aom.org/doi/abs/10.5465/255372
[19] Judge, T. A., R. F. Piccolo, N. P. Podsakoff, J. C. Shaw, and B. L. Rich. 2010.The relationship between pay and job satisfaction: A meta-analysis of the literature. Journal of Vocational Behavior 77(2):157-67.
[20] Khalil-Ur Rahman, W. Akhter, W. & Khan. S. U. (2017) , DOI: 10.1080/15256480.2016.1183547Factors affecting employee job satisfaction: A comparative study of conventional and Islamic insurance, Cogent Business & Management, 4:1, DOI: 10.1080/23311975.2016.1273082
[21] Kosteas, V. D. (n.d.). Job satisfaction and promotions. Retrieved on March 26, 2020, from https://academic csuohio.edu/kosteas_b/Job%20Satisfaction%20and%20Promotions.pdf 3917-9.ch018
[22] Libi, S. (2018). Social Issues in the Workplace: Breakthroughs in Research and Practice. Retrieved from https://www.igi-global.com/chapter/communication-and-job-satisfaction/192325, DOI: 10.4018/978-1-5225-
[23] Mundt, M. P., & Zakletskaia, L. I. (2019). Professional Communication Networks and Job Satisfaction in Primary Care Clinics. Annals of Family Medicine, 17(5), 428–435. https://doi-org.proxy.cecybrary.com/10.1370/afm.2442
[24] Pirraglia, W. (n.d.). Cultural effects on employee satisfaction. Retrieved on March 27, 2020, from https://work. chron.com/cultural-effects-employee-satisfaction-2702.html
[25] Riza, D. S., Ganzach, Y., & Liu, Y. (2016). Time and job satisfaction: a longitudinal study of the differential roles of age and tenure. Journal of Management. doi: 10.1177/0149206315624962
[26] Rukh, L., Choudhary, M. A., & Abbasi, S. A. (2015). Analysis of factors affecting employee satisfaction: A case study from Pakistan. Work, 52(1), 137–152. https://doi-org.proxy.cecybrary.com/10.3233/WOR-152039
[27] Singh, M.M. (2017). Job satisfaction among healthcare professional in public and private healthcare setup in India. Indian Journal of Applied Research, 6 (1), 6–8.
[28] Spector, P.E. (1997). Job satisfaction: Application, assessment, causes and consequences. Thousand Oaks, CA: SAGE.
[29] Tinu, O.C., & Adeniji, A.A. (2015). Gender influence on job satisfaction and job commitment among colleges of education lecturers. Journal of Education and Practice, 6 (13), 159–161.
[30] Tarcan, G. Y., Tarcan, M., & Top, M. (2017). An analysis of relationship between burnout and job satisfaction among emergency health professionals. Total Quality Management & Business Excellence, 28(11/12), 1339–1356. https://doi-org.proxy.cecybrary.com/10.1080/14783363.2016.1141659
[31] Tawana, B., Barkhuizen, N. E., & du Plessis, Y. (2019). A comparative analysis of the antecedents and consequences of employee satisfaction for urban and rural healthcare workers in KwaZulu-Natal province, South Africa. South African Journal of Human Resource Management, 17(1), 1–9. https://doi-org.proxy.cecybrary.com/ 10.4102/sajhrm.v17i0.1080
[32] Vorina, A. & Simonič, M. & Vlasova, M. (2017). An Analysis of the Relationship Between Job Satisfaction and Employee Engagement. Economic Themes. 55. Doi:10.1515/ethemes-2017-0014.
[33] Yalabik, Z. Y., Rayton, B. A., & Rapti, A. (2017). Facets of job satisfaction and work engagement. Evidence –Based HRM, 5(3), 248-265. doi:http://dx.doi.org.proxy.cecybrary.com/10.1108/EBHRM-08-2015-0036