ISSN 2348-1218 (print)
International Journal of Interdisciplinary Research and Innovations ISSN 2348-1226 (online) Vol. 8, Issue 2, pp: (108-115), Month: April - June 2020, Available at: www.researchpublish.com

ISSN 2348-1218 (print)
International Journal of Interdisciplinary Research and Innovations ISSN 2348-1226 (online) Vol. 8, Issue 2, pp: (108-115), Month: April - June 2020, Available at: www.researchpublish.com
Abstract: The Dar es Salaam City has been growing at a rapid pace which surpasses the capacity of the City’s local government authority for urban planning and development as a result of expansion of informal, unplanned settlements with inadequate infrastructure and services. Moreover, the Local government authority lacks adequate understanding of the trend of the rapid urban spatial growth with time, which results into little understanding of the rate and extent of the spatial growth due to the complex driving factors. This growth of the urban area affects land cover, hydrology, geochemistry, biodiversity and the socio-economic setup of the City. Understanding the occurrence of urban growth in space and time is very challenging. Thus, due to the complex interactions between humans and the environment, an Urban Growth Prediction Model (UGM) was developed using environmental factors to forecast urban growth by employing Geographical Information Systems (GIS), Remote Sensing (RS) and Artificial Neural Networks (ANNs). The predictive ability of the developed Neural Network model was examined through model accuracy assessment techniques particularly Percentage Correct Match Metric (PCM) and urban growth dispersion metric. A comparison was carried between the actual land cover of 2011 and the simulated land cover of 2011, where the PCM estimate was 67.98%. The study findings show that the model predictive capability is sufficient to be used to forecast the future spatial urban growth. Thus, the proposed ANN Model results may be applied to urban planning practice and urban policy development.
Keywords: Artificial Neural Network, Informal Settlement, Geographical Information System, Remote Sensing, Urban Growth.
Urbanization trends in several less developed Nations have been occurring under the dictates of scarcity and evolution of informal settlements [1]. Urbanization would be an outcome of either a “push” from agricultural yield progression or a “pull” from industrial yield progression leading to “production cities,” through a combination of employees in tradable and non-tradable sectors [2]. According to [3],
“Urban growth is a result of a combination of manifold factors: geographical location, natural population growth, rural-to-urban migration, infrastructure development, national policies, corporate strategies, and other major political, social and economic forces, including globalization”.
The rapid increase in number of urban settlements has caused the invasion of public and private land by low income groups devoid of planning programs, depriving them of secure tenure and basic physical and social infrastructure. This often results into informal settlements, which is described differently based on the organization and lawful structure of the nation it presents. In this specific study, informal settlements are described as residential buildings fabricated on places without official planning consent [4] They are mostly branded by high population densities, limited or and low quality housing stock and deficiency of, or insufficient infrastructure and public facilities. Informal Settlement is observed in two ways, as a problem as well as an answer to accommodation requirements to the rapidly emerging cities of several less
ISSN 2348-1218 (print)
International Journal of Interdisciplinary Research and Innovations ISSN 2348-1226 (online) Vol. 8, Issue 2, pp: (108-115), Month: April - June 2020, Available at: www.researchpublish.com
developed countries [5], [6]. Tanzania is among the greatest promptly urbanizing less developed nations in the East Africa Region with a current yearly City inhabitants evolution rate of 2.8% [7]–[9]. The two main sources of informal settlements in Tanzania are rural-to-urban immigration and inadequate capability of local government authorities for City planning and development [9]
Dar es Salaam partakes a population of approximately 5 million that might reach above 5.6 million by 2025 and grow into one of the main metropolis in Tanzania as well as in East Africa if current trends carry on [7] The City‟s population has been rising at the speedy rate of around 8% per year, as an outcome of great movement from other places and a birth rate of around 4.5% per year. Above 70% of Dar es Salaam‟s five million inhabitants stay in informal, unplanned settlements within adequate infrastructure and facilities. Based on its population evolution rate, Dar es Salaam is among the fastest developing cities in Sub ‐Saharan Africa [10]. The rapid urban growth of Dar es Salaam is evidenced by the World Bank group [10] which states that;
“The City’s planning agencies have been unable to keep a pace with the rapid expansion of the City, largely fuelled by migrant growth. Most of the City’s population lives in unplanned settlements – many in abject poverty – which are characterized by substandard infrastructure and lack of basic municipal and other services. These communities face transportation constraints, insecure housing, and problems in accessing clean water, unhygienic sanitation provisions, and lack of awareness on hygienic sanitary practices. Climatic factors, e.g., heavy rainfall, work in conjunction with this situation to impose additional hardship and increase disease incidence”[11]
The need to develop new infrastructures and the maintenance of existing ones requires an understanding of the state of utilization pressure, which in turn requires an up-to-date understanding of the current area serviced by these infrastructures. Given the rate of urban growth, there are frequent changes in these serviced and un-serviced areas. These changes hinder the provision of up to date information about the existing situation using conventional methods such as field visits. The Dar es Salaam City growth surpasses the capacity of the City‟s local government authority for urban planning and development as a result of expansion of informal, unplanned settlements with inadequate infrastructure and services. Moreover, the authority lacks adequate understanding on the trend of the rapid urban spatial growth timely, as a result of little understanding of the rate and extent of the spatial growth. Therefore, the causes and dynamics of urban growth across space and time in Dares Salaam need to be studied so as to provide planning authorities with urban growth models enabling them to precisely understand the current status and forecast urban growth patterns.
A model is usually considered to be a simple representation of reality [12] and theoretical abstraction representing systems in a manner where essential features crucial to the theory and its application are identified and highlighted [13] Computer programs or software such as Excel spread sheets, GIS and simulation software are used to create models. The tools utilization practise with respect to proper theoretical foundation during urban spatial change or growth simulation is denoted as urban modelling. Models of Cities and ecologies as complex systems with geographic properties, normally involve spatial and temporal processes, and are cumbersome to be carried inside proprietary GIS. In the context of general understanding of modelling urban growth with respect to the methods of complexity and non-linearity, models can be classified as Fractal modelling, Spatial Regression modelling, Agent Based modelling, Cellular Automata modelling and Neural network modelling [14]. This is subject to the data availability, application, and purpose. Artificial Neural Network makes use of the knowledge of biological networks in complex problem solving. The biological systems has information processing capabilities such as nonlinearity, high parallelism, robustness, fault and failure tolerance, learning, ability to handle imprecise and fuzzy information, and their capability to generalize [15]. Neural networks are mathematical models which simulate parallel information handling features of biological systems made up of several simple elements called neurons. The information representation is founded on the pattern of connections among neurons of the network. Standard neural networks are structured as a set of layers consecutively processing a set of inputs. Moreover, the neural networks induction capacity is one of its unique aspects [16] Artificial Neural Networks (ANNs) can reveal advantages against traditional techniques once realized to systems that may be poorly determined and understood and to circumstances where input data are inadequate or vague in nature. Moreover, in contrast to the other frequently used techniques, neural networks particularly do not depend to any functional relationships, do not take assumptions about the data distributional properties, or a priori understanding of variable relationships. Such independence makes ANNs a potentially powerful modelling tool for exploring complex, nonlinear problems [17]. Cities dynamics are reflected as complex adaptive system which reveal non-linearity and discontinuities and mostly or
ISSN 2348-1218 (print)
International Journal of Interdisciplinary Research and Innovations ISSN 2348-1226 (online) Vol. 8, Issue 2, pp: (108-115), Month: April - June 2020, Available at: www.researchpublish.com
commonly are out of equilibrium justifying the need for Artificial Neural Network application. Due to the possibility of learning, Artificial Neural network is an appropriate tool for land use change modelling [18]. However, several researchers have pointed out the difficulties in determining an appropriate network architectures, basically the number of hidden nodes [19]
The urban growth factor maps like distance from major roads, distance from minor roads, distance from built-up areas, distance from City Centre, slope and aspect, were prepared through the use of GIS. A Geodatabase was developed to handle all spatial data of the study area for modelling purposes. Landsat ETM+ and TM images of 2000 and 2011 were used in this study, all closely corresponding to the Tanzania National Censuses, 2002 and 2012. Vector data of the study area from different sources were prepared. This include Dar-es-salaam City boundary, Dar-es-salaam City ward map, Dar-es-salaam Transportation Network and Water bodies. The raster data were prepared based on the vector data mentioned and the cell size was taken to be the spatial resolution of the Landsat image that is 30m. Training samples were identified visually, with visual interpretation being aided by Quick bird images and Topographical maps. Respectively, four land cover classes were identified according to Anderson level one land use/land cover classification system[20]
ISSN 2348-1218 (print)
International Journal of Interdisciplinary Research and Innovations ISSN 2348-1226 (online) Vol. 8, Issue 2, pp: (108-115), Month: April - June 2020, Available at: www.researchpublish.com
The identified classes were forestland, bare-land, grassland and built-up land which includes the settlements, industrial and commercial areas. From these classes the training samples were defined, where class signatures were created for each class. Class signatures accuracy was assessed to have good class separability where the Transformed Divergence (TD) algorithm [21] was adopted because it is considered to be more powerful algorithm compared to other algorithms. The methodology is summarised in figure 1
For the year 2000, minimum separability was estimated at 1980.11 and the average was 1996.68, whereas for year 2011 minimum separability was estimated at 1969.13 and the average was 1994.86. Since class separability was acceptable the actual classification was carried to identify relevant classes in the study area [22]. The land cover patterns were analysed to determine the rate of Land cover change. Landsat Satellite images of 2000 and 2011 years that closely corresponds to the National Censuses of 2002 and 2012 were analysed to generate Land use/cover of the study area with a band combination of 3, 4, 1 [23]. The classification was carried through a supervised approach for Landsat images of years 2000 and 2011, where classes‟ signatures were carried through image visual interpretation and by the support of a Quick bird image of 0.6m resolution and topographical map.
The algorithm used for classification was parametric maximum likelihood. The overall accuracy obtained for land cover classification accuracy assessment for year 2000 was 78.57% and that of 2011 was 85.71%. Change detection analysis was conducted to determine the development which occurred in the built-up areas.
For developing urban growth simulation model an Artificial Neural network method was used. Remote sensing images were used to calibrate a prediction model as a temporal datasets through Land use/Land cover mapping as well as change
ISSN 2348-1218 (print)
International Journal of Interdisciplinary Research and Innovations ISSN 2348-1226 (online) Vol. 8, Issue 2, pp: (108-115), Month: April - June 2020, Available at: www.researchpublish.com
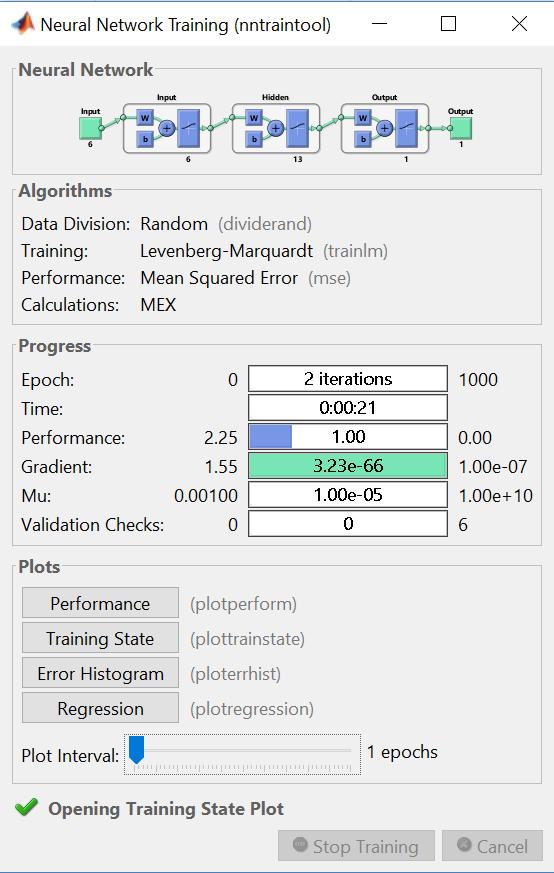
detection from years 2000 to 2011. Finally, the developed model was validated using historical data to investigate it‟s validity for the study area, through spatial metric methods. The Back propagation training rule was used through a Levenberg Marquardt algorithm (Figure 2). The algorithm was chosen after initial trials of several algorithms and found to have satisfactory convergence. A Neural network architecture was designed and a training dataset was prepared for a neural network to have a sound predictive capability [24]
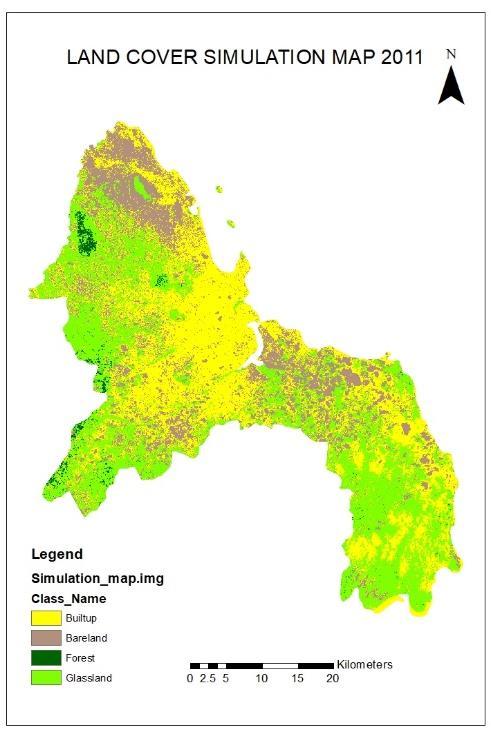
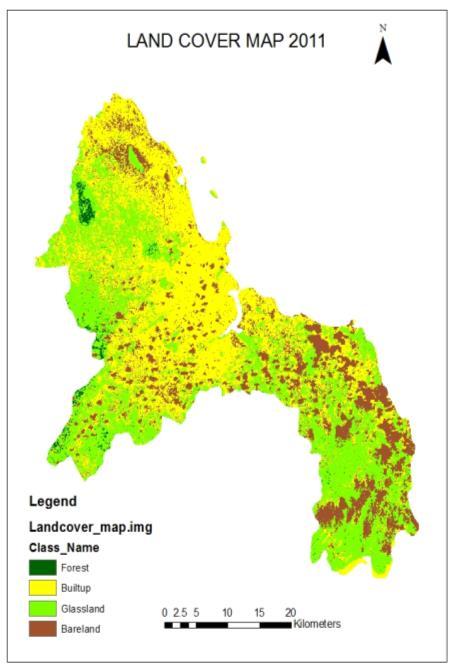
The model predicted cells to transition to built-up (Figure 4) were compared with the actual transition cells within the same study period (Figure 3). The Percent area match = (Number of cells predicted to change)*100/ (number of cells actually transitioned). The Percent Correct Match (PCM) metric was used during model performance evaluation by comparing the area predicted to change by the model to that which actually changed. The calibrated ANN model was used to simulate the spatial urban growth of year 2011. The accuracy assessment was carried based on the actual spatial growth from year 2000 to 2011 and the simulation result of year 2011. The PCM obtained was 67.98% implying that the model underestimates the spatial urban growth. In this case it seems that, the number of built-up cells predicted to transition through the developed ANN model were less compared to the number of built-up cells which actually undergone transition from years 2000 to 2011.
The Shannon‟s entropy was used to determine whether the City spatial growth was contained or sprawled, and the GIS was used to demarcate the buffer zones for both City Centre as well as along the roads. The buffer zone sizes were taken to be 300m representing 10 pixels as the spatial raster resolution which was assigned a value of 30m for the model in the study area. For the City Centre 50 zones were buffered and for the roads 25 zones were buffered representing most of the urban spatial growth. The Entropy value range for the City Centre was 0-ln(50), giving a value of 0 - 3.912023005. The Entropy value range for the roads was 0-ln(25) giving a value of 0 -3.2188758248682.
ISSN 2348-1218 (print)
International Journal of Interdisciplinary Research and Innovations ISSN 2348-1226 (online) Vol. 8, Issue 2, pp: (108-115), Month: April - June 2020, Available at: www.researchpublish.com
Through visual interpretation and Shannon‟s entropy calculations (Table 1) it can be noticed that the City distribution was more compact at the City Centre in the year 2000 as compared to 2011since the entropy decreased by 0.96% from year 2000 to 2011 where as for the ANN model an entropy decreased by 0.25%. The entropy along roads increased by 0.40% where as for the ANN model 9.63% showing that the built-up was more compact to the City Centre in 2000 compared to the roads where the built-up sprawled along the roads. But in 2011 the built-up sprawled from City Centre compared to the roads where it was compact. The PCM obtained was 67.98% while the dispersion metric, Shannon‟s entropy obtained shows an ANN model error of 0.71% and 9.6% obtained from the City centre and along the road respectively.
The spatial urban growth factors which suit Dar es Salaam environment were identified since cities are systems and every system is unique and complex in nature. The identified factors proved to be more influential in spatial urban development of Dar es Salaam study area similar to other studies [25], [26]. Based on Shannon‟s entropy, distance from the built-up area, Slope and Aspect factors were less influential compared to that of Distance from a cell of interest to roads and Distance from the cell to the City Centre factors. The model results are similar to other models where roads have more impact on the spatial urban growth as compared to the City Centre [27]. Distance from the City Centre and built-up areas seemed to be less influential due to the fact that large open land for settlement development are available at the City peripheral than near the City Centre and built-up areas where there is no or less settlement development. At the City peripheral land is affordable to majority for settlement development as it is relatively cheap compared to the land located proximal to the City Centre and Built-up areas. Roads seemed to be more influential because majority who afford to acquire land at City peripheral have frequent movement to the City Centre for social-economic needs. They consider accessibility as major factor to look at on deciding to where they acquire land and develop settlements. Slope and aspect are less influential as they are not much considered during site selection for settlement development. So planners need to put more consideration on population density along the roads as they have more impact on spatial urban growth.
The Land Use Land Cover (LULC) change detection was carried in Dar es Salaam study area by comparing the classified satellite images of years 2000 and 2011. From 2000-2011 study period, the classes‟ size change shows that Forest class gained about 9000ha. This increase may be a result of the restriction of human activities in the forest. Whereas grassland loss was more than 54000ha, likewise Built-up gained less than 45000ha of an area. The observed high losses in grassland and higher gain in Built-up classes suggests that the population increase is highly dependent on human activities. The presented results implies that the spatial urban growth has been taking place in Dar es Salaam where people find it possible to settle as there is open land available for settlement development.
A Geodatabase was developed to facilitate the modelling process by providing spatial data like the land use/cover maps, road network, slope variables and other spatial factors. ANN framework was utilised for spatial urban growth modelling. This model has shown promising results in Dar es Salaam City with limited data availability as a complex and non-liner phenomenon which was not well understood previously. As from other similar studies[26], the most significant factors were identified in this study where these were actually the most influential factors, the proximity characteristics to roads and neighbourhood characteristics for the City centre. The comparison of the actual and the simulated spatial urban growth by ANN model showed satisfactory correlation in terms of PCM and Shannon‟s entropy [28][29]
Artificial Neural Networks (ANN) urban growth prediction Model (UGM) was designed and developed. This was accomplished through the integration of two main tools, the GIS which was used to determine spatial urban growth factors, and the Remote Sensing tool which provided temporal dataset for model calibration and validation and Artificial Neural Networks which was used to design and develop a model framework. The urban growth from 2000 to 2011were mostly along the periphery of the City, especially towards the south and west-ward directions as compared to other directions, where an un-built-up land existed to be converted to built-up land. According to slope, aspect and hill shade show that there is high elevation towards north and North West directions which hinder the urban growth towards these directions as compared to south west direction.
The accuracy assessment results obtained were PCM 67.98%, and dispersion metric errors were 0.71% from City Centre and 9.6% along the roads respectively. According to [27]–[29], the results implies that, the designed and developed Artificial Neural Network model framework provide a robust modelling for Dar es Salaam spatial urban growth between
ISSN 2348-1218 (print)
International Journal of Interdisciplinary Research and Innovations ISSN 2348-1226 (online) Vol. 8, Issue 2, pp: (108-115), Month: April - June 2020, Available at: www.researchpublish.com
2000 and 2011. Due to the capability of the model to determine the parameters through training and its ability to simulate spatial urban growth, it can be used for further predictions of spatial urban growth unlike other conventional methods. The model requires less knowledge in parameterization and calibration, it is simple and capable of producing complex and nonlinear patterns of urban systems. Dar es Salaam City has sprawling growth away from the City Centre and compact growth along roads. The distribution metric of 0.96% decrease for the City Centre evidence the City sprawling away from the City Centre contrary to the increase of 0.40% for the roads shows that the City is compact along roads as evidenced in the results.
[1] J. M. Lupala, „Urban Types in Rapidly Urbanising Cities. Analysis of Formal and Informal settlements in Dar es Salaam , Tanzania‟, Royal Institute of Technology, 2002.
[2] Freire et al., „Africa ‟ s Urbanization : Challenges and Opportunities‟, Work. Pap. Number 7, pp. 1–27, 2014.
[3] UN-Habitat, „The challenge of slums: global report on human settlements 2003‟, Manag. Environ. Qual. An Int. J., vol. 15, no. 3, pp. 337–338, 2004.
[4] M. Ali and M. Sulaiman, „The causes and consequences of the informal settlements in Zanzibar‟, Shap. Chang. XXIII FIG Congr. …, pp. 1–15, 2006.
[5] H. Srinivas, „Defining Squatter Settlements‟, no. April, pp. 1–7, 2013.
[6] M. P. Todaro, „New Social Indicators as Alternative Measures of Development : The Physical Quality of Life and Human Development Indexes Rationale and initial Measurement Attempts‟, Econ. Dev., 1994.
[7] A. Agwanda and H. Amani, „Population Growth, Structure and Momentum in Tanzania‟, no. 7, p. 84, 2014.
[8] Kida et al., Tanzania Human Development Report 2014 Economic Transformation for Human Development Tanzania Human Development Report 2014. Economic and Social Research Foundation 51 Uporoto Street (Off Ali Hassan Mwinyi Road), Ursino Estates P.O Box 31226, Dar es Salaam, Tanzania, 2014.
[9] URT, „United Republic of Tanzania Formalisation of Informal Urban Settlements in Tanzania Mkurabita Innovations‟, no. August, 2012.
[10] J. L. Baker, „Climate change, Disaster Risk and the Urban poor: Cities Building resilience for a changing world. Dar es Salaam Case Study Overview.‟, Urban Dev. Ser., no. 68358, pp. 1–14, 2012.
[11] PAN-AFRICA, „Urban Poverty & Climate Change in Dar es Salaam, Tanzania: A case study‟, p. 129, 2011.
[12] R. N. Giere, „How Models Are Used to Represent Reality‟, vol. 71, no. December, pp. 742–752, 2004.
[13] M. Batty, „Urban Modeling‟, Int. Encycl. Hum. Geogr., pp. 51–58, 2009.
[14] J. Cheng, „Modelling Spatial & Temporal Urban Growth‟, 2003.
[15] I. A. Basheer and M. Hajmeer, „Artificial neural networks : fundamentals , computing , design , and application‟, vol. 43, pp. 3–31, 2000.
[16] J. Rodrigue, „Parallel Distributed Processing of Transportation/Land Use Systems: Theory and Modelling with Neural Networks‟, Transp. Res. C, pp. 1–19, 1997.
[17] J. D. Olden and D. a. Jackson, „Fish–Habitat Relationships in Lakes: Gaining Predictive and Explanatory Insight by Using Artificial Neural Networks‟, Trans. Am. Fish. Soc., vol. 130, no. 5, pp. 878–897, 2001.
[18] Mohammady and M. R. Delavar, „A Spatio-Temporal Urban Growth Modelling . Case Study : Tehran Metropolis‟, vol. 8, no. 1, p. 21, 2014.
[19] C. Weisner and D. Cowen, „Modeling urban dynamics with artificial neural networks and GIS‟, ACSM/ASPRS Annu. Conv. …, pp. 66–75, 1997.
[20] Anderson et al., „A Land Use And Land Cover Classification System For Use With Remote Sensor Data‟, vol. 2001, 1976.
ISSN 2348-1218 (print)
International Journal of Interdisciplinary Research and Innovations ISSN 2348-1226 (online) Vol. 8, Issue 2, pp: (108-115), Month: April - June 2020, Available at: www.researchpublish.com
[21] Intergraph Corporation, ERDAS Field Guide TM Security, Government and Infrastructure., no. October. Huntsville, United States of America, 2013.
[22] W. H. Bakker, K. A. Grabmaier, G. C. Huurneman, F. D. van der Meer, A. Prakash, K. Tempfl, A. S. M. Gieske, C. A. Hecker, L. L. F. Janssen, G. N. Parodi, C. V. Reeves, M. J. C.Weir, B. G. H. Gorte, J. A. Horn, N. Kerle, C. Pohl, F. J. van Ruitenbeek, and T. Woldai, Principles of Remote Sensing, Third edit. The International Institute for GeoInformation Science and Earth Observation (ITC), Hengelosestraat 99, P.O. Box 6, 7500 AA Enschede, The Netherlands, 2004.
[23] E. Westinga and W. Bakx, „Digital Image Classification‟, no. September, Enschede: ITC, 2008.
[24] MathWorks, „Work Flow for Neural Network Design‟, 2018. [Online]. Available: https://www.mathworks.com/ help/nnet/ug/workflow-for-neural-network-design.html.
[25] Buchta et al., „Modeling Urban Growth Spatial Dynamics : Case studies of Addis Ababa and Dar es Salaam‟, vol. 15, p. 3930, 2013.
[26] F. K. Abebe, „Modelling Informal Settelment Growth in Dar es Salaam, Tanzania‟, University of Twente, 2011.
[27] L. R. . Jitendrudu, „Modelling Dynamics of Urban Spatial Growth Using Remote Sensing and Geographical Information System‟, Andhra University, 2005.
[28] Olmedo et al., „Comparison of simulation models in terms of quantity and allocation of land change‟, Environ. Model. Softw., p. 9, 2017.
[29] Pontius Jr et al., „Comparing the input , output , and validation maps for several models of land change‟, Ann. Reg. Sci., no. May 2016, pp. 10–37, 2008.