International Journal of Civil and Structural Engineering Research ISSN 2348-7607 (Online) Vol. 8, Issue 1, pp: (105-116), Month: April 2020 - September 2020, Available at: www.researchpublish.com
Integration of Design Optimality and Design Quality of RC buildings from the perspective of Value Engineering
Ayman Abd-Elhamed1,2 , Haytham Essam Amin2 ,Ahmed Mohamed Abdelalim3
1Faculty of Engineering at Mataria, Helwan University, Cairo, Egypt.
2Faculty of Engineering & Technology, Egyptian Chinese University Email: aymanm79@hotmail.com Email: Haytham.essam95@gmail.com
3Associate Professor of Construction Management, Faculty of Engineering at Mataria, Helwan University. Email: Dr.Ahmedabdelalim@m-eng.helwan.edu.eg
Abstract: Design Optimality of RC Buildings “that merges the perspective of design and construction” is a goal for each designer. This paper aims to compare between different structural systems that are commonly used as Lateral Force-Resisting Systems (LFRS) and choose the optimum structural system for each height and aspect ratio under the action of gravity and earthquake loads from the perspective of value engineering. This paper proposes three different feasible solutions for the selection of the LFRS and quantifies the impact of these selections on seismic performance and quality. The systems considered are: Rigid Frame, Core and Shear Wall and Tube in Tube. Moreover, applying value engineering approach on the solutions by considering two parameters: the design optimality index and design quality index The design phase is considered one of the most important phases in the life cycle of a project. The coordination between designer and construction team should be insured to increase the building quality. So, improving the design phase by considering design quality to remain the project performance as well as time and cost saving. In this study, linear dynamic analyses of ten, twenty and thirty-story RC structures, which are primarily designed according to UBC 97, are performed. The results of the numerical simulations of dynamic linear responses were presented. Also results of design quality index were indicated. The recommendations for chosen the optimum structural system were based on the structure performance, maximum story drift, maximum displacement, and design quality indicators.
Keywords: Design Optimality; Design Quality; Design Quality Indicator; Tall buildings; structural systems.
I. INTRODUCTION
Integration of different knowledge areas in construction is the effective way to have the optimum structural system and reaching optimum solutions for execution during construction. Choosing the structural system is essential stage that defines all the project. As known, the best time to implement the value engineering should be considered from preliminary design, because of the cost of design is the lowest for the whole project stages but it‟s impact in the construction is very large, and it will effect on raising the quality of all works besides decreasing the cost and time for the construction stage.
Value Engineering (VE) is an organized approach used to analyse the function of systems, equipment, facilities, and supplies for achieving their essential functions at the lowest life cycle cost consistent with required performance, quality, and safety [1,2]. The implementation of the VE process increases the project performance, quality, safety, durability, and effectiveness. It is essential that the design should satisfy specific code requirements such as the Uniform Building Code or any local building regulations.
International Journal of Civil and Structural Engineering Research ISSN 2348-7607 (Online)
Vol. 8, Issue 1, pp: (105-116), Month: April 2020 - September 2020, Available at: www.researchpublish.com
Value linked between the actual cost and the worth as shown in Eq.(1), Where Actual cost is the actual total cost of the items of a certain system and Worth (the deserved cost) is the lowest cost to perform the functions in the most elementary manner feasible.
= f ( . . . . . . . . . . . . . Eq. (1)
Value is an optimization process between the function and the cost. Value Approaches are divided into three approaches as in Fig.1. [2]: Ideal Approach, Accepted approach, and Negotiable approach. a) Ideal Approach: is to increase the function while decreasing the cost, so it is the best approach. b) Accepted Approach: is to increase the function while the cost remains constant or decreasing the cost while the function is constant. C) Negotiable Approach: is to increase the function while slightly increase in the cost or decreasing the cost while slightly decrease in the function.
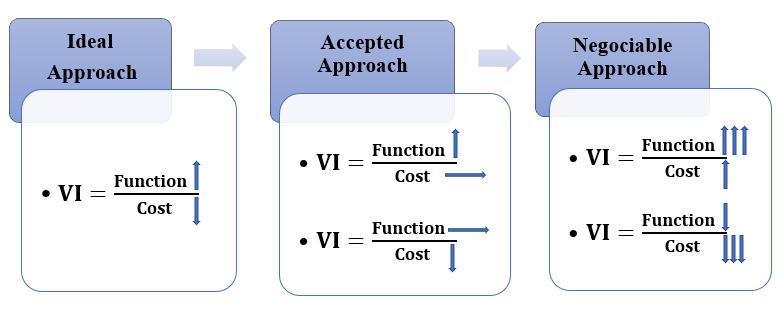
Fig.1. Value Approaches
Trying to reach the Optimum structural design system for a project is very difficult because of having many variables and parameters that must be considered in this decision. So, the research focuses on the relation between design optimality and design quality only. Also explain how to manage it by using Design quality indicator and recognizes the benefit of major concepts which provide the maximum chance to implement a high-quality project on time and at agreed cost
For design optimality in tall buildings, many structural systems can be chosen by designer [3-5]. Many Comparisons were made between different types of tall buildings structural systems for specific heights and under the wind load [6], Both parameters were investigated according to the optimum performance for a specific height or number of stories only.
In the research, Choosing three common RC structural systems namely: Rigid frame system, tubular system, and core and shear wall system, with 10, 20, and 30 stories, with different aspect ratio (L/B) 1, 1.67, and 2
Design quality is also a primary factor for comparison between the buildings structural design. As, good design is essential for achieving value for money in construction and provides evidences that make work better. it is not about completing buildings on time and within budget only; it is also concerned with ensuring that the costs of operating buildings over their lifetime are optimized and that people who work in buildings gain real value from them. Bad design can severely interrupt the functionality of a building and in extreme cases curtail its useful life.
The quality of a building is related to its architecture to improve the quality of its design and meet the requirements and expectations of its owner or users [7,8]. Design quality is an entity 's overall characteristics (product and service), which satisfy customer needs. Design is used as an indicator for measuring performance, conformance, and service quality [9]. Measuring design quality at different project stages (briefing, design, pre-occupation, and in-use) is useful for setting design priorities, assessing how well the design meets the project goals, and seeing how the building is performing [10]. The actual results relating to the building's design quality will be known after many years of operation [11].
Each project is unique and has its different set of requirements and limitations, a set of cultural, technological, and environmental aspects to be considered. So, each project creates its own set of targets and challenges, opportunities and combination of design stakeholders, the most important stakeholders in every project are: (a)Clients (inhibitor of scope of a project), (b)Community concerns & surrounding context, (c)Site, (d)Cost of building technology implemented, [9].
International Journal of Civil and Structural Engineering Research ISSN 2348-7607 (Online) Vol. 8, Issue 1, pp: (105-116), Month: April 2020 - September 2020, Available at: www.researchpublish.com
The Construction Industry Council (CIC) in the UK has developed a Design Quality Indicator (DQI) [11,12], it has successfully been used in the UK construction industry since it was launched in 2002. Design quality is a combination of function (how effective the facility achieves its objective); impact (how well the facility helps to create a sense of site); and building quality (completed facility performance) [13-15]. Thirty-two (32) indicators used to measure the quality of design for different types of buildings such as residential and hospital, as suggested in previous (from year1996 to 2014) [10,12].
This research aims to focus on the following objectives: a) Recommending a structural system for a certain building height, with the intention of limiting the story drift to acceptable limits and with a high Design quality index B) Comparing between the most common structural Systems chosen using linear analysis. C) Applying Design quality indicator tool for comparing between structural models. and D) Identify the factors that influencing of the design process.
II. RESEARCHING METHODOLOGY
The structures should possess main attributes to accomplish a satisfactory performance during their lifetime. So, selection of the structural system plays a critical role in the design stage. The decision on the conceptual design criteria will influence the building capability for resisting unpredictable hazards. Moreover, the achievement of structural system for tall buildings is a hard task. Whereas building height increases the importance of lateral loads action rises in an accelerating rate. In high rise structures, the structure is greatly influenced by the type of lateral system provided and the selection of appropriate lateral structural system plays an important role in the response of the structure. In addition, the selection is dependent on many factors such as structural building of the system, economic, feasibility, and availability of materials.
There are two types of lateral loads, wind loads and seismic loads. The design is distinctly different for wind forces and earthquake effects. The building undergoes a pressure on its exposed surface in wind design; this is force-type loading. However, in the design of the earthquake, the building is subjected to random ground movement at its base, which induces inertia in the building, which in turn causes stress. From all the loading effects, e.g., dead loads, live loads, wind loads and blast loads, earthquake is the critical load as it makes displacement under the building, which is time varying. The building should be able to resist this imposed deformation with damage under the shaking of small intensity, and without collapse under the shaking of high intensity. The building must have a large capacity for inelastic deformation and must have the strength in all its members to sustain the forces and moments induced in them.
Applying Value engineering technique “Weighted evaluation Matrix “, which is an organized approach that will assist customers in making the best decision [16]. The methodology of weighted evaluation can be a very useful tool to demonstrate all criteria and alternatives were considered. It enables us to give more consideration to necessary facets of the decision. So, the solution becomes a systematic selection rather than a random decision-making process.
III. STRUCTURAL SYSTEMS DESCRIPTION
The proceeding section contains detailed descriptions of the various structural systems and building models that have been incorporated in the analysis. In order to achieve the aforementioned objectives, Three buildings with 10, 20, and 30 stories in which seismic loads are fully resisted by different reinforced concrete systems, namely Rigid Frame, Core and Shear Wall and Tube in Tube system, with different aspect ratio ( L/B) , 1, 1.67, and 2, are designed according to Egyptian code of practice ECP-201,2017. The typical story height is 3 m for each model and the columns are assumed to be fixed.
1)Rigid Frame System:
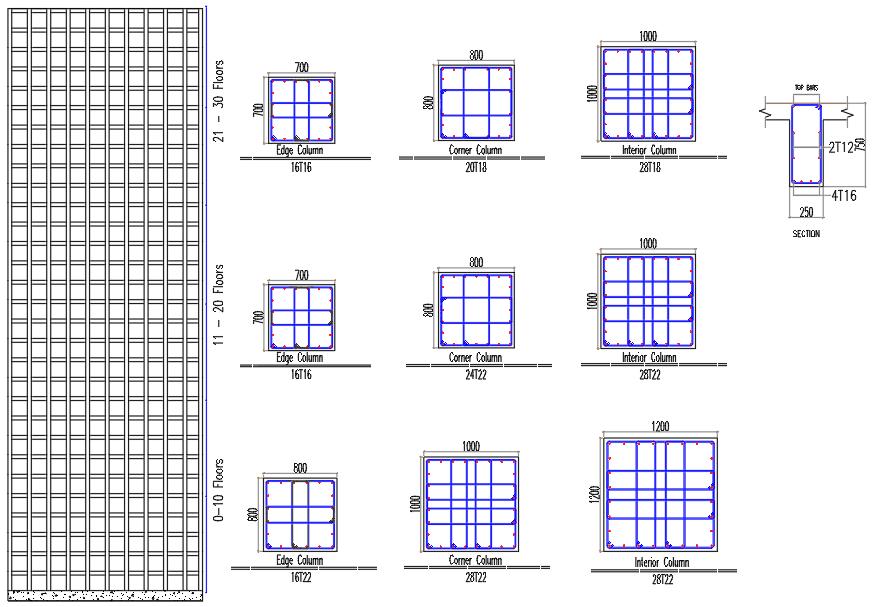
A rigid frame is an unbraced frame that is resisting both vertical and lateral loads by the bending of beams and columns in which columns and girders connected by rigid joints. Joints must have enough rigidity to resist lateral and gravity loads. It is used in reinforced concrete buildings because the inherent joints rigidity. In modelling the Rigid Frame models chosen solid slab of thickness 14 cm and Beam section 40x70 with reinforcement (4 T 16), While the columns cross sections represented in Fig.2. For each height.
International Journal of Civil and Structural Engineering Research ISSN 2348-7607 (Online) Vol. 8, Issue 1, pp: (105-116), Month: April 2020 - September 2020, Available at: www.researchpublish.com
Fig.2. Rigid Frame system building descrition of columns and beams for each height in the study
2)Tubular System:
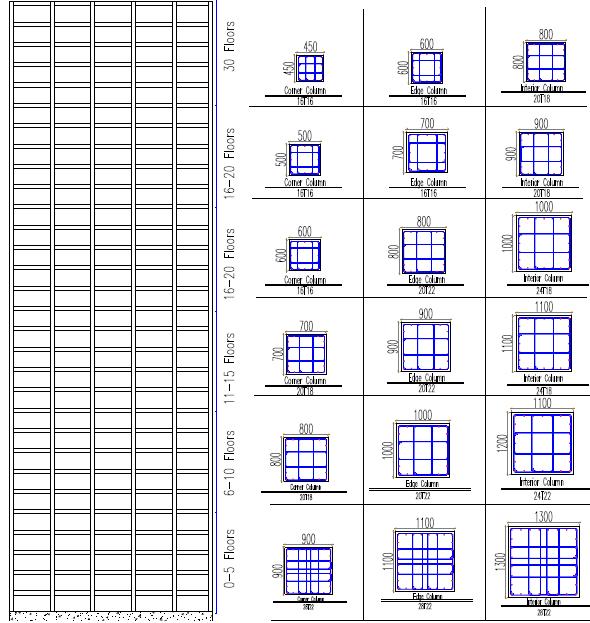
It consists of closely spaced columns and deep girders to tie the columns around the perimeter of the building. The floor diaphragm connecting the exterior and interior tubes. Floor slabs acts as a rigid diaphragm, distribute the lateral loads to the interior and exterior tubes considering their stiffness. Frames parallel to the lateral loads act as webs (resisting shear), while the frames normal to the loads act as the flanges (resisting bending).In modelling the Tubular models chosen Flat slab of thickness 18 cm and Beam section 25x75 with reinforcement (4 T 16), While the columns cross sections represented in Fig.3. for each height.
Fig.3. Tubular system building descrition of columns and beams for each height in the study
International Journal of Civil and Structural Engineering Research ISSN 2348-7607 (Online) Vol. 8, Issue 1, pp: (105-116), Month: April 2020 - September 2020, Available at: www.researchpublish.com
3)Core and Shear wall
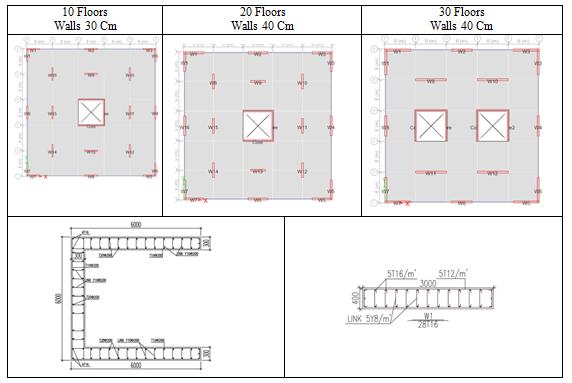
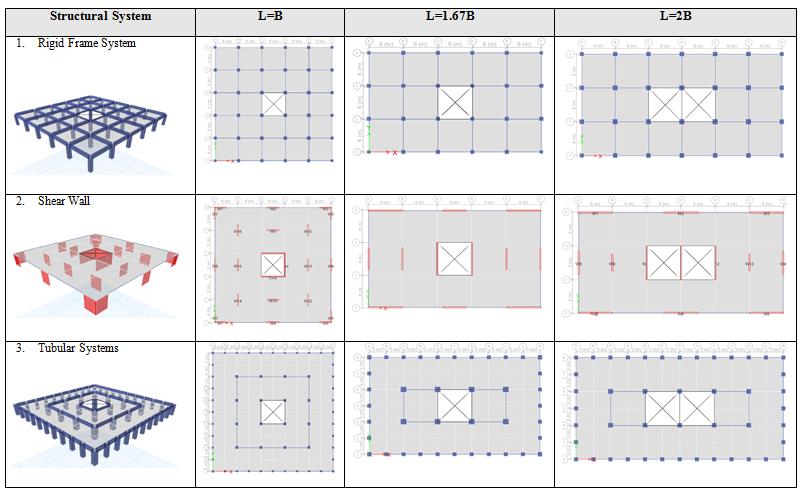
It is a vertical continuous stiffening element, that deform in bending mode. This system consists of reinforced concrete core and shear walls. Shear walls act as vertical cantilevers when responding to lateral loads, its response depends on the interaction between the horizontal floor and the vertical wall. in supertall buildings it is difficult to control the lateral drift at the building top. In modelling the core and shear wall models chosen Hollow block slab and Beam section 30x90 with reinforcement (4 T 16), sample of walls cross sections represented in table 1.
TABLE 1. Building description of core and shear wall system
IV. CHARACTERISTICS OF STRUCTURAL MODELS AND LOADS
Material properties
The concrete used for analysis and design having a compressive strength of 25 MPa after 28-days, and a high-grade steel yield strength 360 MPa. The specific weight of reinforcement concrete is taken as 25 kN/m3, modulus of elasticity is determined using ECP-201, 2017. The elastic modulus of steel is taken as 210 KN/mm2. Poisson‟s ratios υ of concrete and steel are taken equal to 0.2 and 0.3, respectively [17]
Section properties and reinforcement details
For the analysis procedures, ssupporting bases of all structural models are fixed supports. The structural elements have been designed according to Egyptian code of practice ECP-201. The cross sections of the columns are reduced every 5 stories towards the roof of the building, which is a common construction practice. The selected reinforcement ratios for the beams are within the range allowed, where the maximum and the minimum reinforcement ratios are 1.25% and 0.3% respectively (ECP-201, 2017). For the nonductile columns, steel reinforcement ratios have been chosen to satisfy the Egyptian code requirements in which the range allowed for maximum and minimum percentage of steel reinforcement are 4.0% and 0.8% respectively [28]
Gravity and lateral loads
The loads that act on the RC building are categorized as gravity loads, which include dead and live loads, and lateral loads. Dead load is taken as 1.5 kN/m², the building weight and the weight of flooring cover is considered in the dead load and calculated based on material densities by the program. While live load value for residential RC building is taken as 2 kN/m². Moreover, seismic loads will be developed according to Uniform Building Code (UBC 97). Only the primary
International Journal of Civil and Structural Engineering Research ISSN 2348-7607 (Online) Vol. 8, Issue 1, pp: (105-116), Month: April 2020 - September 2020, Available at: www.researchpublish.com
structural components are assumed to participate in the overall behaviour. It is assumed that the effects of the secondary structural components and non-structural components are negligible; these include staircases, partitions, cladding and openings.
The seismic design has been done with assumption of: Soil class „C‟ as per referring to dense/stiff soil; Importance factor is equal to 1.0; Seismic zone factor = 0.15g, and the shape of the spectrum is as per UBC 97. For Response Spectrum Method, Square Root of Sum of Squares (SSRS) is used as Directional Combination Method, complete quadratic combination (CQC) for Modal Combination Method. Response Function factors Ca = 0.18 and Cv = 0.25 is considered according to UBC 97 classification for soil class „C‟, Use Ritz vector and number of mode shape to achieve more than 90% from mass participation as response spectra condition, Damping ratio = 5% as for RC moment resisting frame building. The effect of cracking in reinforced concrete members due to flexural tensile stresses is represented by reducing moment of inertia, as mentioned in (UBC 97).
TABLE 2. Plans for the structural systems with different aspect ratio
V. RESPONSE ANALYSIS AND DISCUSSIONS
Comparison of the maximum roof displacement for different systems (Frame, Tubular, Core) having different no. of floors with the same rectangularity ratio a) L=B, b) L=1.67B and c) L=2B respectively.
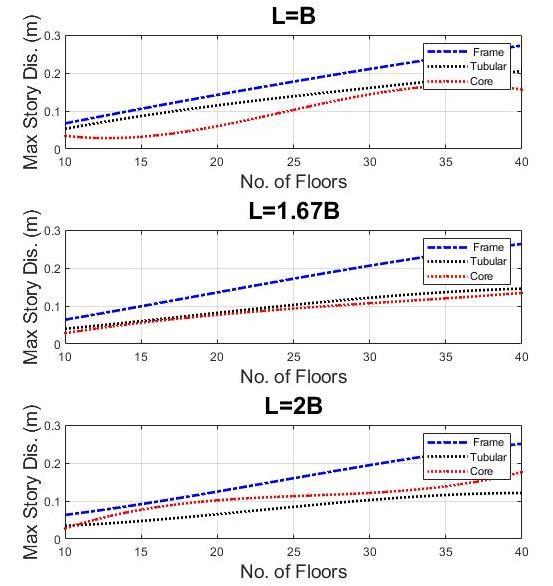
Fig.4. Comparison of the maximum roof displacement for different systems (Frame, Tubular, Core) having different no. of floors with the same rectangularity ratio a) L=B, b) L=1.67B and c) L=2B respectively.
International Journal of Civil and Structural Engineering Research ISSN 2348-7607 (Online) Vol. 8, Issue 1, pp: (105-116), Month: April 2020 - September 2020, Available at: www.researchpublish.com
Displacement profile is directly correlated with the distribution of inelastic behaviour of a structure. Moreover, such quantity is an indicator for inter story drift ratios. Displacement must be limited during earthquakes, so it is important to provide adequate stiffness. The height-wise distribution of the lateral displacements from the nonlinear response analysis of the selected models are plotted in Fig.4 for different numbers of floors ranged from 10 to 40 floor. In order to investigate the effect of structural system as well as the influence of aspect ratio on the variation of stories displacement along the height of the building models subjected to earthquake loading, numerical simulations for the three different models in terms of rigid frame system, tube system and Shear Wall system have been carried out for X-directions. It may be noted that the story displacement increases as the resisting system type changes from stiff, shear wall system, to flexible, rigid frame system and tube system. The increase in lateral story displacements are occurring due to the overall reduction in the global transverse stiffness resulting from the absence of shear wall which improve the structure's resistance to lateral loads. The effects of resisting system are more evident between rigid frame system and two other models. Moreover, the results indicate that the displacement demand of the building models is not altered by the building aspect ratio variations, although it is highly affected by the system type.
Fig.5. Comparison of the maximum lateral story drift for different systems (Frame, Tubular, Core) having different no. of floors with the same rectangularity ratio a) L=B, b) L=1.67B and c) L=2B, respectively.
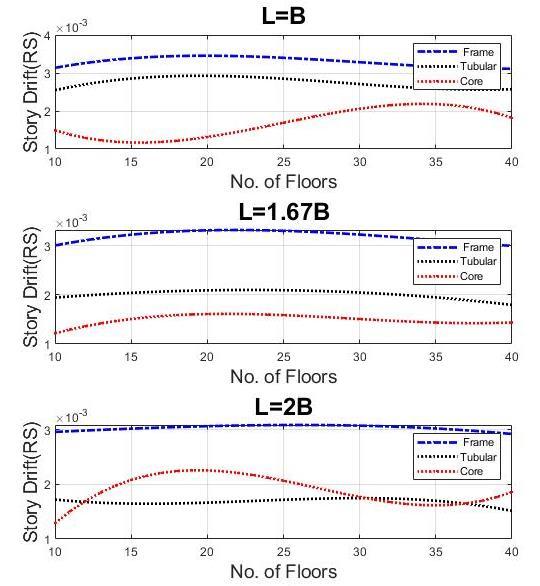
Lateral drift (LD) is one of the most influential demand parameters of structural performance LD is defined as the relative drift between two consecutive stories. It also indicates the damage concentrated in a relatively weaker story. In displacement-based method, the LD is considered as an important indicator to evaluate the seismic performance of existing structures. Additionally, it is also a key response quantity in force-based seismic design strategy for the marginal satisfaction of serviceability limits for new structures. The non-structural damage depends on attained maximum drift generated by earthquakes. Therefore, this parameter must not exceed the appropriate limits to reduce the seismic vulnerabilities of non-structural components such as cladding, ceiling, non-load bearing partitions and pipework.
The average response quantities of drift profiles obtained from nonlinear response analyses considered in this study are illustrated in Fig.5. The maximum inter story drift ratio are influenced by the lateral drifts for the building, thus these ratios tend to reduce when the lateral stiffness of building models is adopted. It can be seen from the figure that the variation in peak drifts for frame and tube system (flexible and lighter one) is insignificant and show almost constant values for all no. of floors. However, with respect to the core building model, the variation in the no. of floors is highly significant especially at lower stories where a high difference is observed between the plotted curves.
It has been found from the figure: at (L=B) Story displacement and story drift values of Frame system bigger than Tubular system bigger than Core and shear wall system, due to the flexibility of system.
As increasing the Aspect ratio (L/B) the same attuite of the systems and also the story displacement and story drift values be nearer between the tubular system and core system.
International Journal of Civil and Structural Engineering Research ISSN 2348-7607 (Online) Vol. 8, Issue 1, pp: (105-116), Month: April 2020 - September 2020, Available at: www.researchpublish.com
Fig.6. Story displacement and story drift of different rectangularity ratio with constant Structural system. Dynamic response to ground motions depends on dynamic properties of the structure, which is mainly dependent on lateral force resisting system, as well as the characteristics of earthquake excitations. In order to investigate the effect of types of lateral force resisting system on the induced maximum story displacement as well as induced maximum story drift, a time-history analysis is performed for the seven ground motion records shown in Fig.6 The study is extended to consider the effect of building height as well as rectangularity ratio, L/B, on the induced responses of the superstructures. The building aspect ratio varied from 1 to 2 for different three models having different number of floors 10, 20 and 30. The effect of building height appreciably changes the response of the superstructure of the building where the peak displacement and the peak drift found to have considerably higher values for tall buildings compared to the case of shorter one for all the considered rectangularity ratio. As shown in the plotted curves, an increase in the peak displacement responses as the height of the structure increases. Hence, as shown in Fig.6, it is inferred that the peak displacement responses for rigid frame system are very large compared to the tubular and shear wall system for all building heights and different aspect ratio. In contrast, the peak displacement response for the Tubular model decreases as the building aspect ratio increases for all building heights. Moreover, the induced maximum story drift produces similar trend. It is shown in the figure that the peak drift in case of rigid frame and tubular system decreases with increases in rectangularity ratio for the applied ground motion records considered in the study. In contrast, the trend of the peak drifts in shear wall system decreases with the increase of the aspect ratio up to a certain point followed by an increasing trend with the increase in aspect ratio for all heights. It is also noted that the location of the inflection point changes for different systems.
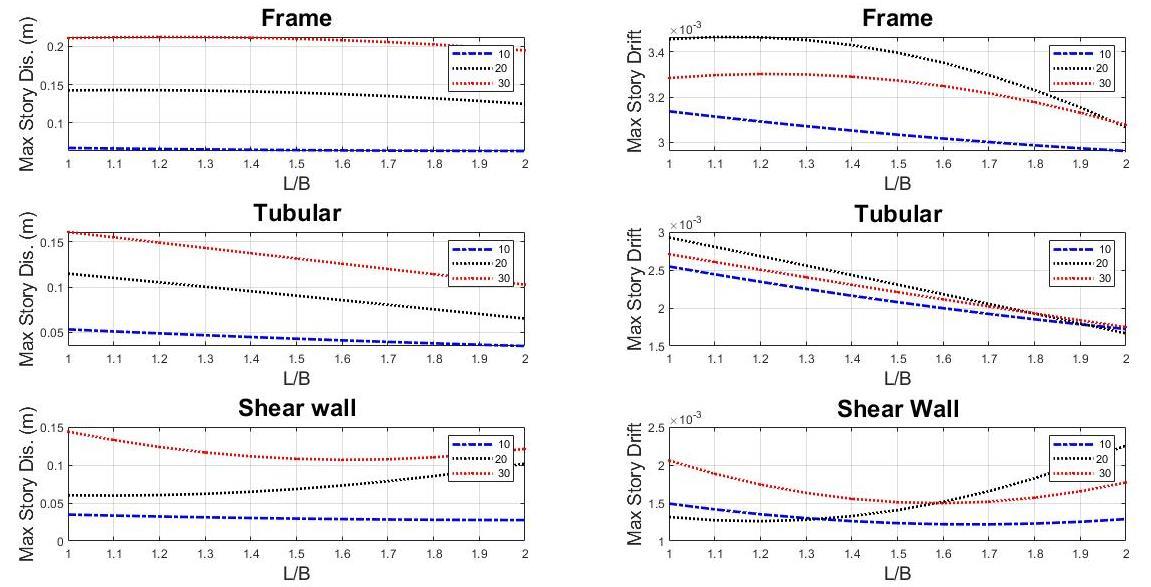
There is no doubt the building configuration is critical to good seismic performance, Where the building 's behavior during earthquakes is crucially dependent on its shape, size and geometry. Earthquake-resistant design of buildings depends on the strength, rigidity, and inelastic deformation capacity of the building, which are sufficiently large to withstand a certain level of earthquake-generated force. Based on the present study, the Square Configurations (Aspect ratio 1, L =B) perform better, as they possess lesser values of all seismic parameters such as displacement, drift, acceleration, and base shear. Therefore, configurations that have elongated shape should not be preferred. The configuration must have some adequate base width. The comparison of results obtained from different types of analysis has been carried out for three different no. of floors, 10-20 and 30-floor buildings with different structural systems. In addition, The seismic performance of all the systems considered is desirable and satisfies both the objectives of collapse prevention and life-safety design.
VI. DESIGN QUALITY INDICATOR
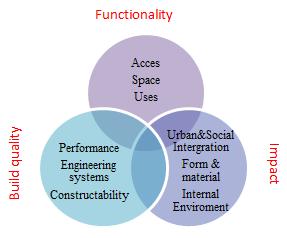
The DQI was developed to evaluate the quality of the design in the buildings through feedback and perceptions of people interested in or connected to the product. It applies to new or redeveloped buildings. It is in the form of a questionnaire containing a set of statements which gather the views or perceptions of all stakeholders by considering the three quality indicator fields, i.e. Functionality, build quality, and impact of buildings as illustrated in Fig.7.
International Journal of Civil and Structural Engineering Research ISSN 2348-7607 (Online)
Vol. 8, Issue 1, pp: (105-116), Month: April 2020 - September 2020, Available at: www.researchpublish.com
Fig.7. The three quality fields of DQI
Description of each quality field according to Construction Industry Council (CIC) is summarized in sub-headings as the following:
1) Functionality: The functionality of buildings is assured in terms of the quality and interrelationship of spaces, and how useful the design of buildings is. It considers three following aspects:
Use - How well a building adapted to the functions it can accommodate in the first place and in the future
Size - the size and interrelationship of the building's and rooms.
Access - how easy it is for all people to get into the building or around it
2) Build quality: The building quality is assessed on how well the building is built: its structure, finishes and fittings, its engineering systems, and the coordination of all of these and how well they are performing. The evaluation is on the following aspects:
Performance - the building's mechanical, environmental and safety systems.
Engineering - the quality of the components of the building
Construction - how well the building is put together.
3) Impact: The impact of buildings highlights the ability of buildings to delight, create a sense of place and enhance the community and environment and the contribution of design to the building arts and science. The evaluation includes:
Character and innovation - what people think of the building as a whole.
Form and materials - the physical composition, scale, and configuration of the building within its confines.
Internal environment - quality of building inside
Urban and social integration - building relationship with its surrounding area
Weighted Evaluation Matrix (WEM):
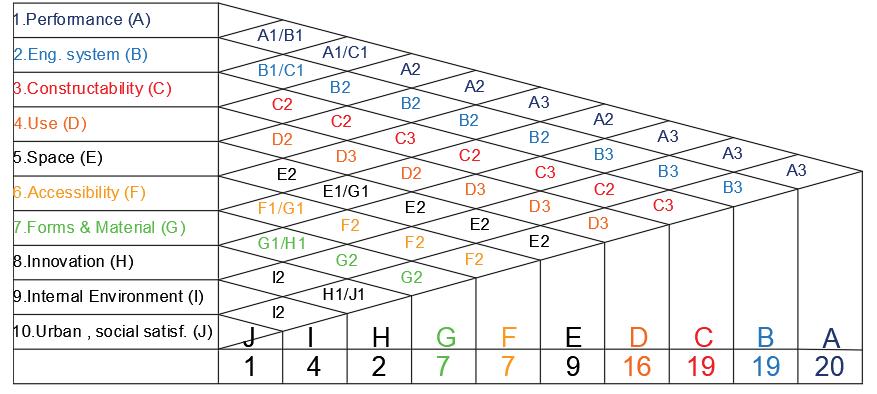
The weighted evaluation matrix consists of two parts: The Function Matrix and the Analysis Matrix. On the Function Matrix, important criteria in the selection of alternatives are determined and compared for their relative importance. The comparison process is for two elements only at a time. Preference of one criterion over another is established, and a numerical score of 1 to 4 is given to the preferred criteria. The sum of each criterion‟s scores is tabulated into a raw score as in Fig.8. The raw score is converted into a weight of importance factor on a scale of 1 to 10. Possible alternatives are listed in the Matrix of Analysis and compared to the Function Matrix criteria for each. For the alternative to the comparison of criteria, a different numerical score from 1 to 5 is established. This score is multiplied by the weight of the factor of importance to establish an adjusted subtotal score. The sum of all alternative-to-criteria comparison scores is summarized to give a final total number score which ranks one alternative to another as in TABLE 3.

International Journal of Civil and Structural Engineering Research ISSN 2348-7607 (Online) Vol. 8, Issue 1, pp: (105-116), Month: April 2020 - September 2020, Available at: www.researchpublish.com
TABLE 4: Comparing between different systems values
Frame system Tube system Core & Shear wall system
1.Performance 14 16 17 2.Engineering Systems 5 3 5 3.Constructability 13 9 10 4.Use 8 7 8 5.Space 11 9 10 6.Access 9 7 8 7.Forms&Material 12 10 11 8.Innovation 4 3 4 9.Internal Environment 12 12 10 10.Urban & social Satisfaction 5 4 5
It took work to rethink the DQI tool's visualization of the results. A spider diagram (Radar chart) approach was adopted after the initial pilot phase to represent the results. This brought the appearance of the DQI results in line with those used for Key Performance Indicators (KPI‟s) in UK construction as shown in Fig.9
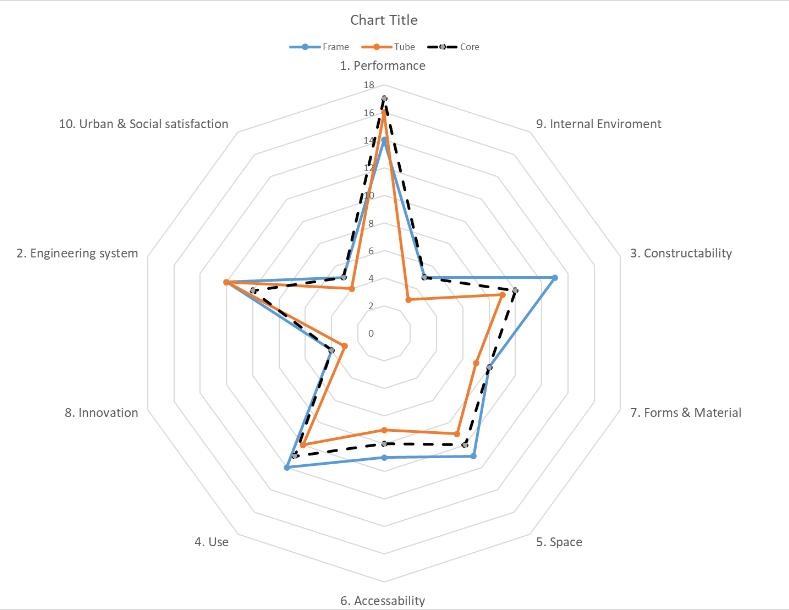
From Fig.9, At same height 10 floor and same aspect ratio (L=B), the area covered by the frame system (A=254.6975 area unit )is the biggest one then the area of core system (A= 228.84 area unit) and the smallest area is the tube system (A=173.6069 area unit). As the area increase indicates that the design quality of the structure increase. Form this data, Frame system is the best structural system to choose.
Fig.9. Comparison between the structural systems represented by radar chart
VII. CONCLUSION
In conclusion, quality design produces the best design that provides purpose-fit buildings and spaces that satisfy users. Implementing the DQI significantly reduces the time spent on design and rework by providing a shared platform for discussion of design between technical and non-technical teams and common methodologies through which procurement teams can evaluate whether a proposed design is “good” or what aspects of a design are “not good”. It takes the guesswork out of designing a building by converting individual subjective perceptions into objective measurable results.
International Journal of Civil and Structural Engineering Research ISSN 2348-7607 (Online) Vol. 8, Issue 1, pp: (105-116), Month: April 2020 - September 2020, Available at: www.researchpublish.com
From the perspective of design optimality only: In low rise buildings, core and shear wall system is the best lateral resisting system to choose. In Mid-rise buildings, frame system is the best lateral resisting system to choose for design. While, in high rise building, core and shear wall system is the best lateral resisting system to choose for design. But as disused frame system is the optimal system from perspective of design quality indicators which is including many primary parameters that should be considered in the decision not only to choose according to design parameter
Table 5 demonstrates the recommended structural systems for different building heights. It was organized according to the structural efficiency as well as the indicators of design quality and structural rigidity. These suggestions give structural engineers vision for optimum selection of systems
TABLE 5. Suggested systems for different building height
Building Height
Suggested Structural system
Low rise building (0 – 10 Stories) Rigid frame system
Midrise building (11– 20 Stories) Rigid frame system
High rise building (21-30 Stories) Core and shear wall system
REFERENCES
[1] SAVE International, The value society. “Value Methodology Standard and Body of Knowledge”, June 2007.
[2] A Abdelalim, "Integrating BIM-Based Simulation Technique for Sustainable Building Design: Proceedings of the 2nd GeoMEast International Congress and Exhibition on Sustainable Civil Infrastructures, 2018
[3] M Halis Günel and H Emre Ilgin, “Tall Buildings - Structural Systems and Aerodynamic Form”, 2014.
[4] B Stafford Smith and A Coull , “Tall Building Structures, Analysis and Design”,1991.
[5] F Khan and W Schueller, “High-rise Building Structures” 1977
[6] N. F. El-Leithy, M. M. Hussein and W. A. Attia. “Comparative Study of Structural Systems for Tall Buildings” Journal of American Science 7(4):707-719, 2011.
[7] David, H, “ISO 9000 Quality Systems Handbook”, 4th ed. Butterworth-Heinemann.
[8] A Abdelalim, "IRVQM, Integrated Approach for Risk, Value and Quality Management in Construction Projects; Methodology and Practice" Big 5 conference, 2018
[9] R. Farooqui& S. M. Ahmed "Designing for quality: an empirical study of design quality indicator (DQI) tool", Building Research & Information, pp. 1–7, 2009
[10] A Suratkon, C Chan and S Jusoh, "Indicators for Measuring Satisfaction Towards Design Quality of Buildings" International Journal of GEOMATE, Vol. 11, Issue 24, 2016
[11] Construction Industry Council (CIC), Design Quality Indicator Online, www.dqi.org.uk, accessed on 28th December 2019
[12] B. Giddings, M. Sharma, P. Jones, and P. Jensen, “An evaluation tool for design quality: PFI sheltered housing”, Building Research & Information, Vol. 41: 6, pp. 690–705, 2013
[13] Office of Government Commerce (OGC), “Design quality: Achieving excellence in construction procurement guide”, 2007, UK.Commerce
[14] D. Gann and J. Whyte “Design quality, its measurement and management in the built environment”, Building Research & Information, 2003, pp. 314-317.
[15] J. Whyte, and D. Gann, “Design Quality Indicators: work in progress” Building Research & Information, 31(5), 387–398, 2003.
[16] A Abdelalim, "Identification and assessment of risk factors affecting construction projects", HBRC Journal, Vol 13, pp 202-216, August 2017
[17] A. Abd-Elhamed, S. Mahmoud, "Nonlinear static analysis of reinforced concrete framed buildings-A case study on Cairo earthquake" Journal of Engineering Research, Vol. 4, pp. 1-23, 2016
[18] A. Abd-Elhamed, S. Mahmoud, "Linear and Nonlinear Dynamic Analysis of Masonry Infill RC Framed Buildings" Civil Engineering Journal, Vol. 4, pp. 881-896, 2017.
