International Journal of Civil and Structural Engineering Research ISSN 2348-7607 (Online) Vol. 8, Issue 1, pp: (122-129), Month: April 2020 - September 2020, Available at: www.researchpublish.com
INVESTIGATING THE FRACTURE CHARACTERISTICS OF NIGERIAN RICE HUSK ASH (RHA) - BASED HIGH STRENGTH CONCRETE (HSC)
1Anthony O. Bucknor, 2Fisayo M. Animashaun, 3Festus A. Olutoge, 4Oluwaseun A. Adetayo, 5Wasiu O. Ajagbe, 6Efe E. Ikponmwosa
1Department of Civil Engineering, University of Ibadan
2Department of Industrial and Production, University of Ibadan
3Department of Civil Engineering, University of Ibadan
4Department of Civil Engineering, Federal University of Technology Oye Ekiti
5Department of Civil Engineering, University of Ibadan
6Department of Civil Engineering, University of Lagos
Abstract: Based on the initial research on the suitability of RHA in partial replacement of cement in HSC production, it was observed that between 10 – 20% replacement by weight of cement with RHA shows potential for use in the production of HSC based on their compressive strength. However, However, the use of compressive strength criteria only as a determinant in High Strength Concrete (HSC), especially in RHA-Cement blend concrete, has shown its inadequacies. Fracture Mechanics is a reliable experimental/analytical tool that has not been adequately used in the study of RHA-based HSC. Thus, the need to study its fracture mechanics parameters such as Crack Tip Opening Displacement ( ) test and Stress Intensity Factor ( ) to understand the behaviour of the RHA-based HSC to fracture toughness which is an indication of the strength of concrete when subjected to loading.
Milled samples of the RHA were used in the preparation of RHA- Cement blends with the cement being replaced at 0%, 10% and 20% by cement weight. The 0% replacement served as a control for the experiment. 36 cubes of HSC with an expected compressive strength of 60MPa respectively were produced; 12 cubes for each percentage replacement aimed at affirming the compressive strengths were within the expected 60 MPa value. Then same mix design was used to prepare 78 beams (18, 30 and 30 for 0%, 10% and 20% RHA-Cement blend HSC) were prepared and subjected to experimental Fracture Mechanics three-point bending tests (TPBT) while the peak load for each beam before failure were recorded. The recorded peak loads were used to develop function via numerical computational and statistical models to determine the and values for the concrete.
Based on the numerical analysis done, there was a progressive increase in with an increase in RHA content in the concrete mixes with 20% having the highest ( √ and ) values compared to the control and the 10% RHA. Thus, it implies 20% RHA-cement blended HSC has more resilence compare to the 10% RHA.
Keywords: Crack Tip Opening Displacement( ), Stress Intensity Factor ( ), Fracture Mechanics, Rice Husk Ash, High Strength Concrete, Construction, Concrete, Carbon Dioxide, Nigeria.
International Journal of Civil and Structural Engineering Research ISSN 2348-7607 (Online) Vol. 8, Issue 1, pp: (122-129), Month: April 2020 - September 2020, Available at: www.researchpublish.com
I. INTRODUCTION
Nigeria had an estimated production of 9.86 million tonnes in 2017 from 353 thousand tonnes in 1968, growing annually at approximately 9.76% (data obtained from Index Mundi). It is expected that local rice production in later years has also increased significantly, given the Nigerian governments’ drive and initiatives to increase local rice production. Estimations by [7] reveal that 200kg of husk is generated for every 1,000kg of rice grains produced. This would mean that approximately 1.2 million metric tonnes of rice husk are generated. A large proportion of this 1.2 metric tonnes is dumped in the environment as waste, while the rest is used for other uses such as heating or industrial use and the ash generated from such processes also dumped as waste in the environment. The indiscriminate dumping of the rice husk and its ash in the environment is a contributor to environmental pollution, which is expected to get worse as the Government realizes its objective of increasing rice production in the country.
The construction industry has been identified as one of the largest contributors to the production of Carbon Dioxide (CO2), one of the greenhouse gases via anthropogenic activities worldwide [5]. 50% of the emission has been identified to be from the chemical process while 40% is from burning fuel [10], [4]. CO2 emission during concrete production is recognized to be directly proportional to the amount of cement used in the concrete mix, accounting for 88% of the emissions associated with the average concrete mix [6] [8] Thus, reducing the amount of CO2 emission from concrete production will also reduce the amount of greenhouse gases in the atmosphere.
Rice Husk has been identified to be a prolific item, which can find use in various activities such as heating, cooking, drying electricity generation and other industrial uses [3]. Extensive research has been carried out into the use of RHA in the construction industry as a partial replacement for cement in the production of HSC due to the probable environmental and economic benefits. RHA contains between 87% - 97% of silica, and is highly porous and lightweight, with a high external surface area which makes it a viable material for use in concrete production.
This research thus focuses on the possible use of RHA due to its high pozzolanic properties as a partial replacement for cement in the production of HSC in Nigeria.
II. MATERIALS AND METHODS
The following materials were used in the course of the study:
a. Rice Husk Ash: The Rice Husk used in this experiment was obtained from Ire Ekiti, Southwest Nigeria. It was then burnt in open air within a temperature range of 500 – 800℃after which the RHA obtained was sieved and milled.
b. Fine Aggregate: The fine aggregates utilized were gotten from the Lagos lagoon bed located at Oworonshoki, Lagos. The sand particles were passed through BS sleeve no. 4 (aperture 4.75mm) but retained on sieve 1 (aperture 0.06mm) to ensure that the dust particles were removed from the sand.
c. Coarse Aggregate: The coarse aggregate used in this research study were crushed granite of igneous origin. They size used was the recommended size of 2.36 to 12.70mm, to help improve the concrete.
d. Ordinary Portland Cement: The cement used was Ordinary Portable Cement OPC (Dangote Cement) which satisfies international standards of Ordinary Portland Cement and it ensured the cement passes the test for which its properties may be determined.
e. Portable Water: The water used was obtained from the laboratory taps. The water was portable and did not contain sulphate, ferric, alkaline, oils, vegetation or salt that could affect the properties of materials concrete in the fresh or hardened state (Annex A of BS 3148: 1980). Also, the water used was colourless, tasteless, odourless and free from decaying organic matter.
a. MATERIALS SELECTION AND CONCRETE DESIGN MIX
A preliminary investigation was conducted on the physical and chemical composition of the Rice Husk, granite, sand and cement used. Laboratory concrete proportioning trial mixes (to achieve a strength of 60 MPa) were then created using the methods prescribed in ACI committee 211 guide [1]. The RHA was varied between the trial mixes at proportions of 0%, 10%, 20%, 30%, 40% and 50%. Once the mixes were prepared, slump tests were carried out on the various concrete paste mixes, then the specimens were cured by immersion and ambient air for 7, 14, 21 and 28 days respectively. The table below shows the parameters used:
International Journal of Civil and Structural Engineering Research ISSN 2348-7607 (Online) Vol. 8, Issue 1, pp: (122-129), Month: April 2020 - September 2020, Available at: www.researchpublish.com
Table 1: Concrete Mix Design Material Specification (Grade M60)
Design Materials Specification
Target strength (MPa) 60
Max size of aggregate used(mm) 12.7
Specific gravity of Cement 3.15
Specific gravity of fine aggregate (F.A) 2.63
Specific gravity of coarse aggregate (C.A) 2.58
Dry Rodded Bulk density of F.A (Kg/ ) 1693
Dry Rodded Bulk density of C.A (Kg/ ) 1619
Water-cementitious ratio 0.3169
Specific gravity of RHA 1.56
Due to their observed optimum percentage replacement performance, the 10% and 20% RHA-Cement mixes were used to prepare 78 beams for fracture parameter test. A modified Three Point Bending Test (TPBT) technique was adopted due to laboratory set up limitations Of the 78 beams prepared, 18 beams were used as control while 30 beams each were the 10% RHA – Cement mix and 20% RHA – Cement mix respectively. The 78 beams were all air cured. The table below shows the beam specimen classification used:
Table 2: Beam Specimen Classification
Group Wi(mm) S(mm) L(mm) b(mm) a0(mm)/W a0(mm)
1 102.00 381.00 481.00 76.00 0.290 29.580
2 102.00 381.00 481.00 76.00 0.320 32.640
3 102.00 381.00 481.00 76.00 0.460 46.920
4 102.00 381.00 481.00 76.00 0.520 53.040
5 102.00 381.00 481.00 76.00 0.620 63.240
6 102.00 381.00 481.00 76.00 0.670 68.340 Notches were then cut into the beams using a concrete saw (as indicated in the 3 and 4 below) and were set up as indicated in the figure below and the maximum load was recorded.
Table 3: Control Mix Design (Grade M60)
Volume
Fractional volume of oven dry rodded C.A for 12.5 mm size aggregateBased on a slump of 25 – 50 mm estimated mixing water content (kg/ ) 174 -
Void content of FA % 35.59 -
Adjustment in mixing water 2.80 -
Total water required(kg) 176.80 0.1768
Cementitious materials content(kg) 557.84 0.1771
Coarse aggregate content (kg) 1100.65 0.4267
Entrapped air content 2.00 0.0200
Fine aggregate content(kg) 524.10 0.1994
HRWR Dosage as per manufacturer recommendation (volume/cementitious content) 1Ltr/100kg
International Journal of Civil and Structural Engineering Research ISSN 2348-7607 (Online) Vol. 8, Issue 1, pp: (122-129), Month: April 2020 - September 2020, Available at: www.researchpublish.com
Table 4: Lab Trial Mix (0.05062 m^3) 15 cubes per mix with 25% allowance for wastage Control Mix(kg/ ) % Replacement Beams 10 20 Control Specimen
Cement 35 32 28 47 157 RHA 0 4 7 0 17 Sand 33 30 27 45 149 Stone 70 70 70 94 344
Water (plus HRWR) 11 11 11 15 55 HRWR (ml) 353 353 353 474 1743
III. RESULTS AND DISCUSSION
The “Simple Method for Determining Material Fracture Parameters from Peak Loads” by Tang, et al [11] was adopted for the determination of the fracture parameters for the given concrete structure. As stated in the previous section, 78 beams were prepared and divided into six groups based on recommendations by Rafai and Swartz [9] with reference to threepoint bending testing. The table below shows the beam classifications:
Table 5: Beam classification
Group (mm) S(mm) L(mm) b(mm) (mm)/W (mm)
1 102.00 381.00 481.00 76.00 0.290 29.580 2 102.00 381.00 481.00 76.00 0.320 32.640 3 102.00 381.00 481.00 76.00 0.460 46.920 4 102.00 381.00 481.00 76.00 0.520 53.040
5 102.00 381.00 481.00 76.00 0.620 63.240
6 102.00 381.00 481.00 76.00 0.670 68.340
The beams were then subjected to load according to standard three-point bending test and the peak load responsible for each beam were recorded and shown in Table 6 below:
Table 6: Beam Peak load
Sample Classification Pmax (N) Pmax (N)Avg 1 2 3 4 5
A1 2567.49 2576.81 2593.43 2425.37 2526.95 2538.01
A2 2569.67 2664.60 2528.04 2580.24 2527.61 2574.03
A3 1689.53 1405.58 1371.80 1550.05 1417.27 1486.84
A4 1027.40 969.31 938.87 900.84 925.43 952.37
A5 775.01 783.59 752.01 814.93 674.69 760.05
A6 281.18 409.91 352.76 297.72 390.05 346.32
B1 2484.84 2360.14 2517.22 2328.24 2481.28 2434.34
B2 2437.33 2493.70 2537.11 2394.55 2552.28 2482.99
B3 1370.98 1440.91 1493.69 1462.61 1342.14 1422.07
B4 765.93 706.21 699.75 715.49 706.04 718.68
B5 632.16 597.48 541.77 671.49 505.57 589.69
B6 270.12 297.38 299.88 340.90 257.76 293.21
C1 - - 2416.07 2346.89 2377.27 2380.08
C2 - - 2485.95 2491.73 2365.28 2447.65
C3 - - 1421.28 1412.53 1437.96 1423.92
C4 - - 1005.96 971.10 1013.09 996.71
C5 - - 695.04 719.31 743.60 719.32
C6 - - 341.23 372.58 300.30 338.04
The first 3 classes of beams were found to be statistically relevant and were used for the next stage of the analysis. The average peak loads for the first 3 classes of beams were calculated and then applied in accordance with the LEFM equations shown below to calculate the and using series of assumed a value for (see Table 4.3)
International Journal of Civil and Structural Engineering Research ISSN 2348-7607 (Online) Vol. 8, Issue 1, pp: (122-129), Month: April 2020 - September 2020, Available at: www.researchpublish.com
√
Table 7: The calculated and based on assumed (Class A1)
S/N W(m) S(m) B(m) f'c (MPa) a0 (m) ac (m)
(1) (2)
Pmax (N)Avg Ks IC (MPa) CTODC (mm)
1 0.102000 0.381000 0.07600 60.15 0.029580 0.056100 2380.08 1.150960 0.019522
2 0.102000 0.381000 0.07600 60.15 0.029580 0.056233 2380.08 1.156167 0.019696
3 0.102000 0.381000 0.07600 60.15 0.029580 0.056365 2380.08 1.161410 0.019872
4 0.102000 0.381000 0.07600 60.15 0.029580 0.056498 2380.08 1.166691 0.020050
5 0.102000 0.381000 0.07600 60.15 0.029580 0.056630 2380.08 1.172009 0.020229
6 0.102000 0.381000 0.07600 60.15 0.029580 0.056763 2380.08 1.177365 0.020410
7 0.102000 0.381000 0.07600 60.15 0.029580 0.056896 2380.08 1.182759 0.020593
8 0.102000 0.381000 0.07600 60.15 0.029580 0.057028 2380.08 1.188192 0.020777
9 0.102000 0.381000 0.07600 60.15 0.029580 0.057161 2380.08 1.193665 0.020963
10 0.102000 0.381000 0.07600 60.15 0.029580 0.057293 2380.08 1.199176 0.021151
Based on the Tang et al (1996), the values of and are modelled to find the function of and is developed using the simple linear regression model as shown below:
(3) ∑ ∑ ∑ ∑ ∑ (4) ∑ ∑ (5)
Taking to be x and to be y, the function of for the respective classes is shown as follows; (6) (7) (8)
From equations (6), (7) and (8) above, the same values of were substituted in the equations and average of the corresponding and the variance ( ) (refer to Table 8 below).
Table 8: Calculated Average and variance (Partial table)
(MPa) (Group 1) (Group 2) (Group 3) Average
0.6700000 0.0005940 -0.0007120 0.0052940 0.0017253 0.997794533 0.6850000 0.0011670 -0.0001660 0.0057170 0.0022393 0.951484633 0.7000000 0.0017400 0.0003800 0.0061400 0.0027533 0.906453333 0.7150000 0.0023130 0.0009260 0.0065630 0.0032673 0.862700633 0.7300000 0.0028860 0.0014720 0.0069860 0.0037813 0.820226533 0.7450000 0.0034590 0.0020180 0.0074090 0.0042953 0.779031033 0.7600000 0.0040320 0.0025640 0.0078320 0.0048093 0.739114133 0.7750000 0.0046050 0.0031100 0.0082550 0.0053233 0.700475833 0.7900000 0.0051780 0.0036560 0.0086780 0.0058373 0.663116133 0.8050000 0.0057510 0.0042020 0.0091010 0.0063513 0.627035033
NB: See full table in the appendix
International Journal of Civil and Structural Engineering Research ISSN 2348-7607 (Online) Vol. 8, Issue 1, pp: (122-129), Month: April 2020 - September 2020, Available at: www.researchpublish.com
Furthermore, applying a multiple linear regression model, the function of was modelled using the , square of as variables. The equation below was derived showing a nonlinear relationship between and (group A)
(9)
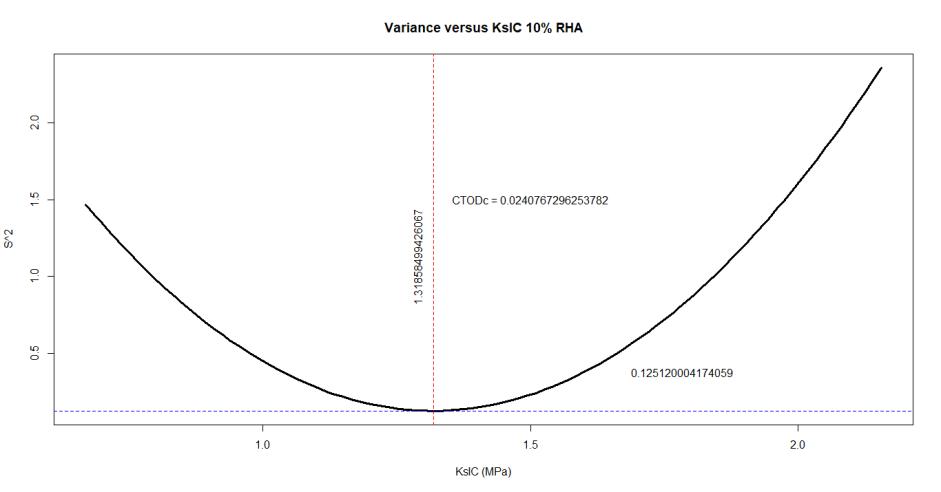
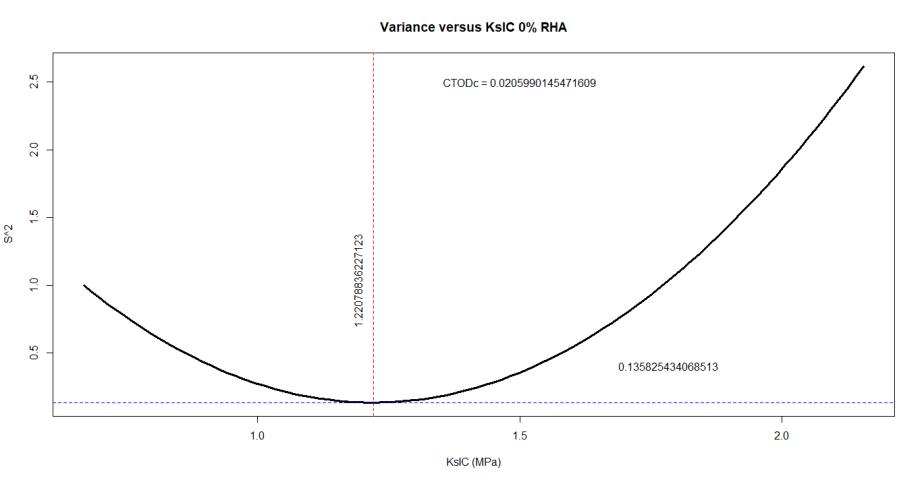
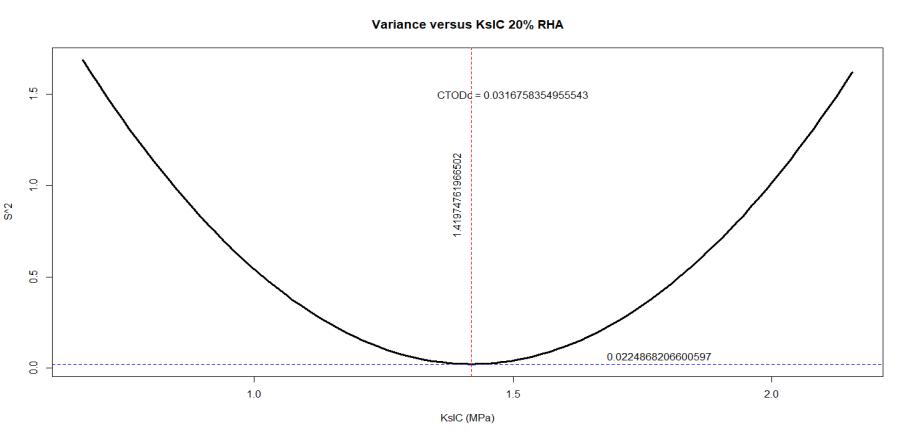
The equation above reveals that the minimum of the curve – corresponds to the critical intensity factor for the whole materials as shown below. Based on the value, the linear regression model between the average and can be used to find the corresponding for the material.
Figure 1: and at 0% RHA
Figure 2: and at 10% RHA


Figure 3: and at 20% RHA
Research Publish Journals

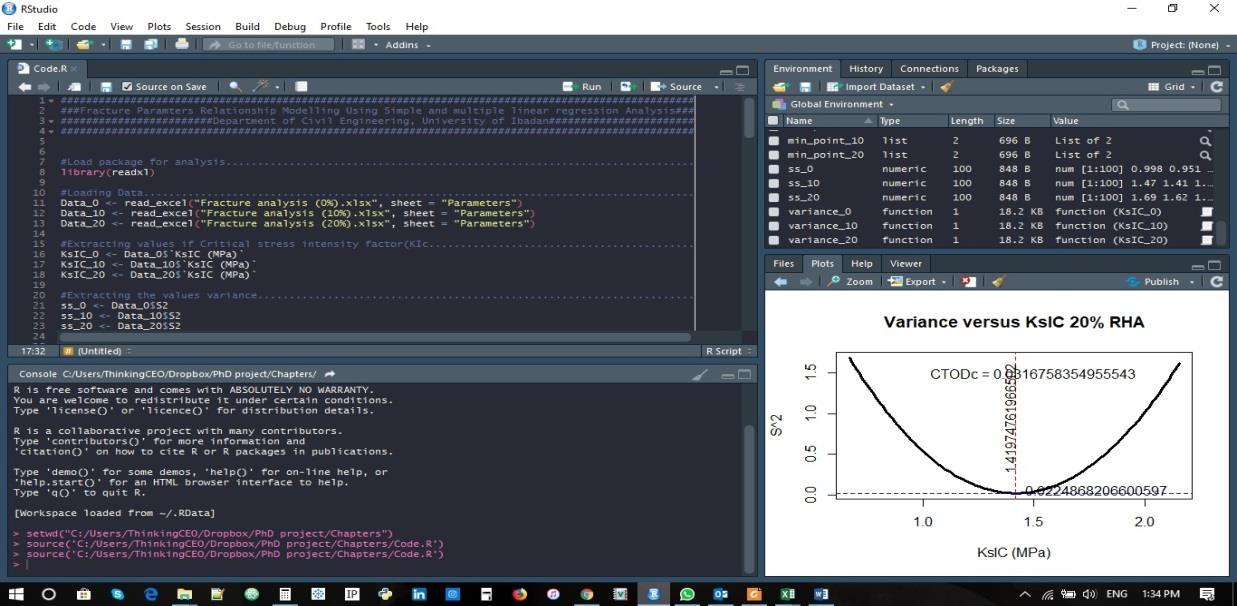
Plate I: R-studio work space
The above plate (I) reveals that the and increases with increase in RHA percentage with 20% recording the highest after using an R-program code to model the various linear regression relationships

IV. CONCLUSION
From the experiment carried out, it was observed that increases with an increase in RHA % replacement, while CTOD increases with increase in RHA % replacement. The value of the and CTOD of the 20% RHA – Cement mix was higher than that of 0% and 10% replacements respectively, and thus the 20% replacement offers more resistant to crack growth propagation. Given the influence of material quality on strength of HSC, with careful quality control during concrete production the strength of HSC can be improved for 20% replacement. Thus, the 20% RHA – concrete mix is recommended as a suitable replacement for cement in HSC production. This will lead to a reduction of CO2 emissions during the production of HSC and environmental pollution that occurs as a result of the indiscriminate disposal of Rice Husk and Rice Husk Ash
REFERENCES
[1] ACI 211.4R-08, Guide for Selecting Proportions for High-Strength Concrete with Portland Cement and Fly Ash, ACI Committee 211, American Concrete Institute, USA.
[2] ACI Committee 363 (ACI 363R-92) (1992), “State-of-the-Art Report on High Strength Concrete.” American Concrete Institute, Detroit, Michigan, 55 pp.
[3] Della, V. et al (2002). Rice husk ash as an alternate source for active silica production. Materials Letters, 57(4), pp.818-821.
[4] En.wikipedia.org. (n.d.). Environmental impact of concrete. [online] Available at: https://en.wikipedia.org/ wiki/Environmental_impact_of_concrete#cite_note-wbcsd-1 [Accessed 15 Jul. 2015].
[5] EIA – Emissions of Greenhouse Gases in the U.S. 2006-Carbon Dioxide Emissions Archived 2011-05-23 at the Wayback Machine.
[6] Mahasenan, N., Smith, S. And Humphreys, K. (2003). The Cement Industry and Global Climate Change Current and Potential Future Cement Industry CO2 Emissions. Greenhouse Gas Control Technologies - 6th International Conference, pp.995-1000.
International Journal of Civil and Structural Engineering Research ISSN 2348-7607 (Online) Vol. 8, Issue 1, pp: (122-129), Month: April 2020 - September 2020, Available at: www.researchpublish.com
[7] Mehta, P. K. (1986). Concrete structure, properties, and materials, Prentice-Hall, Englewood Cliffs, N.J. pp. 266, 273
[8] Nisbet, M., Marceau, M., VanGeem, M. (2002). Environmental Life Cycle Inventory of Portland Cement Concrete. http://www.nrmca.org/taskforce/item_2_talkingpoints/sustainability/sustainability/sn2137a.pdf
[9] Rafai and Swartz 1987 Refai TME, Swartz SE (1987) Fracture behavior of concrete beams in three-point bending considering the influence of size effects. Report No. 190, Engineering Experiment Station, Kansas State University.
[10] The Cement Sustainability Initiative: Our agenda for action, World Business Council for Sustainable Development, page 20, published 1 June 2002.
[11] Tang, T et al (1996). Determination of fracture energy and process zone length using variable-notch one-size specimens. ACI Materials Journal. 96. 3-10.
