International Journal of Civil and Structural Engineering Research ISSN 2348-7607 (Online) Vol. 8, Issue 1, pp: (161-172), Month: April 2020 - September 2020, Available at: www.researchpublish.com
FINITE ELEMENT MODELING OF LIGHTWEIGHT CONCRETE SOLID SLABS REINFORCED USING G.F.R.P. REBAR
1Alaa G. Sherif, 2 Nasr Z. Hassan, 3 Mohamed Saber, 4Mirhan W. Adly
1 Prof. of Concrete Structures, Faculty of Eng., Mattaria, Helwan Univ., Cairo, Egypt
2 Assoc. Prof. of Concrete Structures, Faculty of Eng., Mattaria, Helwan Univ., Cairo, Egypt
3Teacher, Construction Engineering Dept., Egyptian Russian University, Cairo, Egypt
4 Teaching Assistant, Construction Engineering Dept., Egyptian Russian University, Cairo, Egypt
Abstract: Recently, the use of Fiber Reinforced Polymers (FRP) as an alternate to conventional steel has proved to be an effective solution to the corrosion problem. However, FRP reinforcing bars have a relatively low axial and transverse stiffness compared to steel bars which results in a lower shear capacity of FRP reinforced concrete (RC) elements compared to the steel-RC elements. Glass Fiber Reinforcement Plastics (GFRP)- rebar are non-corrosive materials, good range of thermal performance, high tensile strength, resistance to acids, good electro-magnetic properties, vibration and impact loading, This research using ANSYS (15.0) to study the behavior of light-weight concrete slabs reinforced with GFRP-rebar according to different parameters obtained in this research. A total of sixty-six finite element slab models are investigated. twelve verification slabs to check the validity and accuracy of the finite element procedure models. The theoretical results obtained from ANSYS program are in good agreement with experimental results. The results include also the effect of each parameter on initial stiffness, energy absorption and ductility of the slabs.
Keywords: Solid plates, Flexure strength, GFRP rebar, Crack pattern.
I. INTRODUCTION
FRP reinforcement has widely been used as internal reinforcement in the new construction of civil structures or as near surface mounted NSM concrete reinforcement for increasing flexural and shear strength of deficient reinforced concrete member. This has made it necessary to create a comprehensive overview needed to justify their safe and economic use
The application of GFRP-bars as reinforced for concrete elements are not yet well established in neither Egypt or in the Middle East. One of the main reasons is that these bars are imported from other regions such as Europe, Japan, or the United States. This leads to an extremely high cost products and dictates to produce GFRP-bars locally. This will encourage local manufactures to adopt the process of making these bars for the Egyptian market. FRP is a composite made from reinforcement imbedded in a plastic (polymer) matrix. Physical and mechanical properties of FRP depend mainly on the type of fibers and resins used to form the composite. Such differences arise from the interaction mechanism between FRP reinforcement bars and concrete element. Although there are many researchers covered different subjects of concrete beams reinforced with GFRP-bars, there are a few numbers of work concern with concrete slabs which are reinforced with GFRP-bars.
2. PROGRAM STUDY
Slabs Divided into eleven Groups had Different dimensions Group I have 2000 mm long, 2000 mm wide and 100 mm depth, Group II have 1700 mm long, 1700 mm wide and 100 mm depth, Group III have 2000 mm long, 1800 mm wide and 100 mm depth, Group IV have 2000 mm long, 1650 mm wide and 100 mm depth, Group V have 2000 mm long,
International Journal of Civil and Structural Engineering Research ISSN 2348-7607 (Online) Vol. 8, Issue 1, pp: (161-172), Month: April 2020 - September 2020, Available at: www.researchpublish.com
1550 mm wide and 100 mm depth, Group VI have 2000 mm long, 1400 mm wide and 100 mm depth, Group VII have 2000 mm long, 1300 mm wide and 100 mm depth, Group VIII have 2000 mm long, 1250 mm wide and 100 mm depth, Group IX have 2000 mm long, 1150 mm wide and 100 mm depth, Group X have 2000 mm long, 1100 mm wide and 100 mm depth, Group XI have 2000 mm long, 1050 mm wide and 100 mm depth, All groups loaded by Distributed load.
Our experimental program included Group I, II and has been added group III,IV,V,VI,VII,VIII,IX,X,XI the slabs in these groups reinforced with Steel &GFRP bars. Name of specimens wrote as: Sx-y
Where S: Slab.
X: number of group.
Y: number of specimens.
Group Slab No. No. of RFT (bars)
I
Diameter (mm)
TABLE (I): Specimen Details
Material Surface Texture Slab Type Type of Load Dimensions (mm)
S1-1 8 8 steel Smooth One way Distribution 2000*1000*100
S1-2 5 10 steel Ribbed One way Distribution 2000*1000*100
S1-3 10 10 steel Ribbed One way Distribution 2000*1000*100
S1-4 8 8 GFRP Smooth One way Distribution 2000*1000*100
S1-5 5 10 GFRP Ribbed One way Distribution 2000*1000*100
S2-1 8 8 steel Smooth Two way Distribution 1700*1700*100
S2-2 5 10 steel Ribbed Two way Distribution 1700*1700*100
S2-3 10 10 steel Ribbed Two way Distribution 1700*1700*100
S1-6 10 10 GFRP Ribbed One way Distribution 2000*1000*100 II
S2-4 8 8 GFRP Smooth Two way Distribution 1700*1700*100
S2-5 5 10 GFRP Ribbed Two way Distribution 1700*1700*100
S2-6 10 10 GFRP Ribbed Two way Distribution 2000*1800*100
S3-1 8 8 steel Smooth Two way Distribution 2000*1800*100
S3-2 5 10 steel Ribbed Two way Distribution 2000*1800*100
S3-3 10 10 steel Ribbed Two way Distribution 2000*1800*100
III
S3-4 8 8 GFRP Smooth Two way Distribution 2000*1800*100
S3-5 5 10 GFRP Ribbed Two way Distribution 2000*1800*100 S3-6 10 10 GFRP Ribbed Two way Distribution 2000*1800*100
S4-1 8 8 steel Smooth Two way Distribution 2000*1650*100
S4-2 5 10 steel Ribbed Two way Distribution 2000*1650*100
S4-3 10 10 steel Ribbed Two way Distribution 2000*1650*100
IV
S4-4 8 8 GFRP Smooth Two way Distribution 2000*1650*100
S4-5 5 10 GFRP Ribbed Two way Distribution 2000*1650*100
S4-6 10 10 GFRP Ribbed Two way Distribution 2000*1650*100
S5-1 8 8 steel Smooth Two way Distribution 2000*1550*100
S5-2 5 10 steel Ribbed Two way Distribution 2000*1550*100
S5-3 10 10 steel Ribbed Two way Distribution 2000*1550*100
V
S5-4 8 8 GFRP Smooth Two way Distribution 2000*1550*100
S5-5 5 10 GFRP Ribbed Two way Distribution 2000*1550*100
S5-6 10 10 GFRP Ribbed Two way Distribution 2000*1550*100
S6-1 8 8 steel Smooth Two way Distribution 2000*1400*100
S6-2 5 10 steel Ribbed Two way Distribution 2000*1400*100
Research Publish Journals
International Journal of Civil and Structural Engineering Research ISSN 2348-7607 (Online) Vol. 8, Issue 1, pp: (161-172), Month: April 2020 - September 2020, Available at: www.researchpublish.com
S6-3 10 10 steel Ribbed Two way Distribution 2000*1400*100
VI
S6-4 8 8 GFRP Smooth Two way Distribution 2000*1400*100
S6-5 5 10 GFRP Ribbed Two way Distribution 2000*1400*100
S6-6 10 10 GFRP Ribbed Two way Distribution 2000*1400*100
S7-1 8 8 steel Smooth Two way Distribution 2000*1300*100
S7-2 5 10 steel Ribbed Two way Distribution 2000*1300*100
S7-3 10 10 steel Ribbed Two way Distribution 2000*1300*100
VII
S7-4 8 8 GFRP Smooth Two way Distribution 2000*1300*100
S7-5 5 10 GFRP Ribbed Two way Distribution 2000*1300*100
S7-6 10 10 GFRP Ribbed Two way Distribution 2000*1250*100
S8-1 8 8 steel Smooth Two way Distribution 2000*1250*100
S8-2 5 10 steel Ribbed Two way Distribution 2000*1250*100
S8-3 10 10 steel Ribbed Two way Distribution 2000*1250*100
VIII
S8-4 8 8 GFRP Smooth Two way Distribution 2000*1250*100
S8-5 5 10 GFRP Ribbed Two way Distribution 2000*1250*100
S8-6 10 10 GFRP Ribbed Two way Distribution 2000*1250*100
S9-1 8 8 steel Smooth Two way Distribution 2000*1150*100
S9-2 5 10 steel Ribbed Two way Distribution 2000*1150*100
S9-3 10 10 steel Ribbed Two way Distribution 2000*1150*100
IX
S9-4 8 8 GFRP Smooth Two way Distribution 2000*1150*100
S9-5 5 10 GFRP Ribbed Two way Distribution 2000*1150*100
S10-1 8 8 steel Smooth Two way Distribution 2000*1100*100
S10-2 5 10 steel Ribbed Two way Distribution 2000*1100*100
S10-3 10 10 steel Ribbed Two way Distribution 2000*1100*100
S9-6 10 10 GFRP Ribbed Two way Distribution 2000*1150*100 X
S10-4 8 8 GFRP Smooth Two way Distribution 2000*1100*100
S10-5 5 10 GFRP Ribbed Two way Distribution 2000*1100*100
S10-6 10 10 GFRP Ribbed Two way Distribution 2000*1100*100
S11-1 8 8 steel Smooth Two way Distribution 2000*1050*100
S11-2 5 10 steel Ribbed Two way Distribution 2000*1050*100 S11-3 10 10 steel Ribbed Two way Distribution 2000*1050*100
XI
S11-4 8 8 GFRP Smooth Two way Distribution 2000*1050*100
S11-5 5 10 GFRP Ribbed Two way Distribution 2000*1050*100
S11-6 10 10 GFRP Ribbed Two way Distribution 2000*1050*100 Fig 1: Reinforcement and Concrete Dimensions of Slab S1-1
International Journal of Civil and Structural Engineering Research ISSN 2348-7607 (Online)
Vol. 8, Issue 1, pp: (161-172), Month: April 2020 - September 2020, Available at: www.researchpublish.com
Fig 2: Reinforcement and Concrete Dimensions of Slab S2-1
Fig 3: Reinforcement and Concrete Dimensions of Slab S3-1
2.1 Verification of Finite Element Results:
Verification is carried out in order to check the validity and accuracy of the finite element procedure. The accuracy of the finite element models is determined by ensuring that failure modes are correct and the ultimate load is reasonably predicted in comparison with the experimental results, in our experimental work. Six specimens of one-way slab and six specimens of two-way slab are modeled. The finite element results will be in comparison with experimental results in the next section. In the following sections, the ANSYS results and behavior of the slab is discussed and compared with experimental results for specimens (S1-1, S1-2, S1-3, S1-4, S1-5 and S1-6). Table (2) shows the results of loads and deformations at cracking stage and failure stage and failure mode for Group I and II and shown in Figure (4)
TABLE (2): FEM Results versus Experimental Results for Verification Specimens
Group Specimen
S1-1 21.00 29.13 57.00 50.00 87.72 S1-2 20.00 27.96 53.00 49.50 93.39
Cracking Stage Failure Stage PFEM/ PExp (%) Exp. FEM Exp. FEM Pcr (KN) Pf (KN) Pcr (KN) Pf (KN) I
S1-3 55.00 36.73 137.0 130.0 94.89
S1-4 15.00 24.18 49.00 41.50 84.47 S1-5 13.00 9.67 56.00 53.0 94.65
S2-1 77.00 60.52 170.0 161.5 95.00
S2-2 46.00 39.60 230.0 217.0 94.35
S2-3 108.0 77.10 372.0 325.7 87.55
S1-6 16.00 17.52 110.0 96.0 87.27 II
S2-4 61.00 53.50 161.0 157.9 98.07
S2-5 32.00 47.78 124.0 119.4 96.29
S2-6 82.00 70.63 252.0 250.0 99.20
International Journal of Civil and Structural Engineering Research ISSN 2348-7607 (Online) Vol. 8, Issue 1, pp: (161-172), Month: April 2020 - September 2020, Available at: www.researchpublish.com
The failure load capacity is from ANSYS and our experimental results agree very well. The failure load capacity and deflection are significantly affected by using variable reinforcement ratio as shown in Table (2) and Figure (4).
Fig 4: Failure Load for Group (I)
2.2 Numerical Analysis:
A nonlinear three dimensional brick element solid element, SOLID 65, is used to model the concrete in ANSYS program [15. The solid element has eight nodes with three transitional degrees of freedom at each node. In addition, the element is capable of simulating plastic deformation, cracking in three orthogonal directions, and crushing. In compression and creep. Modeling of cracks through an adjustment of the material properties is done by changing the value of element stiffness matrices. If the concrete at an integration points fails in uniaxial, biaxial, or tri-axial compression, the concrete is assumed crushed at that point. Crushing is defined as the complete deterioration of the structural integrity of the concrete.
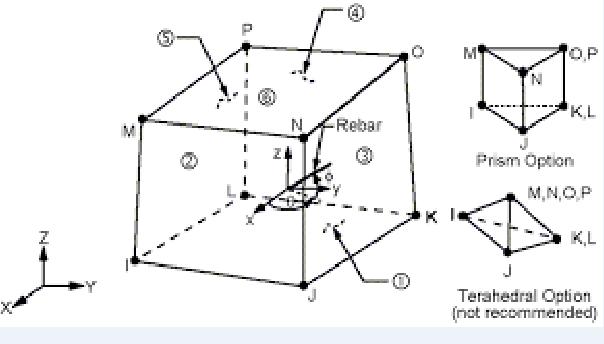
The element model of concrete is defined as eight nodes element having three degrees of freedom at each node Figure (5): translations in the nodal x, y, and z directions.
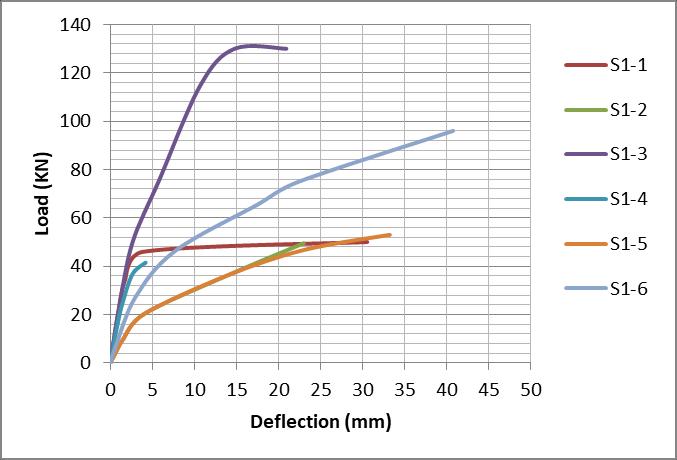
Slabs has almost the same profile of the load deflection curves for where the first part of the curves are steep, and after cracking, most of the profiles start to be more curved until the failure occurs.
The measured values of the deflection at the mid-span of the bottom surface of the investigated slab and plotted versus the applied load from loading starting to failure.
The process of crack formation can be classified into three stages. The un-cracked stage is before the limiting tensile strength is reached, the crack formation occurs in the process zone of a potential crack with lessening tensile stress on crack face due to crack bridging effect and finally, after a complete release of the stress, the crack opening continues without the stress. The concrete tension failure is characterized by a piecemeal growth of cracks, which connect together and eventually disconnect larger parts of the structure.
Cracking is represented in the ANSYS program by a circle outline in the plane of the crack, while the crushing is shown with an octahedron outline. The first crack is shown with a red circle outline at integration point, the second crack with a green outline, the third crack with a blue outline and closed cracks are shown as X inside the circle Fig 5: Solid65 element for concrete model
International Journal of Civil and Structural Engineering Research ISSN 2348-7607 (Online) Vol. 8, Issue 1, pp: (161-172), Month: April 2020 - September 2020, Available at: www.researchpublish.com
The longitudinal steel reinforcement is defined by a discrete axial element (LINK180) in ANSYS Program [15]. This element is a uniaxial tension-compression element with three translation degrees of freedom at each node Figure (6), modeling of steel bearing plate is Solid 45.
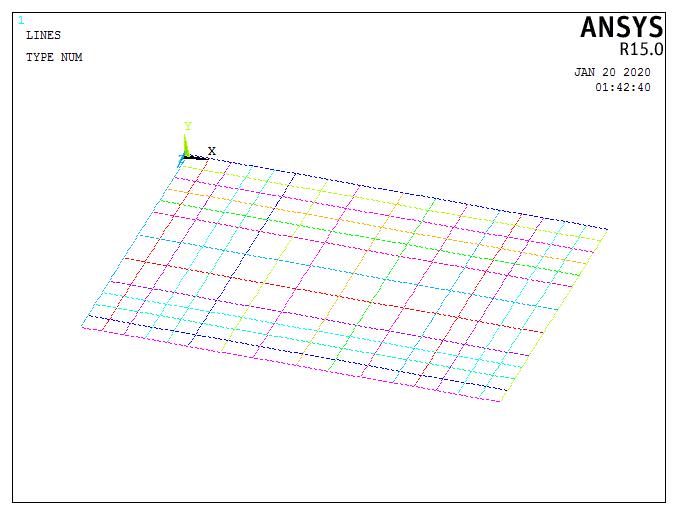

Fig 6: LINK8 Geometry
2.3 Modeling and Meshing:
Slabs specimens, plates, and supports modeled as volume, all models have a rectangular mesh of (25 mm x 25 mm). Figure (7) shows the meshing of specimens of all groups and reinforcement configuration in Figure (8).

Fig 7: Modeling and meshing
Fig 8: Reinforcement Configuration
Research Publish Journals
International Journal of Civil and Structural Engineering Research ISSN 2348-7607 (Online) Vol. 8, Issue 1, pp: (161-172), Month: April 2020 - September 2020, Available at: www.researchpublish.com
3. THEORETICAL RESULTS
In the following, the results of the specimen behavior are discussed through Table (3). The values indicate central deflection and load values at both of cracking and failure stages for all specimens. The measurement of the ductility as ductility index represented as the ratio of deflection value at failure to that at cracking stage (μd) = Δf / Δcr, and absorbed energy calculated by area under the load-deflection curve, also cracking and failure load are listed in the same Table (3). The mode of failure for each specimen is finally determined according to the final cracked shapes before failure.
In group (1), all specimens of same dimensions 2000*1000*100 mm, case of loading but different reinforcement ratio, failed in a typical tension mode the slab (S-1-1) was reinforced with steel bars. Specimens (S-1-2, S-1-3, S-1-4, S-1-5 and S-1-6) were reinforced with GFRP bars.
In addition, the measure of ductility in most specimens was enhanced by using high reinforcement compared by control specimen, this reason is due to increasing surface area of GFRP bars (Ø10), minimum distance between bars and increasing the bond strength, between GFRP bars and concrete. Reinforcement ratio effective and GFRP bars for all slabs (same type) have nearly the same effect.
TABLE (3): FEM Results
Group Specimen
Cracking Stage Failure Stage Stiffness Ki (KN/mm)
Ductility Index (µd) %
Absorbed Energy (KN.mm) Pccr (KN) ∆cr (mm) Pf (KN) ∆f (mm) III
S3-1 33.49 3.10 183.5 28.47 10.80 8.184 3056.75 S3-2 51.80 4.20 259.0 32.40 12.33 6.714 4780.157 S3-3 73.40 6.60 367.0 53.76 11.12 7.145 11243.14 S3-4 45.76 4.80 162.0 28.50 9.533 4.937 2883.59 S3-5 38.90 3.50 137.7 19.25 11.11 4.500 1669.107 S3-6 44.35 3.83 243.0 39.10 11.57 9.209 5697.144
IV
S4-1 52.11 3.50 189.5 20.10 14.89 4.743 2142.94 S4-2 46.73 2.90 267.0 26.22 16.11 8.041 3953.185 S4-3 66.73 4.35 387.0 54.80 15.57 11.59 12966.01 S4-4 49.81 3.40 173.3 17.70 14.65 4.206 1782.54 S4-5 48.23 3.05 137.8 11.76 15.81 2.856 889.21 S4-6 48.11 3.40 263.6 35.30 14.15 9.382 5631.953
S5-1 58.36 2.97 203.0 14.42 19.65 3.855 1623.629
V
S5-2 54.48 3.50 259.9 33.1 15.57 8.474 4962.08 S5-3 68.83 3.50 393..3 33.17 19.67 2.708 7369.620 S5-4 49.65 2.80 175.0 13.50 17.73 3.821 1307.181
S5-5 63.05 3.37 136.0 9.30 18.41 1.759 699.51
S5-6 78.77 4.30 274.0 22.88 18.32 4.321 3611.541
S6-1 60.95 2.36 212.0 11.11 25.83 3.707 1324.17
S6-2 75.04 2.82 261.0 14.13 26.61 4.010 1922.89
VI
S6-3 73.33 3.50 419.0 35.4 20.95 9.114 8440.691
S6-4 58.80 2.30 168.0 8.24 25.56 2.582 830.053
S6-5 64.33 2.24 141.0 5.66 28.72 1.507 300.1554
S6-6 79.64 2.852 277.0 14.12 28.24 4.007 1993.20
S7-1 92.25 2.80 202.2 7.80 32.95 1.786 884.797
S7-2 76.76 2.09 267.0 9.90 36.73 3.737 1400.040
VII
S7-3 74.00 1.92 423.0 16.80 38.54 7.750 3793.943
S7-4 81.21 2.22 178.0 5.8 36.58 1.613 495.085
S7-5 104.25 2.76 139.0 4.2 37.77 0.522 166.10
S7-6 76.20 2.10 265.0 10.00 36.59 3.762 1196.87
International Journal of Civil and Structural Engineering Research ISSN 2348-7607 (Online) Vol. 8, Issue 1, pp: (161-172), Month: April 2020 - September 2020, Available at: www.researchpublish.com
S8-1 100.4 2.39 220.0 6.50 42.00 1.719 676.2717
S8-2 124.1 2.87 272.0 8.20 43.24 1.857 969.74
VIII
S8-3 121.1 2.71 421.0 14.10 44.68 4.203 3311.379
S8-4 63.25 0.92 183.3 4.20 68.75 3.565 334.53
S8-5 95.34 2.22 135.0 3.40 43.17 0.532 226.779
S8-6 47.77 2.30 273.0 23.20 20.77 9.087 3682.620
S9-1 69.86 1.96 243.0 9.47 35.64 3.832 1208.826
S9-2 80.21 2.40 279.0 12.30 33.42 4.125 1702.194
IX
S9-3 119.46 2.89 415.5 15.30 41.33 4.294 3238.01
S9-4 56.64 1.96 197.0 9.50 28.89 3.847 901.47
S9-5 39.39 2.39 137.0 12.30 16.48 4.146 861.3653
S9-6 81.94 2.80 285.0 15.40 29.26 4.500 2488.241
S10-1 109.5 2.67 240.0 7.60 41.01 1.066 950.595
S10-2 83.10 2.00 289.0 10.10 41.55 4.000 1519.789
X
S10-3 117.59 2.39 409.0 12.40 49.20 4.188 2570.1386
S10-4 60.37 1.64 210.0 7.60 36.81 3.569 837.042
S10-5 41.11 2.00 143.0 10.00 20.55 4.000 700.253 S10-6 51.45 1.44 294.0 12.41 35.73 7.618 1837.77
S11-1 71.30 1.86 248.0 6.10 52.43 3.485 583.766 S11-2 79.40 1.66 277.0 8.10 47.83 3.879 1196.094
IIX
S11-3 126.2 1.96 439.0 10.00 64.39 4.102 2685.001 S11-4 64.87 1.36 225.0 6.20 47.69 3.558 849.36
S11-5 43.40 1.66 151.0 8.10 26.14 3.879 566.76 S11-6 105.42 2.43 301.2 9.85 43.38 3.053 1426.279
3.1 Load-Deflection Relationship:
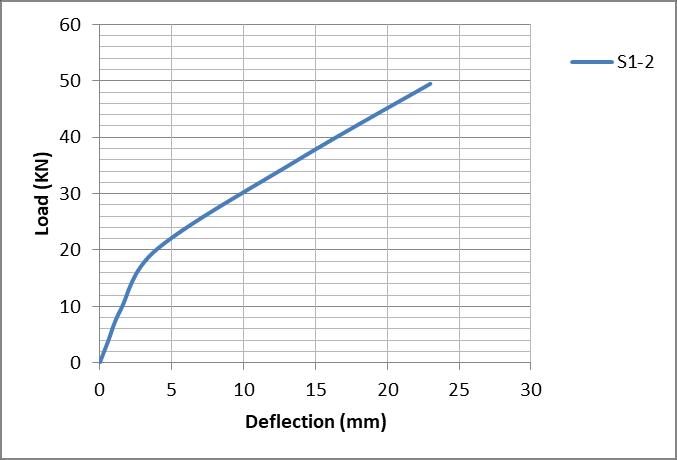
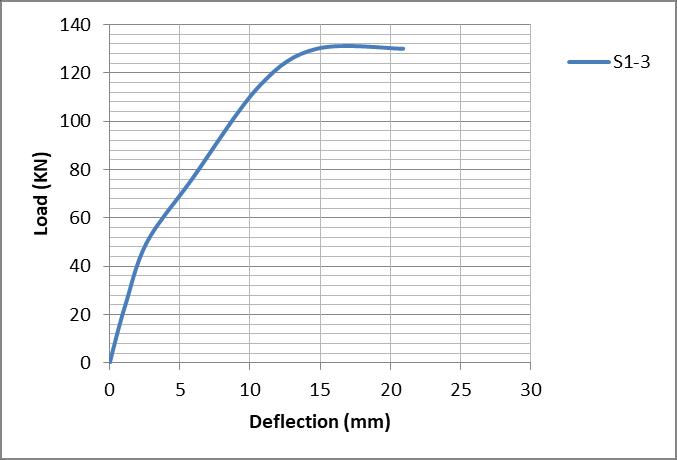
Figure (9) to Figure (14) show The load deflection curves for slabs have almost the same profile where the first part of the curves are steep, and after cracks, most of profiles started to be more curved till the failure occurred. The measured values of the deflection at the bottom mid-span surface of the investigated slab and plotted versus the applied load from zero loading up to failure.
Fig 9: Load deflection curve (S-1-1)
Fig 10: Load deflection curve (S-1-2)
Research Publish Journals

International Journal of Civil and Structural Engineering Research ISSN 2348-7607 (Online) Vol. 8, Issue 1, pp: (161-172), Month: April 2020 - September 2020, Available at: www.researchpublish.com
Fig 11: Load deflection curve (S-1-3)
Fig 12: Load deflection curve (S-1-4)
Fig 13: Load deflection curve (S-1-1)
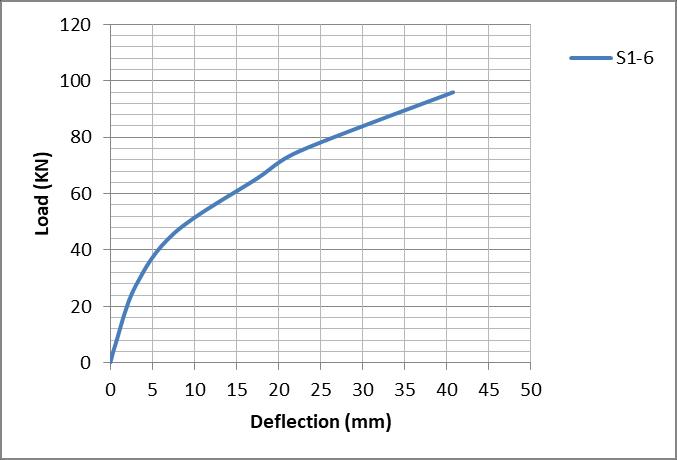
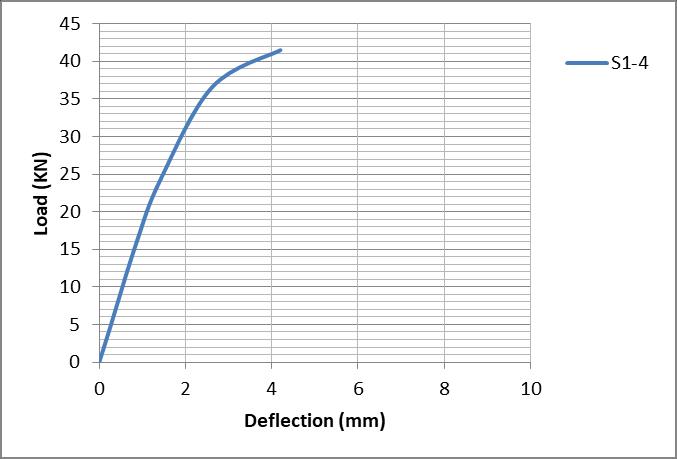

Fig 14: Load deflection curve (S-1-2)
Slabs has almost the same profile of the load deflection curves for where the first part of the curves are steep, and after cracking, most of the profiles start to be more curved until the failure occurs. The measured values of the deflection at the mid-span of the bottom surface of the investigated slab and plotted versus the applied load from loading starting to failure. The process of crack formation can be classified into three stages. The un-cracked stage is before the limiting tensile strength is reached, the crack formation occurs in the process zone of a potential crack with lessening tensile stress on crack face due to crack bridging effect and finally, after a complete release of the stress, the crack opening continues without the stress. The concrete tension failure is characterized by a piecemeal growth of cracks, which connect together and eventually disconnect larger parts of the structure.
Cracking is represented in the ANSYS program by a circle outline in the plane of the crack, while the crushing is shown with an octahedron outline. The first crack is shown with a red circle outline at integration point, the second crack with a green outline, the third crack with a blue outline and closed cracks are shown as X inside the circle which shown in Figure (15).

Fig 15: Symbols used by ANSYS to represent cracking and crushing
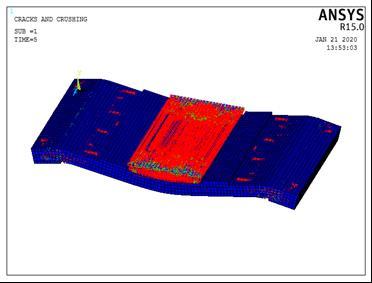
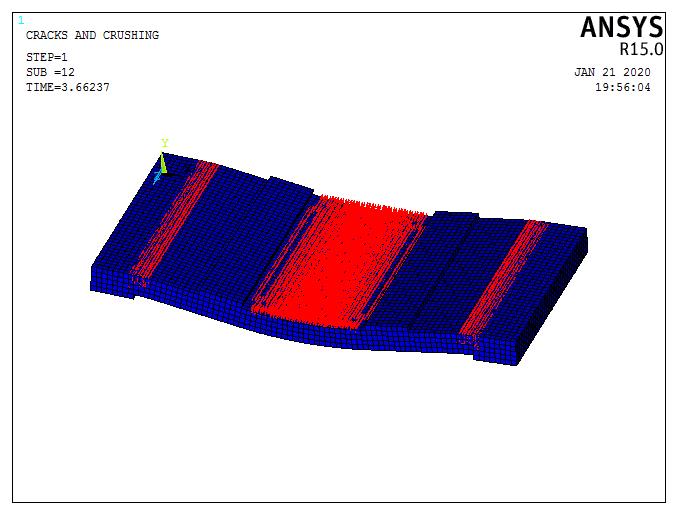
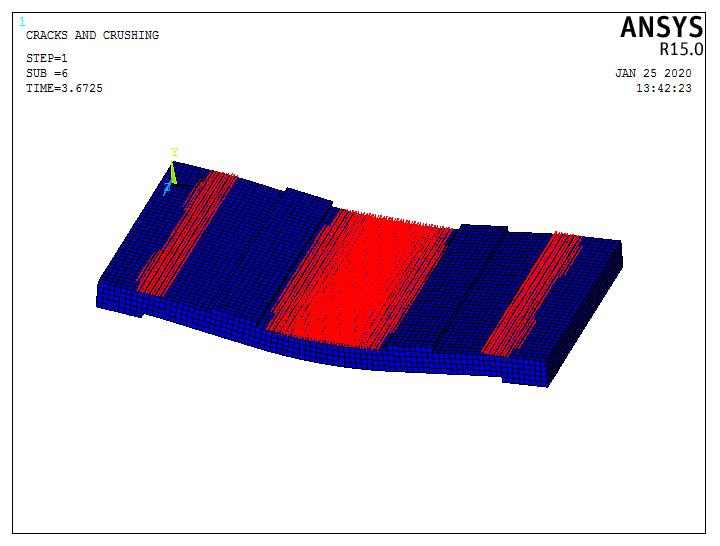
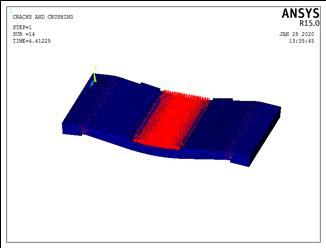
Figure (16) shows evolutions of crack patterns obtained from the finite element analyses developing for each slab of Group (I) at the last converged loading step, this group consist six slabs, The final loads for all slabs are the last converged load steps from ANSYS, after the final loads, the slab models have very large deflections resulting in unconverged solutions. This is the criterion used to define failure for the models. The appearance of the cracks reflects the failure modes for the slabs.
International Journal of Civil and Structural Engineering Research ISSN 2348-7607 (Online) Vol. 8, Issue 1, pp: (161-172), Month: April 2020 - September 2020, Available at: www.researchpublish.com
For example, the first crack foe Specimen S1-1 was a small longitudinal crack observed in a short direction observed at a load of 29.13 kN in tension side at mid span of slab, and was accompanied by an increase in deflection due to stiffness reduction of the specimen. With increasing load many cracks are developed on the bottom of the slab (tension side). The model failed abruptly at load of 50.0 kN, the crack pattern is shown in Fig. (16).
Specimen S1-1
Specimen S1-2
Specimen S1-3
Specimen S1-4
International Journal of Civil and Structural Engineering Research ISSN 2348-7607 (Online) Vol. 8, Issue 1, pp: (161-172), Month: April 2020 - September 2020, Available at: www.researchpublish.com
Specimen S1-5
Specimen S1-6
Fig 16: Crack pattern for group (I)
3.2 Discussion of Test Results:
For group (I) for example we can see that, for specimens (S1-1, S1-2 and S1-3) which reinforced with steel bars increased in their failure load capacity than the specimens (S1-4, S1-5 and S1-6) which reinforced with GFRP rebars because of the stiffness of GFRP reinforced concrete slab was significantly lower than it for the steel sample reinforced with the same area of reinforcement as shown in figure (17).
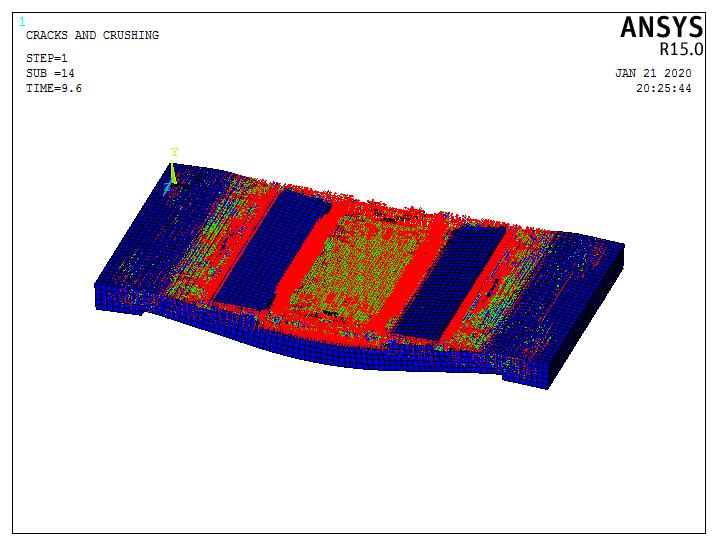
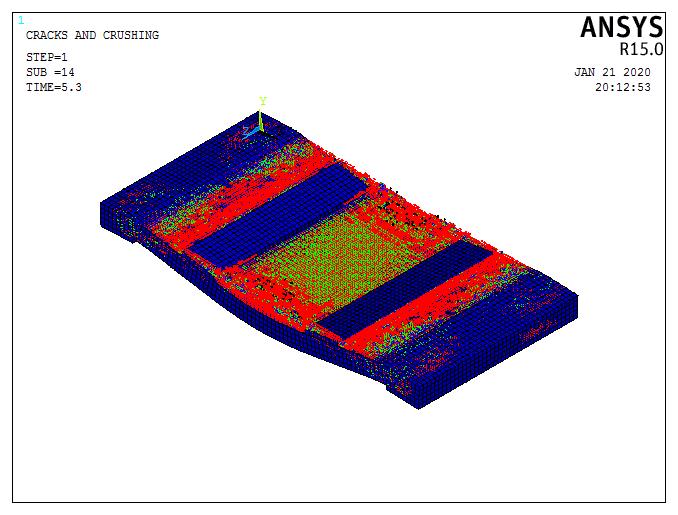
Fig 17: Load-Deflection Curves for Group (I)
International Journal of Civil and Structural Engineering Research ISSN 2348-7607 (Online) Vol. 8, Issue 1, pp: (161-172), Month: April 2020 - September 2020, Available at: www.researchpublish.com
III. CONCLUSION
1-The analytical results obtained by using ANSYS program shown a good agreement in the failure loads with the comparative experimental results but it show different results in deflections.
2- Comparing the failure loads of the slabs reinforced with the same cross sectional area of steel bars by GFRP rebars, there was 25% increase in the failure load of steel reinforced slabs. This increase was due to lack of dowel action of GFRP bars and low elastic modulus of GFRP bars in comparison to steel bars.
3- The load deflection curve behavior of concrete slabs reinforced with GFRP rebars up to cracking followed by an approximately was linear with lower stiffness before cracking and then a softer linear part from cracking to failure.
4- The stiffness of GFRP reinforced concrete slab was significantly lower than it for the steel sample reinforced with the same area of reinforcement after cracking, consequently, larger crack, deflection and strains. Increasing the area of the reinforcement of GFRP rebars.
5- Deflections of slabs reinforced with GFRP bars are significantly larger than slabs reinforced with conventional steel bars there was 30% increase in the deflection of GFRP reinforced slabs. This due to the low elastic modulus of GFRP bars in comparison to steel bars.
REFERENCES
[1] Alkhrdaji, T., L. Ombres and A. Nanni, (2000) “Flexural Behavior and Design of One-Way Concrete Slabs Reinforced with Deformed GFRP Bars,” Proc., 3rd Inter. Conf. on Advanced Composite Materials in Bridges and Structures, Ottawa, Canada, J. Humar and A.G. Razaqpur, Editors, pp. 217-224.
[2] Nasser F. H., (2015). “Structural Behavior of Light Weight Concrete Slab Panels Reinforced with CFRP Bars.” Ph.d. Thesis of Babylon University, Babylon. March, pp.202.
[3] Qusai S. A., (1995). “ Properties of Light Weight Concrete Made From Local Porcelenite Aggregate.” M.Sc. Thesis University of Baghdad, Baghdad, April, pp.117
[4] Abbasi, M.S.A., Baluch, M.H., Azad, A.K. and Abdel-Rahman. H.H..,(2008), “ Nonlinear Finite Element Modelingof faluire Modes in Reinforced Concrete Slabs”, Journal of Computers and Structures, Vol.42, No. 5,pp. 815-823.
[5] American Concrete Institute (ACI) State-of-the-Art Report (1999),"Provisional Desing Recommendations for Concrete Reinforced with FRP Rebar's "Draft document.
[6] Abd Elnaby, S.F. (1998), "State of the art report on the Use of fiber reinforced bolymers for reinforcing concrete elements" State of the Art Report, Faculty of Engineering, Helwan University, September 1990, p.34
[7] Abdallah, H., El-Badry, M, and Riskalla, S.(1996),"Behavior of concrete slabs Reinforced by GFRP", Advanced Composite Materials, State-of-the-Art Report, The First Middle East Workshop on the Structural Composite, Ain Shams University by The Egyptian Society of Engineers. Sharm El-Sheikh. Egypt. June 1996, PP. 229-226.
[8] American Concrete Institute (ACI) State-of-the-Art Reporte (2006)."Fiber Reinforced plastic (FRP) Reinforced for Concrete Structures, Report by ACI Committee.440.
[9] Benmokrane, B., Tighiouart B., Chaallal O., (1996) "Bond strength and load distribution of composite FRP rebars in concrete" ACI Mater. J.1996;96(3):246-53.
[10] Benmokrane, B. and Masmoudi, R.(1996), "FRP C-bar Reinforcing Rod for concrete Structures", Advanced Composite Materials in Bridges and Sturctures (ACMBS-I1), proceedings of the 2nd International Conference, Montreal, Quebec, Canada, pp.181-188.
[11] Benmokrane B., Chaallalt O. And Masmoudi R., (2005) "Glass Fiber Reinforced Plastic (GFRP) Rebars for Concrete Structures" Construction and Building Materials, Vol. 9, No. 6, pp. 353-364.
[12] Bedard, Claude (1992), "Composite Reinforcing Bars: Assessing Their Use in Construction" Concrete International, Vo1.14, no.1, pp.55-59.
[13] Consenza, E., Manfredi , G., and Realfonzo, R.(1996) ,"Il Calcolo Della Lunghezza di Anchoraggio per Barre in plastic Fribro- Rinforzata (FRP)", Proceedings of the 11th Congresso CTE, Napoli, 7-9Nov. 1996, pp.451-461.
