
International Journal of Civil and Structural Engineering Research ISSN 2348-7607 (Online) Vol. 8, Issue 1, pp: (173-181), Month: April 2020 - September 2020, Available at: www.researchpublish.com
Condition Assessment and Deterioration Prediction of RC Structures
sheriff 4(1)Associate Professor of Project Management, faculty of engineering at Mataria, Helwan University, Cairo, Egypt.
(2) Assistant Lecturer at Housing and Building National Research Center, Cairo, Egypt.
(3) Professor of R.C Structure Housing and Building National Research Center, Cairo, Egypt.
(4) Professor of R.C Structures, faculty of engineering at Mataria, Helwan University, Cairo, Egypt.
Abstract: Condition assessment is very important to determine the best repair action but it is not an easy to evaluate the condition of a structure accurately because of the assessment of an existing structure usually suffers from the limited data and imprecise theoretical models, also because of any experiment or test on an existing structure need to be non-destructive test. Infrastructure is suffered from continuous ageing effects. Deterioration or degradation is inevitable process for all building elements. The main problem is how they deteriorate and at what rate. Reliable inspection and observation tools are therefore an increasing demand. The diagnosis and the evaluation of current conditions and residual service life of existing structures are key aspects of concrete structure management This paper discusses predicting surface condition of each element during building service life and over all building condition by using a Marcovian model. The condition assessment accurately evaluates the effect of building elements, depending on the current condition assessment; the proposed deterioration model predicts the future deterioration of the elements for each year in the building life cycle. As follows, the present and the future deteriorations are monitored by the proposed framework and used to get the best repair options.
Keywords: Condition assessment, Marcovian model, service life, building life cycle, element deterioration, deterioration index, future deteriorations, rehabilitation.
1. INTRODUCTION
Life-cycle assessment and evaluation methods can be beneficially used to assess existing structures: actions on structures, inspection-oriented design and construction, characteristics of elements and overall performance of structures. Safety assessment and the structure performance of a structure over its life cycle are important factors which have to be considered. Safety assessment of engineering works must be conducted by examining their behavior and all possibilities of failure which can be appeared (Kurz et al., 2012). A reliable diagnosis of the condition and behavior of a structure is an important basis for an effective service life management. In order to determine proper in time for repair in the life-time of a structure, the deterioration process at exposed regions as well as a detailed knowledge about the current condition of the whole structure is essential (Council et al., 2009)
To predict the deterioration of the element, its probability of transition from one condition state to another should be accumulated over discrete time intervals. To predict the deterioration of the element, its probability of transition from one condition state to another should be accumulated over discrete time intervals. In this model, a transition probability matrix was developed. Markovian deterioration model is based on the concept of defining states in terms of building condition ratings and obtaining the probabilities of a building condition changing from one state to another. It should be noted that the transition matrix (and accordingly, the deterioration behavior) is greatly affected by the service condition (or the environment) to which the building element is exposed (Singh Ahluwalia, 2008) In case of RC buildings, applying Marcov chain (probability matrix) to predict surface condition of concrete for each element (column, beam and slab) and Total degradation index of the building will be discussed.
Page | 173 Research Publish Journals
Ahmed Mohammed Abdelalim 1 , Nahla Ali Mohamed fahmy 2 , Hatem Hamdy Ghith 3 , Alaa Gamal
International Journal of Civil and Structural Engineering Research ISSN 2348-7607 (Online) Vol. 8, Issue 1, pp: (173-181), Month: April 2020 - September 2020, Available at: www.researchpublish.com
To verify and test the suggested methodology, a real model (case study) was chosen in order to apply the proposed method. The model is a building consisting of a ground and four typical floors. It indicates various damage features. After 16 years of its construction an assessment committee was formed to evaluate the structural performance of it and to decide the deserved rehabilitation technique.
2. STRUCTURAL CONDITION ASSESSMENT
Structural condition assessment is an evaluation of a structure or part of it to verify its capability to meet a stated purpose. It is the physical examination and diagnosis of the health of a structure. The activities of assessment interact with each other to serve the objectives of evaluating the condition of each element of building. The evaluation mechanism defines measurable criteria that can be easily assessed during the physical inspection.
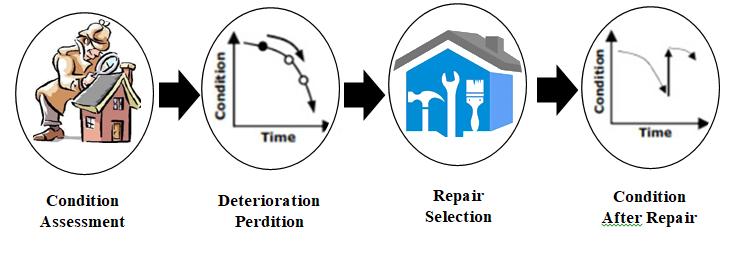
In addition to visual observations a structural condition assessment may require testing, fulfillment or calculations. The expert generally has varied perceptions of the condition of the element in this process. The proposed framework is developed with many functions, as shown in figure 1
Figure 1: Components of Proposed Framework
A visual system that would support field inspection is needed to design and implement the proposed system. An initial study was carried out by collecting a database of tests and visual inspection reports. Afterwards, possible system design was investigated to implement the visual system. Details are provided in the following subsections. There are several steps necessary to reach an accurate condition assessment. These steps were determined as follows:
Visual Inspection: This step aims at deciding the appropriate investigations and tests required to quantify the damage of RC elements In this step images of each element should be taken.
Structural Assessment of RC Elements (based on the derived results of Compressive Strength and structural analysis). This step aims to evaluate the structural performance and to quantify the damage of RC elements
Calculate the Damage Indices for each category (Slabs of all floors, Columns of all floors and Beams of all floors). This step aims at using the available test results and active excel sheets containing design equations to calculate damage indices of RC elements and over all damage index.
Predicting Surface Condition and Future Behavior of Concrete based on Performance Indices. This step aims at using the available data in prediction of future behavior of RC elements using Markovian model and damage indices like Carbonation Depth
Improving condition of building after repair selection.
3. RATING SCALE
After building assessment the condition rating for each element is used to determine the current condition of building. A rating system that minimizes subjective evaluation is repeatable and can be effectively used to predict future condition. The values of the condition indices provide the means of comparing the condition of elements. The condition indices scale and linguistic representation for building elements is usually varies from country to other one whether it can be inferred from the numeric values or alphabets According to (Yacob et al., 2016)
Page | 174 Research Publish Journals
International Journal of Civil and Structural Engineering Research ISSN 2348-7607 (Online) Vol. 8, Issue 1, pp: (173-181), Month: April 2020 - September 2020, Available at: www.researchpublish.com
A four-point scale proved to be most effective meanwhile a three point scale is too weak for reliable results, while a seven-point or more scale is too fine and difficult for assessment staff to describe the condition (Abbot, 2007) (Agrawal, Kawaguchi and Chen, 2010) described a 7 scale condition rating used to calculate the deterioration rates for each bridge element. Bridge condition rating scale ranges from 7 to 1, 7 being new and 1 being failed condition.
In this paper each element of the building is assigned as a set of four states (satisfactory, Fair, Poor, and serious conditions). This condition assessment rating also links to the maintenance actions. During inspection, the user can easily categorize the elements according to its condition, as shown table 1
Table 1: Five Point Scale for Element Condition
stage Physical Condition Action Matrix
1 Satisfactory Satisfactory Condition, some minor deterioration for major maintenance.
2 Fair Fair Condition, Minor Section Loss, Cracking or Scouring for minor Rehabilitation, Minor Rehabilitation is needed
3 Poor Poor Condition, Advanced section loss, deterioration, Spalling or Scouring for major Rehabilitation, Major Rehabilitation is needed.
4 Serious condition Serious Condition, Section Loss, Deterioration, Spalling or Scouring has seriously affected primary Structural components, Immediate Rehabilitation is needed.
4. SERVICE LIFE PREDICTION OF STRUCTURE
The service life is time period during which a structure or any it's part satisfy design performance requirements without unexpected costs or disruption due to maintenance and repair. The service life of reinforced concrete structures can be divided into two time periods. First is named as initiation period (ti), i.e. the time from concrete casting to the moment when the reinforcement is no longer passivated. Second, the propagation period (tp), during this time the corrosion of the depassivated steel takes place, and consequently, the failure probability is increased for both the load and service ability limit states (František et al., 2014)
Several researchers estimated residual service life of structures based on carbonation and chlorination process by dividing service life in different phases. (Pan and Wang, 2011) evaluated the service life of RC Structures in three Key steps, namely chemical ingress, steel corrosion and concrete cracking. In this case study it appear through visual inspection that there is no source of chloride penetration, and petrographic analysis of extracted cores showed that chloride concentrations within acceptable limits. Thus, residual service life was assessment based on carbonation process
5. PREDICTING CONDITION RATING AND SURFACE CONDITION OF CONCRETE DURING BUILDING'S LIFE CYCLE BY (MARCOV CHAIN)
To predict the deterioration of the element, its probability of transition from one condition state to another should be accumulated over discrete time intervals. The most commonly used stochastic technique for infrastructure deterioration is the Markov chain model (Abdelalim, 2019)
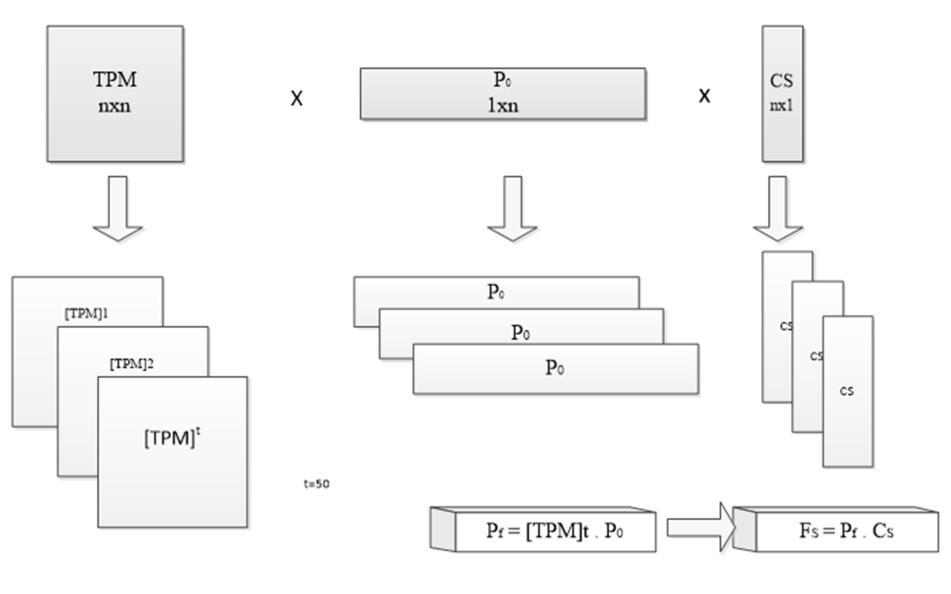
In this paper, Markov chains were applied to predict the state of each element in the building. To predict the deterioration of the element, its probability of transition from one condition state to another should be accumulated over discrete time intervals.Define the transition probability matrix [TPM] with values that represent the probabilities to move from one condition state to another. If the [TPM] has ten states, the [TPM] is a 10x10 square matrix. So, element condition in future can be predicted at any time. Future state row vector at any time [Pf] can be calculated by multiplying the initial probability row vector [Po] by the transition probability matrix [TPM] raised to the power (t), as shown figure 2.
To get the value of the future state FS, the future state row vector should be multiplied by the condition state column vector [Cs], equation1.
Fs = [Pf ]1xn . [Cs]nx1 …. (1)
So condition state can be predicted at any time (t) during building life cycle. Excel sheet modeling for Markov Chains was developed by incorporating all the formulation on its cells.
Page | 175 Research Publish Journals
International Journal of Civil and Structural Engineering Research ISSN 2348-7607 (Online) Vol. 8, Issue 1, pp: (173-181), Month: April 2020 - September 2020, Available at: www.researchpublish.com
Figure 2: General layout for the Markov Chains Spreadsheet
6. FUTURE DETERIORATION OF BUILDING ELEMENTS
Deterioration modeling is not a simple task, particularly due to: (1) the unforeseen parameters (other than age) that may affect the deterioration of the element; (2) the serious lack in historical data even for known parameters that affect element deterioration; and (3) the variability in deterioration behavior even among similar elements. To account for the previous challenges and to improve the accuracy of deterioration prediction a Marcov Chain spread sheet shown in figure 2 was created to predict deterioration behavior of each element through three stages:
1. Generate for each element type (Column, beam, slabs) an actual deterioration curves from condition assessment data.
2. Generate for each stage (stage 1, stage2, stage3 and stage 4) a deterioration curve that is the same as the average deterioration curve, but customized to specific data that relate to that element.
3. Utilize the custom deterioration curve for the element to predict its future deterioration indices (DIs).
To allow consistency among the condition values of various building elements, Deterioration Indices (DI)s of all elements is used in this study. The (DI) ranges differ according to element type (slab, column, beam) from (0 to 100) where (DI) of 0 implies minimum deterioration (excellent condition), while a (DI) of 100 implies maximum deterioration or extremely critical condition. The (DI) range is divided into 4 divisions representing four stages.
Optimizing the [P] Probabilities: With the arbitrary nature of the initial [TPM] probabilities, it is likely to produce incorrect (DI) predictions. However, as the model is set up with all the internal calculations that will automatically provide correct predictions given accurate [P] probabilities, the model has the ability to function as an optimization model, in which the variables are the diagonal values in the [TPM] matrix.
The objective of the optimization model is to determine the best [P] values (variables) so that the Markov-predicted deterioration curve coincides with the actual deterioration curve. minimize the total error between Markov-predicted deterioration indices (DI(M)) and the Actual measured (DI(A)), summed along the age (A) of the element being considered, as follows:

∑ | | …. (2)
where, t = 1,2,3,…,50
Subject to:
DIM = [ ] [ ] [ ] …. (3)
Page | 176 Research Publish Journals
International Journal of Civil and Structural Engineering Research ISSN 2348-7607 (Online) Vol. 8, Issue 1, pp: (173-181), Month: April 2020 - September 2020, Available at: www.researchpublish.com
where, [CS] and [Po] are constant matrices.
In addition, an additional constraint can be used to customize the [TPM] for a specific element with a known (measured DI) at any time. In this case, the error between predicted (DI) and actual (DI) should equal to 0 (i.e., the model should correctly estimate the actual measured values for the element degradation index), as follows:
DIP - DIA = 0 …. (4)
The variables are the diagonal probability values in the [TPM] matrix, which take real values between 0 and 1 (Equation 5).

Predicted DI after t years = [ ] [ ] [ ] …. (5)
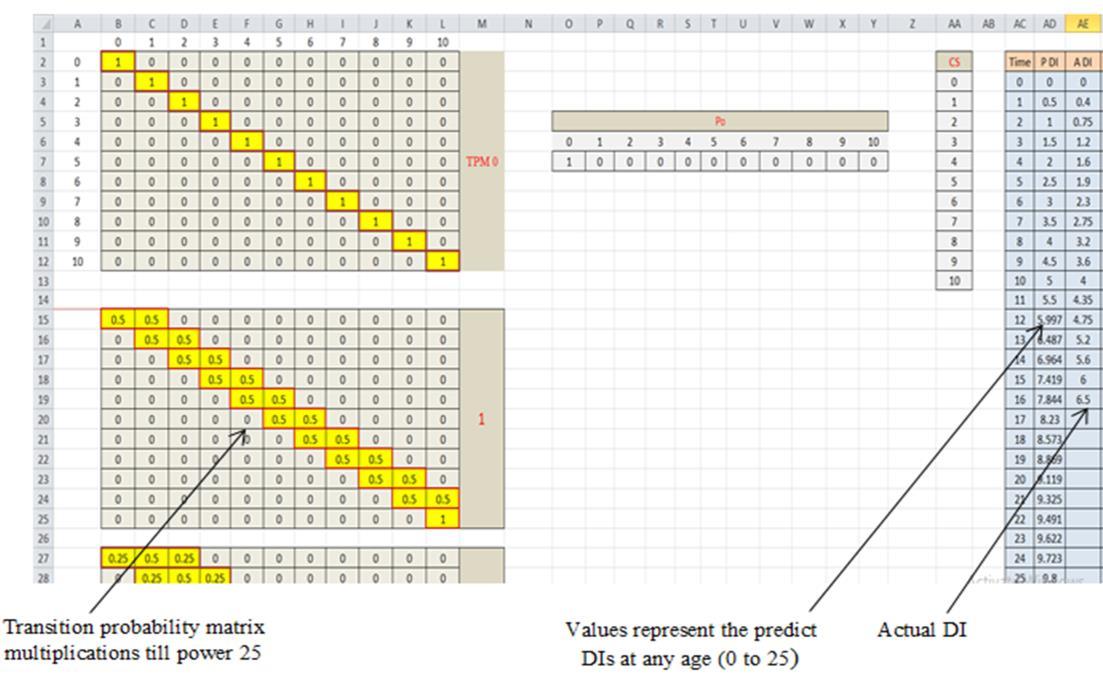
The implementation of the [TPM] optimization model was carried out on a spreadsheet, as shown in figure 3. Column (AD) shows the Markov predicted (DIs) at each age. Column (AE) shows the desired deterioration curve.
Figure 3: Spreadsheet Model for Markov Chains
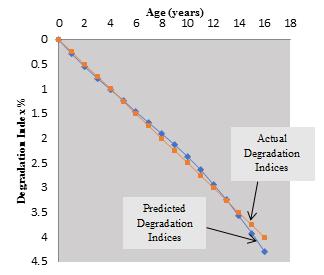
The actual and the predicted degradation indices values were recorded in tables 2,3 for beams and slabs stage 1 then the relationship between age and (DIs) for both Markov and Actual deterioration were also plotted in figures 4,5 The Markov predictions were based on initial probabilities of 0.5s in the diagonal [TPM] values. After the optimization was completed, optimum [TPM] values were obtained as shown in figure 3 with Markov predictions becoming very close to the actual (DIs). The optimization did not consider the additional constraint for customizing Markov prediction for a specific element. Considering this case in a new optimization run, a more accurate prediction curve that passes through the actual (DI) records of that element was obtained.
After the optimization was completed, optimum [TPM] values were obtained with Markov predictions becoming very close to the actual (DIs). The optimization did not consider the additional constraint for customizing Markov prediction for a specific element. Considering this case in a new optimization run, a more accurate prediction curve that passes through the actual (DI) records of that element was obtained.
In this spread sheet model non-linear programming problem (NLP) was solved using SOLVER that comes with Excel software which used to optimize the probabilities of the Macov Chain matrix. the objective function, constraints, and variables of the optimization problem are the solver's inputs. For NLP problems, Excel SOLVER uses the Generalized Reduced Gradient (GRG) method (El Hakeeem, 2005).
Page | 177 Research Publish Journals
International Journal of Civil and Structural Engineering Research ISSN 2348-7607 (Online) Vol. 8, Issue 1, pp: (173-181), Month: April 2020 - September 2020, Available at: www.researchpublish.com
Table 2: Actual and Predicted Degradation Index for Beams Stage 1
Time Predicted D.I Actual D.I Error 0 0 0 0 1 0.285559 0.25 0.035559 2 0.548397 0.5 0.048397 3 0.79225 0.75 0.04225 4 1.021778 1 0.021778 5 1.24195 1.25 -0.00805 6 1.4578 1.5 -0.0422 7 1.674319 1.75 -0.07568 8 1.896403 2 -0.1036 9 2.128811 2.25 -0.12119 10 2.375989 2.5 -0.12401 11 2.64169 2.75 -0.10831 12 2.928514 3 -0.07149 13 3.237523 3.25 -0.01248 14 3.568063 3.5 0.068063 15 3.917829 3.75 0.167829 16 4.283126 4 0.283126 17 4.659269 18 5.04102 19 5.423006 20 5.800082 21 6.167596 22 6.52157 23 6.85879 24 7.176836 25 7.474047 0
Table 3: Actual and Predicted Degradation Index for Slabs Stage 1 Time Predicted DI Actual DI Error 0 0 0 0 1 0.276283 0.25 0.026283 2 0.538162 0.55 -0.01184 3 0.785512 0.8 -0.01449 4 1.021531 1.1 -0.07847 5 1.250696 1.35 -0.0993 6 1.478072 1.65 -0.17193 7 1.708982 1.8 0.528982 8 1.948735 2.15 0.798735 9 2.202423 2.4 -0.19758 10 2.474321 2.7 -0.22568 11 2.766898 2.95 -0.1831 12 3.079945 3.2 -0.12006 13 3.410251 3.45 -0.03975 14 3.751975 3.7 0.051975 15 4.097531 4 0.097531 16 4.438684 4.3 0.138684 17 4.76758 18 5.077528 19 5.363452 20 5.622062 21 5.851767 22 6.052447 23 6.225144 24 6.371731 25 6.494606 0
Research Publish Journals
Page | 178
International Journal of Civil and Structural Engineering Research ISSN 2348-7607 (Online) Vol. 8, Issue 1, pp: (173-181), Month: April 2020 - September 2020, Available at: www.researchpublish.com
Figure 4: Degradation Curve for Beams Stage 1 Figure 5: Degradation Curve for Slabs Stage 1
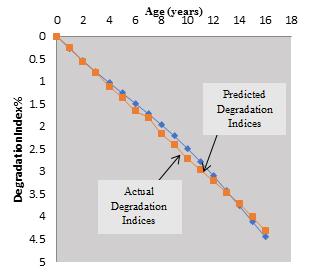
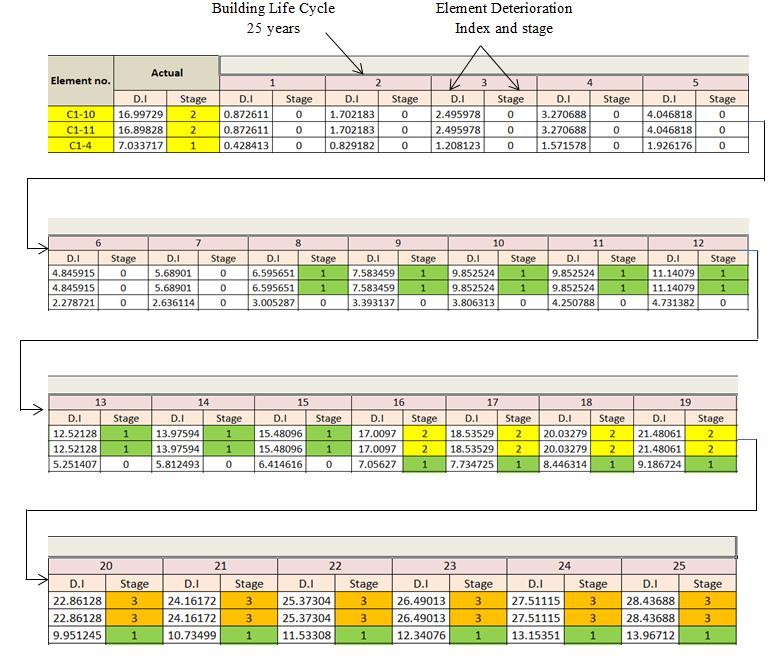
So it is possible to know the condition of each element during the building life cycle and then knowing the overall condition of the building from the year of construction and up to 25 years of construction, as an example three columns from ground floor in the figure 6
Figure 6: The Condition of the Building Element During its Life Cycle
Table 4 summaries the percentage of each stage and damage indices of columns, beams, slabs, total damage index and total damage index from Marcov chain model. From these results it is clear that Because of the high contribution of concrete strength in columns compared with beams and slabs, the indices of R.C columns exceed those of other elements, also it can be observed that actual overall degradation index of the building from inspection data is close to the overall degradation index from Marcov chain Model
Page | 179 Research Publish Journals
Table
7. REPAIR ACTION BASED ON EFFICIENCY, MOST DETERIORATED ELEMENT AND LIFE CYCLE COST ANALYSIS
In case of no repair action during building life cycle the result will be continuous degrading. Degradation index will increase with time based on Marcov Chain deterioration model figure 7.
0 5 10 15 20 25 Degradation Index %
0 5 10 15 20 25 30 35 40 45 50
Figure 7:
Degradation Curve of


Building Assume that the building will be repaired to improve its condition from DI= 30% to DI= 7% After repair the building behavior must be observed and record to conclude the new Marcovain model after repair to predict the behavior of building again as before. Now it can be assumed that the behavior after repair is the same before repair, as shown in figure 8
Age (year) Parallel deterioration curves
Figure
Repair Before-repair deterioration
Age (year) 0 5 10 15 20 25 30 35 40 45 50
After-repair deterioration
0 5 10 15 20 25 30 35 40 Deterioration Index %
8: Degradation Curve due to Repairing at Year 16 after Construction
Upgrading the building condition depend on the available fund of repair, then the marcovain model should be divided into two separate time intervals before repairing and after it.
Page | 180 Research Publish
International Journal of Civil and Structural Engineering Research ISSN 2348-7607 (Online) Vol. 8, Issue 1, pp: (173-181), Month: April 2020 - September 2020, Available at: www.researchpublish.com
Journals
4: Percentage of each Stage, Damage Indices and Total Damage Index Elements Stage 1% (Satisfactory condition) Stage 2% (fair condition) Stage 3% ( Poor condition) Stage 4% ( Serious condition) Damage index % Columns 0.393 0.36 0.18 0.06 15.8 Beams 0.363 0.366667 0.2 0.06 8.81 Slabs 0.366667 0.36 0.2 0.07 6.9 Total Damage Index 31.521% Total Damage Index from Marcov Chain Model 30.13%
International Journal of Civil and Structural Engineering Research ISSN 2348-7607 (Online) Vol. 8, Issue 1, pp: (173-181), Month: April 2020 - September 2020, Available at: www.researchpublish.com
8. CONCLUSION
This research aimed to develop an integrated framework for inspection, evaluation and prediction Planning of RC buildings during its service life. Research conducted throughout this study explored supplementing current building inspection techniques with the numerical documentation of damage index to better depict the true condition of existing building and to predict the building condition in the future
1. Detailed methodology for condition assessment, condition evaluation and decision-making has been developed. An inclusive process of integrating these procedures in a systematic way is important for the treatment of existing defective concrete structures.
2. Stochastic procedures like Markov Chains Deterioration Models, MCMC, are used in life prediction of RC structures. Not only this, but also determine previous history of deficiencies.
3. Documenting the deterioration model in an inspection can be significant in determining the structural adequacy of a building element and can affect the guidelines for determining the repair time of the current building.
REFERENCES
[1] Kurz, J., (2012) ‘Condition assessment of reinforced concrete structures using automated multi-sensor systems’, in: 18th World Conference on Nondestructive Testing. pp.8.
[2] Abbot, G.R., (2007). 'Building condition assessment: A performance evaluation tool towards sustainable asset management'. CIB World Building Congress, pp. 649–662.
[3] Abdelalim, A. M. (2019) ‘A novel diagnostic prognostic approach for rehabilitated RC structures based on integrated probabilistic deterioration models’, International Journal of Decision Sciences, Risk and Management. Inderscience Enterprises Ltd, 8(3), pp. 119–134.
[4] Agrawal, A. K., Kawaguchi, A. and Chen, Z. (2010) ‘Deterioration rates of typical bridge elements in New York’, Journal of Bridge Engineering. American Society of Civil Engineers, 15(4), pp. 419–429.
[5] Council, N. R. (2009) Sustainable Critical Infrastructure Systems: A Framework for Meeting 21st Century Imperatives: Report of a Workshop. National Academies Press.
[6] Elhakeem, A.A.M., (2006) 'An asset management framework for educational buildings with life-cycle cost analysis', University of Waterloo (Canada).
[7] Škvára F., Šcul R., Tišler Z, Skřičík P.,Šmilauer V. and Cílová Z (2014) ‘Preparation and properties of fly ashbased geopolymer foams’, Ceramics-Silikaty, 58(3), pp. 188–197.
[8] Liang M., Huang R., Feng S., Yeh C (2009) ‘Service life prediction of pier for the existing reinforced concete bridges in chloride-laden environment’, Journal of Marine Science and Technology. 17(4), pp. 312–319.
[9] Pan, T. and Wang, L. (2011) ‘Finite-element analysis of chemical transport and reinforcement corrosion-induced cracking in variably saturated heterogeneous concrete’, Journal of Engineering Mechanics. American Society of Civil Engineers, 137(5), pp. 334–345.
[10] Singh Ahluwalia, S. (2008) ‘A framework for efficient condition assessment of the building infrastructure’. University of Waterloo.
[11] Straub, A. (2009) ‘Dutch standard for condition assessment of buildings’, Structural Survey. Emerald Group Publishing Limited.
[12] Yacob, S., Ali, A. S. and Peng, A.-Y. C. (2016) ‘Building Condition Assessment: Lesson Learnt from Pilot Projects’, in MATEC Web of Conferences, pp. 72.
Page | 181 Research Publish Journals