International Journal of Civil and Structural Engineering Research ISSN 2348-7607 (Online) Vol. 8, Issue 1, pp: (182-191), Month: April 2020 - September 2020, Available at: www.researchpublish.com
Seismic Performance of Multi-Simple Span Bridges with Link Slabs
Nagi F. Hanna1, Ahmed A. Rashed2, Magdy M. Genedy3 , Ahmed M. Bohout4
1Professor, Civil Eng. Dept., Helwan University, Cairo, Egypt
2Professor, Civil Eng. Dept., Cairo University, Cairo, Egypt
3Assistant Professor, Civil Eng. Dept., Helwan University, Cairo, Egypt
4Structural Engineer, M.Sc. of Structural Eng. Researcher, Helwan University, Cairo, Egypt
Abstract: Multi simple-span bridges form a majority of crossings used in the highway system. A typical span has a reinforced concrete deck over precast I-girders. Span lengths range from 15 to 35 meters. Expansion joints are introduced between each two adjacent spans to allow deck movements induced by temperature variation, creep and shrinkage. However, having expansion joints between adjacent spans develops costly maintenance problems.
The main issues that generate the need for maintenance are:
Water leakage through expansion joints; water leakage through the expansion joints can cause deterioration of bearings, decks, girder ends, and cap beams.
Accumulation of debris in the joints; accumulated debris in the joints can restrain deck expansion and can cause undesirable damages to the structure.
Damage and loss of function caused by impact of heavy trucks; impact induced by dynamic effects of heavy truck loads can delaminate the expansion joint concrete.
Another disadvantage of the expansion joints is the noise emission. Residents next to highway and bridges suffer from noise caused by flow of traffic. Expansion joints placed across traffic direction can be subjected to constant intolerable impact between wheels of vehicles and steel parts of the joints, which creates noise.
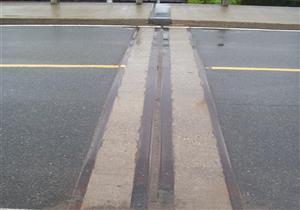
Therefore, elimination of expansion joints between adjacent spans would eliminate the noise emission, and can also more significantly reduce the cost for construction and maintenance of the bridges.
Keywords: Multi simple-span bridges, highway system, Link Slabs, maintenance problems.
I. INTRODUCTION
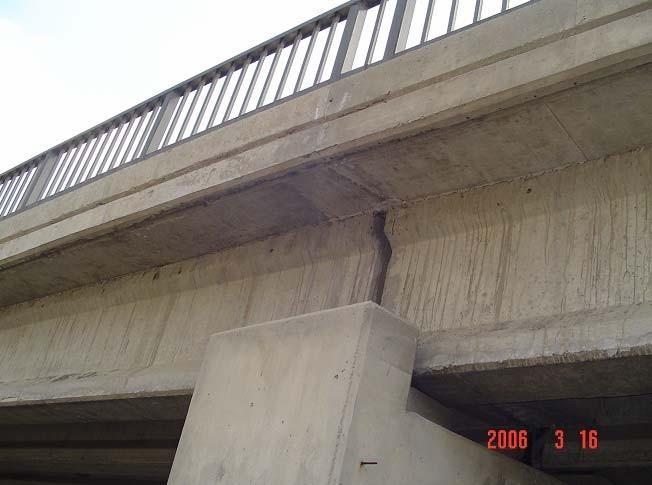
Current design philosophy in Egypt promotes to use expansion joints between continuous decks between adjacent simplespans as shown in Figure 1 [1]. Bridges with link slabs (with continuous decks) was observed that it performed very well & better than others with expansion joints as example in earthquakes, even if they were very close to the fault line as shown in Figure 2 [2].
International Journal of Civil and Structural Engineering Research ISSN 2348-7607 (Online) Vol. 8, Issue 1, pp: (182-191), Month: April 2020 - September 2020, Available at: www.researchpublish.com
Figure 2: A bridge with link slab after earthquake.
Looking at some bridges with link slabs are used in countries other Egypt and by investigating the behaviour of bridges having continuous deck for live load. Deck of a bridge can be made continuous by removing the expansion joints. The part of the deck connecting two adjacent simple-span girders is called “link slab” [4]. The researchers performed live load tests for bridges with link slabs (LS) and developed a design guideline for the link slab based on both service and strength level.
Seismic performance of bridges retrofitted with link slabs was studied for straight bridges, only [3]. It was found out that, for straight bridges the usage of link slabs could overcome span separation problem and could prevent the potential damage due to unseating.
II. GENERATED BRIDGE MODELS
About 30 different computer models were generated to investigate the effect of the link slab on bridges behaviour under the different types of loads such as super imposed loads, live loads including braking forces, earthquakes (RSA) & temperature effects on the link slab. Those 30 different bridge models were developed to represent standard bridges with different combinations of properties namely: number of spans, span length, L/H, Icb/Ic and presence of the link slab are schemed in Table 1.
Table 1: Bridge parameters Property Values
Link Slab No, yes
Two ratios of cap beam inertia to column inertia were selected to be 0.16 and 1.03. Icb/Ic ratio of 0.16 was chosen depending on the results of surveyed data, in order to reflect typical Egyptian design practice. The Icb/Ic ratio of 1.03 was used with reference to Applied Technology Council (ATC) 32-1: Improved Seismic Design Criteria for California Bridges [6], in order to use the representative ratio based on analysis of typical bents in the USA. In the USA, it is typically desired to have weak columns rather than weak cap beams in earthquake regions. This is due to the fact that cap beam damage may cause the disturbance of the whole superstructure leading to hard and uneconomical maintenance problems. But on the contrary, in Egypt the general trend is to have stronger columns. Cap beam cross section does not change between different models and was taken as a rectangle having a depth of 1.0 m. and a width of 2.0 m. (2.0m *1.0m). Corresponding column cross sections for the two cases is given in Table 2.
International Journal of Civil and Structural Engineering Research ISSN 2348-7607 (Online) Vol. 8, Issue 1, pp: (182-191), Month: April 2020 - September 2020, Available at: www.researchpublish.com
Table 2: Column Cross Sections
Icb/Ic Cap Beam
Cross Section Column Cross Section
1) 0.16 Rectangle (2.0m * 1.0m). Rectangle (1.5 * 2.0m)
2) 1.03 Rectangle (2.0m * 1.0m). Circle (D = 1.35m)
L is the centreline to centreline distance between two columns of the bridge bent and H is the height of the column. Two different L/H ratios of 1.0 and 1.5 were used in the study since the majority of the surveyed bridges have L/H between 1.0 and 2.0 (Figure 3.6). Column to column distance (L) is taken as 7 m. for all of the investigated bridge models where the height of the columns (H) for the two cases is shown in Table 3.
Table 3: Column Heights
L/H L H
1) 1.0 7 m. 7 m.
2) 1.5 7 m. 4.6 m.
As indicated previously, about 30 bridge models were created by different bridge properties shown in Table 3.1. These bridge models are composed of six main groups namely A, B, C, D, E & F.
Group A is for the investigated precast girder bridges of spans 15m, 20m, 25m, 30m &35m spans with different cross section of the main girder with link slabs. Other five group are originated from Group A bridges by changing only one property. With this systematic procedure, effects of variation in properties were investigated by comparing the bridge’s behaviour in new group with the behaviour of the ones in Group A.
Group A has 5 main bridge models all having L/H = 1.0 and Icb/Ic = 0.16. All columns have a height of 7.0 m with a rectangular cross section of 2m by 1.5m. All of these bridge models have continuous decks. For these bridges only interior deck joints are eliminated by using link slabs. Figure 3.7 shows deck plan of Group A, bridges with link slabs. All the bridge models are numbered
Group B bridges are obtained from Group A bridges by removing only the slab at the expansion joint place. In other words, all bridges in Group B have simple separated decks.
Group C are obtained from Group A by changing only L/H to 1.5, in other words by decreasing the height of the columns down to 4.6 m.
Group D are obtained from Group C by removing only the slab at the expansion joint place. In other words, all bridges in Group D also have simple separated decks.
Group E bridges are also created from Group A bridges, by changing this time Icb/Ic to 1.03. Icb/Ic of 1.03 is obtained by using circular cross sections of diameter 1.35 m for the columns.
Group F bridges are also created from Group A bridges, by removing only the slab at the expansion joint place. In other words, all bridges in Group F have simple separated decks.
III. MATERIAL CHARACTERISTICS
In Table 4, the material properties of components can be found. The weights of wearing surface, barriers are included.
Table 4: Material properties of the bridge components
Name Modulus of Elasticity (kN/m²)
Poisson Ratio Shear Modulus (kN/m²)
Unit Weight (kN/m³)
Thermal Expansion (1/ °C *10-6)
Girder 2.56 * 107 0.20 1.07 * 107 25.00 9.90
Rigid 2.56 * 109 0.20 1.07 * 109 25.00 0.00
Deck 2.56 * 107 0.20 1.07 * 107 25.00 9.90
Cap Beam 2.56 * 107 0.20 1.07 * 107 25.00 9.90 Column 2.56 * 107 0.20 1.07 * 107 25.00 9.90 Crossbeam 2.56 * 107 0.20 1.07 * 107 25.00 9.90
International Journal of Civil and Structural Engineering Research ISSN 2348-7607 (Online) Vol. 8, Issue 1, pp: (182-191), Month: April 2020 - September 2020, Available at: www.researchpublish.com
IV. ANALYSIS PROCEDURES AND MODELLING
Bridge deck, modelled with four node SHELL elements, had a thickness of 200 mm. Link slabs were modelled to have an effective moment of inertia equal to the 35% of the gross moment of inertia of the deck, to account for cracking. An effective equivalent thickness of 160 mm. was used for the link slabs. A gap of 0.10 meters was provided at expansion joints. The shell elements of regular bridges were rectangle in geometry with dimensions 0.10*0.10 m. while the ones of skewed bridges have parallelogram shapes as shown in Figure 4.2. This fact does not appear to be a problem since CSIBRIDGE condenses four triangles to form the quadrilateral element. I-girders are the most commonly used bridge sections for short span bridges (span length = 15 to 35 meters). All modelled bridges have a width of 8.0 meters having four (4) equally spaced simply supported precast I-girders. The precast Igirders were modelled by beam elements at their neutral axis. Each I-girder of a span is divided into pieces with length 0.50m to provide a fine mesh for superstructure. One I cross sections is common and widely used in Egyptian practice was chosen depending on maximum span length of the bridge and varies as per the span of the bridge. For the bridges having minimum and maximum span length of 15 meters and 35 meters, I-girder cross section of 1 and 2 were used, respectively.
Deck and the girders were made composite by means of rigid links. The link slab was debonded at girder ends by 5% of the span length as proposed supervising team and as per the previous searches. Debonding was obtained by eliminating the rigid links between the deck and the girder at debonding zones. Longitudinal close view of a bridge model with link slab.
Diaphragms are usually placed at the supports and along the span to provide an equal live load distribution between the girders. Possible lateral distortions of girders can be minimized by diaphragms during transverse earthquake loads [9]. The external diaphragms at end spans transfer the load from webs through the pier system. Internal diaphragms may have disadvantageous effects due to the additional structural dead load and limited slab shrinkage in transverse direction which causes deck cracking [10]. Therefore, the two external diaphragms at supports are used only. Rectangular diaphragms having a variable height from 0.90m to 1.70m as per the span and a width of 0.40 meters were used in models. A typical bridge bent has one column. Two columns cross-section used in the Egyptian practice were employed for the models. The first one is a 1.0-meter-long rectangular shape whose edges are curved with half circles having a large diameter (Lotus). An equivalent rectangular cross section of 1.5 m * 2.0 m is used in the models. The second one has a circular crosssection having a diameter of 1.35meters as shown in Figure 4.7. Columns were modelled by three stick elements of equal length at their neutral axis for a better mass distribution. Cap beams were modelled with beam elements connected to nodes at the column face with rigid link elements. They were also connected into the bearings at top by means of two rigid link elements. For cap beam elements a rectangular cross section having a height of 1.1 m. and a width of 1.2 m. was used.
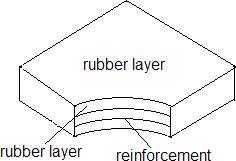
At foundation level, bents were assumed not to translate or rotate representing a fixed foundation anchored into rock. This research does not include soft soil– structure interaction. Column elements were extended to the fixity point of footings with rigid link elements having a length of 1.5. Movement joints at superstructure are provided to allow longitudinal displacement induced by temperature, shrinkage and creep effects. If the displacement capacity of movement joints is exceeded during a seismic event, span unseating can be observed. Expansion bearings, a type of movement supports placed between superstructure and substructure can provide longitudinal and transverse translation, and rotation. Elastomeric bearings recommended in AASHTO, 1996 [5] are expansion type of bearings that provide a resisting force proportional to deck displacement (Next Figure). Stiffness of a bearing can be adjusted depending on its dimensions and rubber thickness.
Figure 3: Elastomeric bearing, AASHTO, 1996 [7]
International Journal of Civil and Structural Engineering Research ISSN 2348-7607 (Online) Vol. 8, Issue 1, pp: (182-191), Month: April 2020 - September 2020, Available at: www.researchpublish.com
V. RESPONSE SPECTRUM ANALYSIS RSA
Response spectrum concept is an extensively used tool in earthquake engineering to express characteristics of ground motions and their effects on structures. Response spectrum represents the maximum response of a single- degree-offreedom (SDOF) system, as a function of its natural frequency and damping ratio, to an earthquake motion [10]. Response spectrum curves are plots of maximum responses (acceleration, velocity, displacement) of a SDOF system to a particular excitation at different natural frequencies (or periods) for a specified damping ratio. Response Spectra Analysis (RSA) provides computation of peak responses of a multi-degree-of-freedom (MDOF) system by using these response spectra curves. In RSA, structural responses (member forces, displacements, etc.) are computed under a spectrum of earthquake records for each mode of vibration combined by some statistical procedures to give possible maximum response of the structure. The main modal combination rules are absolute sum (ABSSUM), complete quadratic combination (CQC) and square-root-of-sum-of-squares (SRSS) [28].
Response spectra analysis was performed for all investigated bridge models using bridge analysis program CSIBRIDGE. It should be underlined that, for each model, 12 modes of vibration were analysed. CSIBRIDGE uses CQC modal combination formulation proposed by A. Der Kiureghian (1981) [24].
RSA is a static elastic analysis method which uses the natural frequencies, mode shapes and modal damping ratios of the structure and the dynamic properties of the excitation in computation. Consequently, it is a well-established procedure for dynamic analysis [7].
RSA is a commonly utilized method in structural design compared to time history analysis. It provides a rational and time efficient method for dynamic analysis of structures. Time history analysis, which is an exact dynamic analysis method, is not implemented for regular design practice since it requires a huge amount of time and effort. Using linear time history analysis for design is uneconomical and time inefficient. Using non-linear time history analysis for design is almost impossible. Designer has to know sizes and reinforcement beforehand to make a non-linear analysis. Run time for nonlinear time history analysis can be beyond tolerable limits. If an engineer selects non-linear time history analysis as a design tool, and if the engineer makes a wrong selection in sizing the structure that will require iterative runs, it may be very costly for the client. In industry practice, the computer runs were limited for a maximum of 15 minutes of run-time so that if there is an error in design, the designer can give a quick decision by a simple iteration to correct it.
Therefore; the designers typically select time-efficient response spectra analysis for the design that requires time efficient iterations. The design spectra used for design of new structures and for assessment of existing buildings are utilized in RSA to expected earthquakes with a very long return period of years. A response spectrum obtained from a particular ground motion happened in a past earthquake cannot be directly used unless engineer approves. Response spectra curves obtained from past earthquakes have highly irregular response based on the soil conditions, frequency content and closeness to fault line. Design response spectra specified in codes typically cover all of the possible earthquakes at a site rather than a particular one [11]. A design spectrum is achieved by smoothing, averaging or enveloping the response spectra of ground motions developed during past earthquakes at a site. If there exist no recorded excitations for the site, ground motions recorded at different sites under similar conditions should be used to generate the design spectrum [10].
RSA of the investigated bridges were based on the design response spectrum recommended in AASHTO, 1996. A seismic response coefficient characterizes the earthquake load to be used in the elastic analysis for seismicity.
The elastic seismic coefficient is given in AASHTO, 1996 by the dimensionless formula:
Cs = 1.2AS/T (2/3)
Where:
A = the acceleration coefficient
S = coefficient for the soil profile characteristics of the site T = the period of the bridge (sec).
Most of the bridges in surveyed data happened to be at medium risk seismic zones. Therefore, the acceleration coefficient (A) was taken to be 0.15g, which is the value per Egyptian Specification for Structures to be Built in zone 3 areas (Cairo).
As it was previously mentioned, for simplicity, all bridges were assumed to be located on sand sites since the focus of the study is not related with soil – structure interaction. Soil profile type I of ASSHTO, 1996 is used for any type of sand sites. Therefore, the coefficient for the soil profile (S) was taken equal to 1.5, accordingly.
International Journal of Civil and Structural Engineering Research ISSN 2348-7607 (Online) Vol. 8, Issue 1, pp: (182-191), Month: April 2020 - September 2020, Available at: www.researchpublish.com
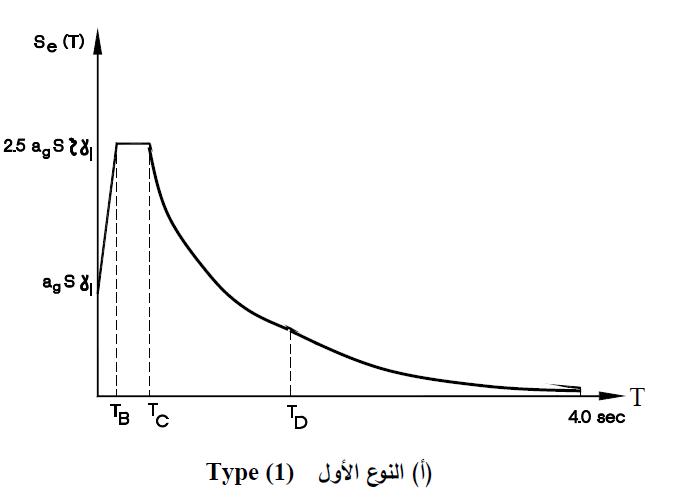
It is also indicated in AASHTO, 1996 that Cs need not exceed 2.5A. The corresponding response spectrum used for RSA of the bridges is sketched in Figure 4.
Figure 4: ECP normalized elastic response spectrum for 5% damping
The load combinations used in the analyses for earthquake loadings are;
DL + EQL + 0.3EQT + 0.3EQV
DL + 0.3EQL+ EQT + 0.3EQV
DL + 0.3EQL + 0.3EQT + EQV
Typically, DL includes own weight of the members, wearing surface weight & the parapets weight. Qv component is not included in the analysis except for the case when the engineer sees using the vertical component as essential. In this study, EQv RSA is assumed to be equal to the EQL & EQT RSA. In practice, sometimes 2/3 of EQL or EQT is used in analysis based on common engineering judgment [6].
Indeed, evaluation and investigation of the earthquake forces affecting the structures have started recently to be effectuated with reference to “planar spectrum” concept. Most violently hazardous earthquakes in Egypt and in other parts of the world during the last fifteen years have been investigated by a group of experts focusing on the topic [12, 13, 14].
Earthquake excitations surge in multiple directions during the main shock of the seismic action. Then, for a given constant period T, a group of response quantities should be evaluated for each angle specifying the direction of the oscillator motion. Therefore, a group of spectral graphs could be defined foe a lap of a strong motion. The envelope of this set of linear spectra is referred as planar spectrum [12]. This approach is well recognized by the scientific communities and institutions specialized in the area of earthquake investigations. But it is not referred yet in national and international codes and standards. It is why the numerical operations pertinent to estimation of earthquake forces and displacements were not realized considering this advanced new approach.
VI. ANALYSIS RESULTS AND DISCUSSION
In this section, the results of RSA were presented. Addition of link slab and variations of span lengths, columns height and columns cross section were investigated on several parameters such as fundamental periods of the bridge, span separation and bounding between spans.
International Journal of Civil and Structural Engineering Research ISSN 2348-7607 (Online) Vol. 8, Issue 1, pp: (182-191), Month: April 2020 - September 2020, Available at: www.researchpublish.com
VI. A- EIGENVALUE ANALYSIS RESULTS
Fundamental periods for all studied bridge structures have been evaluated with help of the eigenvalue analysis program of the CSIBRIDGE software system. The results are given in tabulated forms separately for all six groups (Group A, B, C, D, E and F).
Fundamental periods of bridges calculated by the eigenvalue analysis, in longitudinal, transverse and vertical directions were taken as the first modal period of the bridge in corresponding direction, which gives a mass participation of 10% or higher.
Table 5: Fundamental Periods of Group A Bridges
Model # # of spans SL (m)
LS L/H Icb/Ic
Trans. Period (sec)
Long. Period (sec)
Vert. Period (sec)
A1 2 15 yes 1.0 0.1 0.898 0.875 0.140
A2 2 20 yes 1.0 0.1 1.063 1.029 0.191
A3 2 25 yes 1.0 0.1 1.221 1.173 0.253
A4 2 30 yes 1.0 0.1 1.376 1.309 0.327
A5 2 35 yes 1.0 0.1 1.526 1.44 0.401
Table 6: Fundamental Periods of Group B Bridges
Model # # of spans SL (m) LS L/H Icb/Ic
Trans. Period (sec)
Long. Period (sec)
Vert. Period (sec)
B1 2 15 no 1.0 0.1 0.899 0.877 0.139
B2 2 20 no 1.0 0.1 1.066 1.033 0.190
B3 2 25 no 1.0 0.1 1.224 1.177 0.252
B4 2 30 no 1.0 0.1 1.368 1.305 0.325
B5 2 35 no 1.0 0.1 1.530 1.445 0.395
Table 7: Fundamental Periods of Group C Bridges
Model # # of spans SL (m) LS L/H Icb/Ic
Trans. Period (sec)
Long. Period (sec)
Vert. Period (sec)
C1 2 15 yes 1.5 0.1 0.874 0.849 0.139
C2 2 20 yes 1.5 0.1 1.034 0.999 0.190
C3 2 25 yes 1.5 0.1 1.187 1.139 0.253
C4 2 30 yes 1.5 0.1 1.337 1.271 0.327
C5 2 35 yes 1.5 0.1 1.482 1.398 0.400
Table 8: Fundamental Periods of Group D Bridges
Model # # of spans SL (m) LS L/H Icb/Ic
Trans. Period (sec)
Long. Period (sec)
Vert. Period (sec)
D1 2 15 no 1.5 0.1 0.874 0.850 0.138
D2 2 20 no 1.5 0.1 1.035 1.00 0.189
D3 2 25 no 1.5 0.1 1.188 1.140 0.251
D4 2 30 no 1.5 0.1 1.327 1.264 0.324
D5 2 35 no 1.5 0.1 1.481 1.400 0.395
International Journal of Civil and Structural Engineering Research ISSN 2348-7607 (Online) Vol. 8, Issue 1, pp: (182-191), Month: April 2020 - September 2020, Available at: www.researchpublish.com
Table 9: Fundamental Periods of Group E Bridges
Model # # of spans SL (m) LS L/H Icb/Ic
Trans. Period (sec)
Long. Period (sec)
Vert. Period (sec)
E1 2 15 yes 1 1.03 1.015 0.935 0.142
E2 2 20 yes 1 1.03 1.204 1.094 0.193
E3 2 25 yes 1 1.03 1.385 1.246 0.255
E4 2 30 yes 1 1.03 1.565 1.390 0.329
E5 2 35 yes 1 1.03 1.742 1.529 0.402
Table 10: Fundamental Periods of Group F Bridges
Model # # of spans SL (m) LS L/H Icb/Ic
Trans. Period (sec)
Long. Period (sec)
Vert. Period (sec)
F1 2 15 no 1 1.03 1.023 0.945 0.141
F2 2 20 no 1 1.03 1.219 1.112 0.192
F3 2 25 no 1 1.03 1.410 1.267 0.254
F4 2 30 no 1 1.03 1.588 1.403 0.327
F5 2 35 no 1 1.03 1.796 1.554 0.397
VI. B- Span separation and bounding results
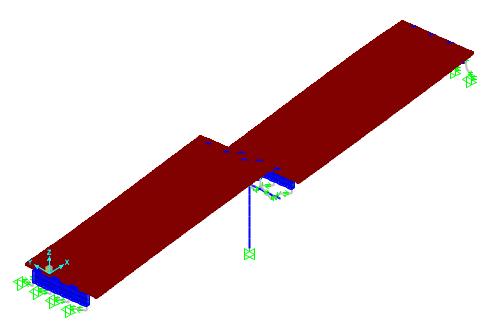
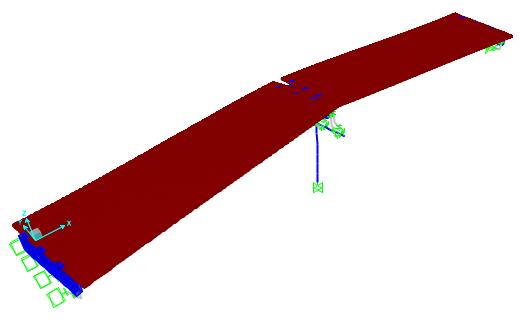
In Figure 6.1 and 6.2 mode shapes of a multi-simple span bridge with expansion joints are shown. For the mode shape shown in Figure 6.1, span separation and for the mode shape shown in Figure 6.2 pounding of the spans may take place. In Figure 6.3, the mode shape of the same bridge after retrofitting with link slab is shown. As it can be observed from these figures, addition of link slab decreases the tendency for span separation. Also pounding of the spans does not happen since the spans are connected to each other from the deck level with the addition of link slab.
Figure 5: Span separation problem of the multi-simple span bridge with expansion joints
International Journal of Civil and Structural Engineering Research ISSN 2348-7607 (Online) Vol. 8, Issue 1, pp: (182-191), Month: April 2020 - September 2020, Available at: www.researchpublish.com
Figure 7: The deformed shape of the multi-simple span bridge retrofitted with link slabs.
VII. CONCLUSIONS
In this study, a total of 32 bridge models were investigated in order to figure out the effects on bridge behaviour. Addition of link slab as a retrofit procedure was also studied. The conclusions of this study can be summarized as follows:
Addition of link slab between adjacent spans decreases both transverse and longitudinal displacements at deck level.
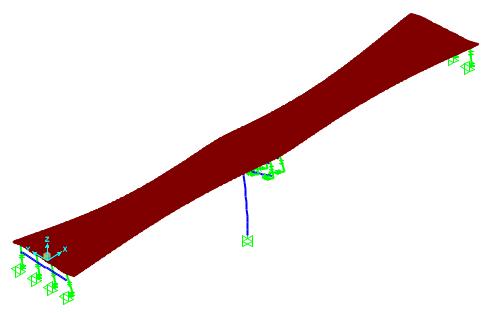
Addition of link slab decreases the tendency for span separation. When link slabs are used, pounding does not take place between adjacent spans since they are connected to each other.
Link slab axial forces at the edges of the link slab were found to be higher than the one at the middle. Therefore, a higher reinforcement ratio at the edges of the link slab can be utilized compared to the center parts of the link slab.
Vertical components of the earthquake records governed the design of some components. Therefore, vertical earthquake component should be considered in design of bridges.
Using link slabs is generally considered as a cost-effective approach taking into account especially high maintenance expenses due to frequent changes of repairs of the classical joints. But it would be also underlined that the working care and discipline to be applied in construction of link slabs is not widely established in some of the developing countries. The full acceptance of the link slab system conceptually and practically could necessitate some time. Finally, it is hopefully expected that the construction of link slabs would be more frequently practiced soon in Egypt.
International Journal of Civil and Structural Engineering Research ISSN 2348-7607 (Online) Vol. 8, Issue 1, pp: (182-191), Month: April 2020 - September 2020, Available at: www.researchpublish.com
REFERENCES
[1] Caner, A. and Sevgili, G., 2006, “Seismic Performance of Multisimple- Span Skew Bridges Retrofitted with Link Slabs”, International Bridge Conference, Pittsburgh, PA.
[2] Fobo, W., “Noisy Neighbours”, Bridge Design and Engineering web site: http: //www.bridgeweb.com/, June 2006.
[3] Caner, A., Dogan, E., and Zia, P., 2002, “Seismic Performance of Multisimple-span Bridges Retrofitted with Link Slabs”, Journal of Bridge Engineering, 7(2), 85 – 93.
[4] El-Safty, A., K., 1994, “Analysis of Jointless Bridge Decks with Partially Debonded Simple Span Beams”, Ph.D. Dissertation, North Carolina State University, Raleigh.
[5] AASHTO (American Association of State Highway and Transportation Officials), 1996, “Standard Specifications for Highway Bridges”, Washington D.C.
[6] ATC (Applied Technology Council)-32-1, 1996, “Improved Seismic Design Criteria for California Bridges: Resource Document”, Redwood City, California.
[7] CSIBRIDGE Inc., “CSIBRIDGE reference for CSIBRIDGE Finite Element Analysis and Design Software”, 2020, Melville, New York.
[8] Priestley M. J., Seible F., Calvi M., 1996, “Seismic Design and Retrofit of Bridges”, John Wiley and Sons, New York.
[9] Caner, A., 2006, “CE767 Highway and Railroad Infrastructures Lecture Notes”, METU, Ankara
[10] Kramer, S., 1996, “Geotechnical Earthquake Engineering”, Prentice Hall, New Jersey.
[11] Chopra, A., 2000, “Dynamics of Structures”, Prentice Hall, New Jersey. [1] Euro code 2, ENV BC2 Design of concrete structures, General Rules and Rules of Buildings, DD. ENV, 1995.
[12] Erkay, C., Karaesmen E., 1997, “Düzlemsel Spektrum Kavramı Üzerine Bir İrdeleme”, 4. Ulusal Deprem Mühendisliği Konferansı Bildiriler Kitabı, Ankara
[13] Erkay, C., Karaesmen En., Karaesmen Er., 2002, “Significance of Spatial Variation of Seismic Motion and Consequences Affecting Design Procedures”, Proceedings of the 12th European Conference on Earthquake Engineering, London.
[14] Karaesmen E., Erkay, C., 1994, “An Approach for the Evaluation of Seismic Action”, Proceedings of the 10th European Conference on Earthquake Engineering, Vienna. [2] International workshop (2007): “Fire Design of concrete structures” University of Coinbra, Portugal, November.
