ISSN 2348-1218 (print)
International Journal of Interdisciplinary Research and Innovations ISSN 2348-1226 (online) Vol. 9, Issue 3, pp: (52-58), Month: July - September 2021, Available at: www.researchpublish.com

ISSN 2348-1218 (print)
International Journal of Interdisciplinary Research and Innovations ISSN 2348-1226 (online) Vol. 9, Issue 3, pp: (52-58), Month: July - September 2021, Available at: www.researchpublish.com
1Department of Fisheries and Aquaculture Management, Nnamdi Azikiwe University, P.M.B 5025, Awka, Anambra State, Nigeria.
*Correspondent author’s email: oc.evulobi@unizik.edu.ng. Tel: +2347036775852.
Abstract: Streams and wetlands are important sources of water for fish farming in Nnamdi Azikiwe University, Awka (Unizik). Therefore, this study assessed the levels of some physicochemical parameters of water quality of the stream and wetland of Unizik using six different sampling stations. The water samples analyzed for physicochemical parameters: dissolved oxygen (mg/L), Conductivity (µS/cm), total dissolved solid (mg/l), pH, Temperature oC, Cadmium (mg/l), Copper (mg/l), Iron (mg/l), Lead (mg/l) and Zinc (mg/l) using standard methods. The results were compared with the standard values set by the World Health Organization (WHO). The results showed that the physicochemical concentrations of water samples from the streams and wetland were in the range of: dissolved oxygen, 5.23 ± 2.8 to 11.24 ± 0.23(mg/l); conductivity, 37.67 ± 0.58 to 183.67±2.08(µs/cm); pH, 8.21±0.22 to 10.07±1.7; temperature, 28.93±0.47 to 33.97±3.109oC.; Total dissolved solid, 20±0.00-130±2.3; Cadmium, 0.11±0.06 to 0.22±0.02(mg/l); Copper, 2.50±0.71 to 16.60±0.28(mg/l); Iron, 0.00±0.00 to 1.40±0.14(mg/l); Lead, 0.00±0.00 to 1.20±0.12(mg/l), and Zinc, 6.00±0.28 to 8.60±0.85(mg/l). This study revealed that most of the physicochemical parameter of the streams and wetland in Nnamdi Azikiwe University, Awka were found to be within the recommended limits of WHO while the heavy metals: cadmium, copper, iron, lead and zinc have levels higher than the maximum limits. Therefore, the stream and wetland in Nnamdi Azikiwe University, Awka may be suitable for aquaculture if properly treated for to reduce these heavy metals. Further studies and constant monitoring should be conducted on the Unizik streams and wetland and on the fish cultured with these waters.
Keywords: Assessment, Nnamdi Azikiwe University, Physicochemical Parameters Streams, Wetland.
Around 71% of the earth's surface is covered in water (Hynes, 2000). 97% of this water on the Earth is found in seas and oceans and only 3% is freshwater with slightly over two thirds of this freshwater frozen in glaciers and polar ice caps (United States Geological Survey,USGS, 2009). The remaining unfrozen freshwater is found mainly as groundwater, with only a small fraction of surface water readily accessible for beneficial purposes (Jannat et al., 2019). Water can be obtained from surface water sources such as freshwater, lakes, rivers, streams, and groundwater sources (Kiros et al, 2021). Streams and wetlands represent surface water which are easily accessed and provide around 78% of the fresh water for human consumption including drinking.
ISSN 2348-1218 (print)
International Journal of Interdisciplinary Research and Innovations ISSN 2348-1226 (online) Vol. 9, Issue 3, pp: (52-58), Month: July - September 2021, Available at: www.researchpublish.com
Surface water reservoirs are the planet’s most important freshwater resources and provide inumerable benefits. They are used for domestic and irrigation purposes and provide ecosystems for aquatic life especially fish, thereby functioning as a source of essential protein and for significant elements of the world’s biological diversity (Seher, 2015). There are numerous continental inland fresh waters, which provide man with fish and other aquatic food (Eyo, 2001). Water needs have presented serious socio-economic and health influences on urban development in developing countries where populations’ concentrations have put serious strains on available resources. About some 40 percent of the world’s population in over 80 countries is affected by serious water shortages (Mason, 2002). In other countries water is available but too expensive to use because easily accessible sources have already been depleted and new sources cost much more to treat to an acceptable standard due to pollution (Mason, 2002)
The pollution of rivers and streams with chemical contaminants has become one of the most critical environmental problems of the century. Water pollution can cause harm to living resources, hazard to human health, hindrance to aquatic activities and impairment of water quality with respect to its use in agriculture, industrial and other economic activities (Varo & Sen, 2012). The major sources of pollution include domestic and industrial wastewater discharges, mining, surface runoff and agrochemicals (Murray et al, 2005). Excessive fertilization (eutrophication) is also one of the most significant causes of water quality deterioration in lakes, streams, and reservoirs in many countries(Mutisya & Tole, 2008). The contaminants associated with these sources include organic chemicals (pesticides and herbicides), inorganic chemicals (acids, alkalis, salt and metals), nutrients (nitrogen and phosphorus), pathogens (bacteria, viruses and parasites), radioactive materials (uranium, thorium, caesium, iodine and radon), sediment (soil and silt) and solid waste (Moyo & Mtetwa, 2002; Feng et al.,, 2004)
Water quality analysis is important to protect the natural ecosystem (Patil et al, 2012). It involves the process of evaluating the physical, chemical and biological nature in relation to natural quality, human effects and intended uses, particularly uses which may affect human health, industrial use and aquatic system. The most common standards used to assess water quality relate to health of ecosystems, safety of human contact and drinking water .The physico-chemical parameters are very essential and important to test the water, before it is used for drinking, domestic, agricultural or industrial purpose (Seher, 2005). Water Quality Standards have been established to regulate substances that potentially affect human health, environment and aesthetic qualities of water.
The stream that runs through Nnamdi Azikiwe University play an important role in the drainage system pattern in Unizik which is designed in a way to collect run-off water from the rain. These water sources serve as fishing site for the fishermen during rainy season, and also a source of water to farmers for irrigation. In recent times, there is a need to construct a dam in the university for development of aquaculture However, the background information on the quality of the water was lacking. Therefore, the aim of this study was to assess the levels of some physicochemical quality of water samples from the streams and wetlands in Nnamdi Azikiwe University, Awka and to determine whether they are within the recommended safe limits.
The Study area: The study was conducted on the streams and wetland of Nnamdi Azikiwe University in Awka South Local Government Area, Anambra State in July - September, 2019 while the analysis was carried out in the Biotechnology Research Centre and the Department of Fisheries and Aquaculture Management laboratories in the same university. The study area lies along the longitude 070 06’ (E) and latitude 060 10’ (N). The stream is located at an altitude between 150-155feet above sea level. The flowing freshwater stream flows through the school premises, through Amansea town and finally drains into Ezu River, a tributary of the River Niger. The stream has good vegetation consisting of tall bamboo trees, oil palm trees and others forming a canopy along its channel which provides shade and a favorable temperature condition suitable for aquatic organisms. The stream is also surrounded by farmlands.
Sampling Locations and Sample collection: Six water samples named site 1A, Site 1B, Site 2A, Site 2B, Site 3A and Site 3B used for this analysis were collected randomly from six different stations of the stream and wetland in Nnamdi Azikiwe University, Awka.
Station 1 and 2: Two sampling points (Site 1A and site 1B) between the inlet from VC’s gate and outlet at Garuba Square.Station 3 and 4: Two sampling points (Site 2A and site 2B) between the inlet from Beautiful Gate (2nd Gate) and
ISSN 2348-1218 (print)
International Journal of Interdisciplinary Research and Innovations ISSN 2348-1226 (online) Vol. 9, Issue 3, pp: (52-58), Month: July - September 2021, Available at: www.researchpublish.com
outlet at Garuba Square.Station 5 and 6: Two sampling points (Site 3A and site 3B) in the wetland at the back of Department of Fisheries Research farm.
Water samples were collected during the rainy season because the streams and wetland dry during the dry season. Collection of water samples was done once per week during morning and afternoon hours between 7:00am and 1:00pm from July to September, 2019. The water samples were collected with 500 ml plastic bottles with lid by submerging the container at a depth of about 0.3m below water surface. Prior to sampling, the bottles were cleaned with 10% nitric acid and rinsed with distilled water. Then, the bottles were rinsed three times with the stream or wetland water at the time of sampling before collection and caution was taken not to allow any air bubble inside the bottles. Sample bottles were appropriately labeled to indicate date of sampling and the sampling station before they were transported to the laboratory and stored at 40C awaiting analysis. pH, temperature and conductivity were determined at the sampling stations while for dissolved oxygen, the preliminary stages of the Winkler’s procedure was conducted at the field to ensure the oxygen content would not vary between the sampling stations and the laboratory.
Figure1: Landsat Image showing the Sampling Stations
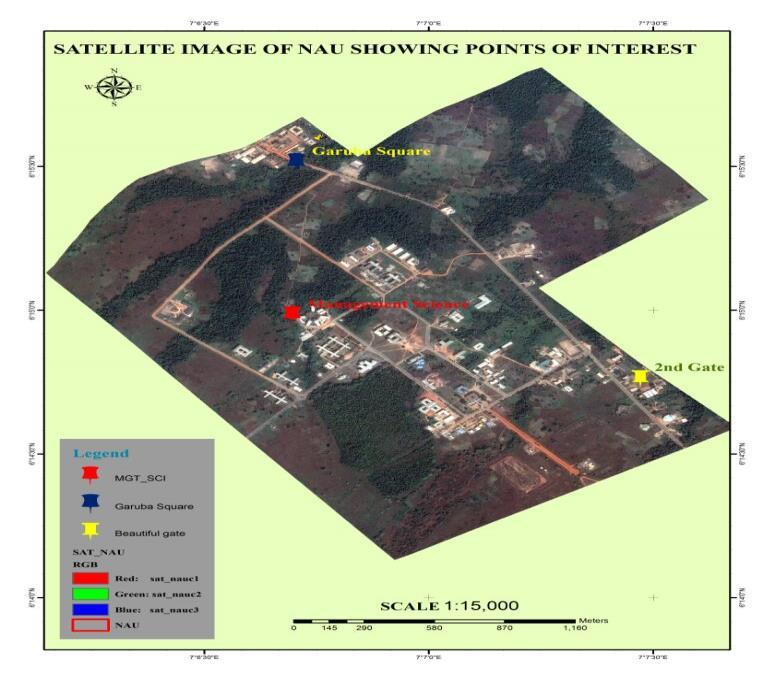
Source: Physical Planning Unit, Unizik.
Analysis of Physicochemical Parameters in the Water Samples: The water samples were analyzed for physicochemical parameters such as temperature, pH, turbidity, dissolved oxygen (DO), electrical conductivity (EC), total dissolved solids (TDS), using standard methods (APHA, 2012; Stirling, 1985)
Determination of Heavy metals: Heavy metal analyses were conducted using Varian AA240 Atomic Absorption Spectrophotometer according to the method of American Public Health Association, (APHA, 2012).
Statistical Analysis: The data generated were analysed using Analysis of Variance (ANOVA) with SPSS version 20 to get the mean and significant differences. The physicochemical parameters and heavy metals were compared with WHO guidelines for drinking water.
In table 1, we have the results obtained for the physicochemical parameters: dissolved oxygen, conductivity, total dissolved solid, pH and temperature.
The dissolve oxygen content ranged from 5.23±2.83 to 11.24±0.23 mg\l with station 3A recording the highest value (11.24 mg/l), while the lowest values were recorded in site 2B (5.23 mg/l). All the six stations were within the WHO specification except for Site 3A. The higher values recorded in the wetland sample may have resulted from the fact that it
ISSN 2348-1218 (print)
International Journal of Interdisciplinary Research and Innovations ISSN 2348-1226 (online) Vol. 9, Issue 3, pp: (52-58), Month: July - September 2021, Available at: www.researchpublish.com
is a lentic environment and would be expected to have increased DO during the day time because of the activities of phytoplankton usually present and abundant in such an environment. Dissolved oxygen is one of the important parameter in water quality assessment and reflects the biological and physical processes prevailing in the water (Seher, 2005) Dissolved Oxygen concentration in the analyzed water samples range from 5.23±2.83 in site 2B to 11.24±0.45 in site 3A. The maximum permissible limit of Dissolved oxygen in water specified by WHO (2008) is 5-10 (mg/l). The observed concentration of dissolved oxygen ( 5.23±2.83 to 11.24±0.45 ) in this study is apparently within the maximum allowable limit except for Site 3A which had the highest values. According to the result obtained, It is obvious that Unizik stream and wetland have a high oxygen concentration which can be useful for Aquaculture purposes. High dissolved oxygen obtained from the analysed water samples from Unizik stream and wetland might be due to lower turbidity and decreased anthropogenic activities that lowers the dissolution of oxygen. The results obtained from these samples were higher than those obtained by Okoye (2016) in his work on Limnological Studies of Unizik and Amansea stream. Adequate dissolved oxygen is necessary for good water quality because it is absolutely essential for the survival of all aquatic organisms. Dissolved oxygen is an important indicator of water quality, ecological status, productivity and health of a reservoir (Mustapha, 2008). This is due to its importance as a respiratory gas, and its use in biological and chemical reactions.
Electrical conductivity varied from 37.67±0.58 to 183.67±2.08µs/cm for Site 1A and 3A respectively and the result were significantly different from each other (P<0.05) Electrical Conductivity of the water samples varied from from 37.67±0.58 to 183.67±2.08 for 1A and 3A respectively and the result differ significantly (p<0.05) with each other. They are all below specification of 1000µs/cm by WHO (2008). The results obtained from these samples were almost similar to those reported by other researchers such as Mustapha (2008) in his water research commission report and Ibrahim (2009) in his work on evaluation of some physicochemical conditions of River Challawa. While the electrical conductivity is a good indicator of the total salinity, it still does not provide any information about the ion composition in the water. The low conductivity obtained from this analysis might be responsible for the soft nature of the water and will support diverse species of organisms (Muastapha, 2008). High electrical conductivity is more associated with wastewater discharges from sewerage and industries, agricultural runoff and acid mine drainage. Electrical conductivity is affected by temperature through ionic concentration.
The values of pH recorded was lowest in site 3A (8.21±0.22) and has the highest concentration in site 2A (10.07±1.71) and they are within the limit specified by WHO (2008) except for Site 1B and 2A. The recommended pH range specified in WHO guidelines is between 6.5 and 8.5 (Table 1). The pH values of all the analysed water samples are found to be alkaline in the range between 8.21 to 10.07. The pH values obtained in the present study are adequate for aquatic life including fish. The values obtained from this result compares favourable with that of Jingxi et al. (2020) which obtained pH range of 7.80 to 10.20. Measurement of pH relates to the acidity or alkalinity of the water. Extremely high pH has the potential of indirectly affecting the biota in various ways for instance it can cause irritation and inflammation of the mucous membranes of humans using the water (APHA, 2012), thus, making them more vulnerable to opportunistic infections. Low pH is known to favour the solubility of ions associated with TDS. Water pH is also important because it affects other pollutants, in that, when it is very acidic, metals such as zinc, aluminum and copper are released causing them to accumulate in the food chain. Likewise, when it is more basic it causes the accumulation of the unionized ammonia ions (NH3) which are known to be very toxic to aquatic animals (Jingxi et al., 2020)
The Total Dissolved Solid in the analyzed water varied from 20 to 130mg\l for sample 3A having the lowest value and 1B having the highest concentration respectively. There was a significant difference between the various sites (P<0.05). A critical look at the analytical results in table 1 showed the range of Total Dissolved Solid to be 20 to 130 mg/l for sample 3A and 1B respectively. They are all below specification of 500 by WHO (2008). These studies are almost similar to the work of Ibrahim (2009) on evaluation of some physicochemical conditions of River Challawa. Some ions which dissolved in water at moderate concentrations may have beneficial health impacts such as iron and zinc. Likewise, at elevated levels, heavy metal ions which dissolved in water may lead to heavy metal pollution and can be toxic to aquatic life through changing the composition of the water (Tawati et al., 2018)
The temperature of the water analyzed varied from 28.93±0.40°C for Site 1B which is the lowest value to 33.97±3.109°C for Site 3B which is the highest value. The wetland temperatures (site 3A and B) were significantly different from the rest of the other samples (P<0.05). Obtained water temperatures were within the permissible limits of WHO (2008) except for the water samples obtained from wetland. Water temperature is one of the most important physical characteristics of aquatic ecosystems and affects a number of water quality parameters (Seher, 2015). The temperature of the water
ISSN 2348-1218 (print)
International Journal of Interdisciplinary Research and Innovations ISSN 2348-1226 (online) Vol. 9, Issue 3, pp: (52-58), Month: July - September 2021, Available at: www.researchpublish.com
analyzed ranged from 28.93±0.40 to 33.97±3.109 as shown in table 1. The values of temperature for all water samples were within the permissible limit of WHO for drinking water, 25-30°C(WHO, 2008) except for Site 3A and 3B which were water samples from wetland. A similar study conducted in Well Water Samples of Kafta Humera Woreda, Tigray, Ethiopia showed ranges of 27.67 ± 0.15 to 28.30 ± 0.25°C (Kiros et al, 2021). Higher water temperatures could be attributed to the environmental temperature as well as other climatic conditions prevailing in the wetland at the time of collecting sample (Kiros et al, 2021)
The result in the table 2 shows the analysis of heavy metal from different collection points. Among the heavy metals, zinc has the highest concentration in all the six stations while lead has the lowest concentration. Their concentration fell in the order of Zn > Cu > Cd> Fe >Pb. Cadmium ranged from 0.11±0.06 for site 1B and Site 2B which is the lowest value to 0.22±0.02 for site 1A which is the highest recorded result. The concentration of cadmium in the analyzed water samples were above the allowable limit. The values of copper obtained from the water sample analysis were well above the permissible range in WHO (2008) whereby Site 3A was most contaminated with copper (16.60±0.28) while site 1A was least contaminated with copper (2.50±0.71). There was no contamination of iron in site 1A and site 2A but site 3B was most contaminated with iron (1.40±0.14). Again, site 1B, 2A, 2B and 3A had no lead contamination while the highest value of lead was found in site 3B. All the water samples analysed for lead contamination are within the limit specified by WHO (2008) except site 1A and 3B. All the water samples contained zinc in high proportion with site 3A having the highest value of 8.60±0.85 and 2B with the least value of 6.00±0.28 which are well above the limit specified by WHO (2008). The results of the heavy metal analysis of water samples from the six stations showed that zinc, cadmium and copper levels were higher in all water samples than the other heavy metals tested. This study revealed that the values of the heavy metals in the water samples were found to be above the standard maximum concentrations of WHO standard (WHO, 2008). The results from these findings are in agreement with the findings of Jingxi et al. (2020). Anthropogenic activities continuously increase the amount of heavy metals in the environment, especially in the aquatic ecosystem (Abdel-Baki et al., 2011). High concentration of zinc, cadmium and copper can be as a result of the leaching from piping and fitting and corrosion of interior copper plumbing into the streams. Heavy metals are usually present in trace amounts in natural waters but many of them are toxic even at very low concentrations (Harawati et al., 2000). Heavy metals have the ability to bio accumulate and biomagnify in the food chain and finally be assimilated by human consumers resulting in health risks (Ojebah & Emumejeya, 2015)
The physicochemical properties of water such as dissolved oxygen, electrical conductivity, total dissolve solid, pH, temperature and heavy metals provide useful information on water quality or the potential of water for aquaculture purposes other uses. This study revealed that most of the physicochemical parameters of the streams and wetland in Nnamdi Azikiwe University, Awka were found to be within the recommended limits of WHO. On the other hand, the heavy metals: cadmium, copper, Iron, lead and zinc whose levels surpassed the maximum concentration level. Therefore, the stream and wetland in Nnamdi Azikiwe University, Awka are suitable for fish farming if property treated for removal of heavy metal contamination. The observed high levels of some phsiochemical parameters in this study could be attributed to anthropogenic sources such as indiscriminate disposal of industrial, domestic and farm effluents on land and streams. The results obtained from this present study shall be useful in future studies of the Nnamdi Azikiwe University streams and wetland and the Ezu River where it discharges into.
Given the ecological and health risks associated with heavy metal pollution, we recommend that efforts should be made to purify the water from these streams and wetland before being deployed for use in aquaculture. This study, therefore recommends continuous monitoring and proper quality control of the effect of anthropogenic activities on the streams and wetland physicochemistry Further study should be carried out on fish already being raised with these water sources to ascertain if there is bioaccumulation of these heavy metals in them and the extent of risk Provisions should also be made for adequate information on the suitability of the waters from the streams and wet-land of Unizik for aquaculture.
We wish thank the Biotechnology Research Centre, Nnamdi Azikiwe University, Awka for their assistance in running some of the analyses of this study.
ISSN 2348-1218 (print) International Journal of Interdisciplinary Research and Innovations ISSN 2348-1226 (online) Vol. 9, Issue 3, pp: (52-58), Month: July - September 2021, Available at: www.researchpublish.com
[1] Abdel-Baki AS, Dkhil MA & Al-Quraishy S 2011. Bioaccumulation of some heavy metals in tilapia fish relevant to their concentration in water and sediment of Wadi Hanifah, Saudi Arabia. Afr. J. Biotechnol., 10: 2541-2547.
[2] American Public Health Association ( 2012) Standard Methods for Examination of Water and Waste Water, 22nd edition, American Public Health Association (APHA) Press.. Washington, DC, USA:
[3] USGS 2009. Earth's water distribution. United States Geological Survey. Retrieved 2009-05-13.
[4] Eyo, (2001). Aquaculture a veritable component of agriculture. Journal of National Association of Fisheries Students of Unizik chapter (NAFIS NAU), 1: 2.
[5] Feng Q, Liu W, Su YH , Zhang YW & Si JH (2004). Distribution and evolution of water chemistry in Heihe River basin. Environmental Geology, 45: 947-956
[6] Herawati N, Suzuki S, Hayashi K, Rivai IF & Koyoma H. 2000. Cadmium, copper and zinc levels in rice and soil of Japan, Indonesia and China by soil type. Bulletin of Environmental Contamination and Toxicology. 64:33-39.
[7] Hynes HBN (2000). The Ecology of Running Waters. Liverpool University Press, Liverpool, UK, 555p.
[8] Ibrahim S 2009. A survey of Zooplankton Diversity of Challawa River, Kano and Evaluation of some of Its PhysicoChemical Conditions. Bayero Journal of Pure and Applied Sciences. 2(1): 19-26.
[9] Jannat N, Mottalib MA & Alam MN 2019. Assessment of Physicochemical Properties of Surface Water of Mokeshbeel, Gazipur, Bangladesh. J Environ Sci Curr Res 2: 014.
[10] Jingxi M, Shuqing W, Ravi Shekhar NV, Biswas S & Sahu AK 2020. Determination of Physicochemical Parameters and Levels of Heavy Metals in Food Waste Water with Environmental Effect.; 8886093.
[11] Kiros GG, Goitom GB, Amanual HT & Samuel EG 2021. Assessment of Some Physicochemical Parameters and Heavy Metals in Hand-Dug Well Water Samples of Kafta Humera Woreda, Tigray, Ethiopia, International Journal of Analytical Chemistry, Article ID 8867507, 9 pages, https://doi.org/10.1155/2021/8867507
[12] Mason C 2002. Biology of Freshwater Pollution, Pearson Education Limited (4th edition), Edinburgh Gate., UK.
[13] Moyo NAG & Mtetwa S 2002. Water quality management strategy for Zimbabwe. Government Zimbabwe. Minimum Rural Resource of Water Development: Water Resource Management Strategy, 137.
[14] Murray K, Du Preez M & van Ginkel C 2005. Design and development of an implementation plan for a national eutrophication monitoring programme. Water Research Commision Report, 1147/1/05.
[15] Mustapha MK 2008. Assessment of the Water Quality of Oyun Reservoir, Offa, Nigeria, using Selected Physicochemical Parameters. Turkish Journal of Fisheries and Aquatic Sciences, 8: 309 - 319.
[16] Mutisya KD & Tole M 2010. The impact of irrigated agriculture on water quality of Rivers Kongoni and Sirmon, Ewaso Ng’iro North Basin, Kenya. Water Air Soil Pollut. 213:145-149.
[17] Okoye CO 2016. Comparative Limnological Studies of Nnamdi Azikiwe University (Unizik) and Amansea Streams in Awka South L.G.A., Anambra State, Nigeria. Scientific Review 2(4): 53-56.
[18] Ojebah CK & Emumejaye K 2015. Heavy metal concentrations of some fish species consumed in Ozoro, Delta State, Nigeria. Int. J. Sci. Eng. Res., 6: 630-635.
[19] Patil PN, Sawant DV & Deshmukh RN 2012. Physico-chemical parameters for testing of water: A review. Int. J. Environ. Sci., 3: 1194-1207.
[20] Seher D 2015. Assessment of water quality using physico-chemical parameters of Camlıgöze Dam Lake in Sivas, Turkey. Ecologia, 5: 1-7.
[21] Stirling HP ed 1985. Manual: Water Analysis for Aquaculturists. Institute of Aquaculture, University of Stirling, Stirling, UK, 117p.
ISSN 2348-1218 (print)
International Journal of Interdisciplinary Research and Innovations ISSN 2348-1226 (online) Vol. 9, Issue 3, pp: (52-58), Month: July - September 2021, Available at: www.researchpublish.com
[22] Tawati F, Risjani Y, Djati MS, Yanuwiadi B & Leksono AS 2018. The analysis of the physical and chemical properties of the water quality in the rainy season in the sumber maron river- Kepanjen, Malang- Indonesia. Resources and Environment, 8: 1-5.
[23] Usharani K, Umarani K, Ayyasamy PM, Shanthi K & Lakshmanaperumalsamy P 2010. Physico-chemical and bacteriological characteristics of noyyal river and ground water quality of Perur, India. Journal of Applied Sciences and Environmental Managements, 14: 29-35.
[24] Varol M & Sen B 2012. Assessment of nutrient and heavy metal contamination in surface water and sediment of the upper Trgris River, Turkey. Cat. 92:1-10.
[25] Voutsa D, Manoli E, Samara C, Sofoniou M & Stratis I 2001. A study of surface water quality in Macedonia, Greece: speciation of nitrogen and phosphorus. Water, Air, and Soil Pollution, 129: 13–32.
[26] WHO 2008. Guidelines for Drinking Water Quality, World Health Organization, Geneva, Switzerland.
List of table: Table 1: Physicochemical parameters of the streams and wetland in Unizik (mean±SD)
Parameter
Site 1A Site 1B Site 2A Site 2B Site 3A Site 3B WHO STD
DO(mg/L) 9.22ab±1.37 8.63ab±1.04 7.97b±0.23 5.23c±2.83 11.24a±0.23 10.32a±0.45 5-10 EC (µS/cm) 152.33b±2.08 183.67a±2.08 58.00d±2.00 117.67c±18.77 37.67e±0.58 38.00e±0.00 1000 TDS (mg/l) 120.00b±0.10 130.00a±2.3 30.00d±0.00 70.00c±0.00 20.00e±0.00 30.00d±0.00 500 pH 8.67ab±0.22 9.38ab±0.82 10.07a±1.71 8.77ab±0.56 8.21b±0.22 8.55ab±0.22 6.5-8.5 Temp oC 30.20b±0.98 28.93b±0.40 29.73b±0.64 29.23b±1.12 33.50a±1.80 33.97a±3.109 25-30
abcMeans with different superscripts on the same row are significantly different at p<0.05.DO: dissolved oxygen; EC: electrical conductivity; TDS: total dissolved solids
Table 2: Heavy metal concentrations of the streams and wetland in Nnamdi Azikiwe University, Awka (mg/L, mean±SD).
Parameter Site 1A Site 1B Site 2A Site 2B Site 3A Site 3B WHO
Cadmium 0.22a±0.02 0.11a±0.06 0.18a±0.02 0.11a±0.07 0.14a±0.00 0.12a±0.08 0.01
Copper 2.50a±0.71 7.05b±0.64 13.80ab±1.41 7.20b±3.54 16.60c±0.28 3.55a±0.49 0.5
Iron 0.00c±0.00 1.25a±0.07 0.00c±0.00 1.30a±0.14 0.70b±0.00 1.40a±0.14 0.3
Lead 0.07a±0.04 0.00c±0.00 0.00c±0.00 0.00c±0.00 0.00c±0.00 1.20b±0.12 0.01
Zinc 7.40a±0.14 6.75a±0.07 8.10a±1.56 6.00a±0.28 8.60a±0.85 7.05a±0.49 0.2
abcMeans with different superscripts on the same row are significantly different at p<0.05.