29 minute read
TRANSICIÓN ENERGÉTICA ARGENTINA. EL NUEVO ESTÁNDAR DE EFICIENCIA ENERGÉTICA EN LA EVALUACIÓN DE LA VIVIENDA SOCIAL. CASO DE ESTUDIO: VIVIENDA DE BARRIO PAPA FRANCISCO

Recibido 24/02/2020 Aceptado 10/07/2020
ARGENTINEAN ENERGY TRANSITION. THE NEW ENERGY EFFICIENCY STANDARD IN THE EVALUATION OF SOCIAL HOUSING. CASE STUDY: DWELLING IN PAPA FRANCISCO NEIGHBORHOOD
Advertisement
ERNESTO KUCHEN Doctor en Arquitectura Investigador CONICET - Subdirector del Instituto Regional de Planeamiento y Hábitat. Docente e Investigador Facultad de Arquitectura Urbanismo y Diseño Instituto Regional de Planeamiento y Hábitat - Consejo Nacional de Investigaciones Científicas y Técnicas (CONICET) - Universidad Nacional de San Juan (IRPHa-UNSJ-CONICET) San Juan, Argentina http://orcid.org/0000-0001-6649-6932 ernestokuchen@faud.unsj.edu.ar DANIEL KOZAK PhD in Built Environment Investigador CONICET - Director del Centro de Investigación Habitat y Energía. Universidad de Buenos Aires (CIHE-FADU-UBA) Centro de Estudios Urbanos y Regionales (CEUR)- Consejo Nacional de Investigaciones Científicas y Técnicas (CONICET)-Centro de Investigación Habitat y Energía (CIHE-FADU-UBA) Buenos Aires, Argentina https://orcid.org/0000-0003-3118-8950 daniel.kozak@conicet.gov.ar
RESUMEN El sector edilicio es responsable del 40% de la demanda energética a nivel internacional y el 37% en Argentina. La climatización constituye el ítem más representativo. Los países instituyen medidas para el uso racional de la energía y persiguen estrategias a fin de provocar la transición energética. La aprobación del estándar IRAM 11900 en Argentina promueve la Eficiencia Energética (EE) en el sector edilicio residencial que se pretende, sea inclusivo y conduzca a la transición al 2050. El objetivo del trabajo es la evaluación termo-energética de un prototipo existente de vivienda de interés social del Barrio Papa Francisco y sus variantes mejoradas “retrofit” y “ex ante”, desde el enfoque de la norma. Para ello se relevan dimensiones, sistemas constructivos, componentes de la envolvente y equipamiento para cubrir demandas de calefacción, refrigeración, agua caliente sanitaria e iluminación. Como resultado relevante, el índice de prestaciones energéticas (IPE) del prototipo existente alcanza un valor de 132 kWh Prim. /m 2 .año. Además, las variantes mejoradas “retrofit” y “ex ante” conducen a ahorros económicos considerables en la inversión inicial. De aquí que se valora la importancia de implementar software de análisis en la etapa de proyecto para cuantificar los recursos energéticos y el ahorro de emisiones en una transición energética planificada. Palabras clave indice-ipe, vivienda social, norma iram-11900:2017, etiquetado energético
ABSTRACT The building sector is responsible for 40% of the energy demand internationally, and for 37% in Argentina. Heating and cooling are the most representative item. Rational energy usage measures are being introduced in countries throughout the world, as well as strategies that pursue energy transition. The passing of the IRAM 11900 standard in Argentina promotes energy efficiency (EE) in the residential building sector, and it is expected to be inclusive and lead to the transition by 2050. The aim of this work is to perform the thermo-energy evaluation of an existing social dwelling prototype in “Barrio Papa Francisco” (Pope Francisco Neighborhood), as well as in its two improved variations: “retrofit” and “ex ante”. For this, information is collected about the dimensions, construction systems, building envelope components and equipment to meet demands for heating, cooling, domestic hot water and lighting. As a relevant result, it is reported that the energy supply index (IPE, in Spanish) of the existing prototype reaches a value of 132 kWh Prim. /m 2 .year. In addition, the retrofit and ex ante variations lead to considerable economic savings in the initial investment. This is why the importance of implementing software analysis at the design stage is considered as important in order to quantify energy resources and emissions savings in a planned energy transition.
INTRODUCTION
At an international level, energy transition actions differ depending on the economies and social structures of countries. STET Models or Socio-Technical Energy Transition Models, allow detecting foci and dynamics Secretariat of the Nation – SEN, 2020). The purpose
that guide countries in their transitions, raising the discussion about the participation of technologies in their economies and the carbon emissions and targeted energy demand values (Li, Trutnevyte & Strachan, 2015). Emerging economies prioritize changes in biomass use for modern energy vectors. Strategies in developed countries, like the United Kingdom, France and The Netherlands, range from retrofit models for the building envelope in energy conservation, through ex-ante energy efficiency planning, to territorial development models for the sustainable growth of new neighborhoods. Germany, a pioneer in energy transition, has developed, for almost two decades, the ENOB - Energie Optimiertesbauen – program, (or Optimized Energy Construction, in English), which focuses on reaching a primary energy demand for lighting, heating/cooling and ventilation of 100 kWh Prim ./ m²y, based on ex-ante planned models (Kuchen, Plesser & Fisch, 2012). Today, they are moving forward with the Ministry of Economy and Energy’s ENERGIE WENDE BAUEN 2020 program (Program for Energy Transition in Construction) 1 , called Energieoptimierte und klimaneutrale Gebäude der Zukunft (Building planning energy-environmental and thermal comfort benefits
with energy efficiency and neutral environmental impact in English), promoting models of low primary energy demonstration projects, with renewables, and emissions reduction in the 4 phases of the service life.
The Argentine transition pursues, by 2050, the diversification of the energy mix with renewables, Energy Efficiency (EE) in the dwelling, electrification of the end energy, digitalization of data and the change of strategies to lower emissions in industry, forestry and farming (Fernández, 2019); a plan that brings together contributions from international experience. The residential sector, responsible for almost 80% of the consumption of resources within the building sector for the caloric demand (Chevez, 2017), as well as having the highest potential action, is subject to becoming the extension (Riavitz, Zambon & Giuliani, 2015).
The goal of the National Housing Labeling Program in Argentina is introducing the EE Label as a tool that provides users with information about the energy performance of the dwelling (Alonso Frank & Kuchen, 2017). The standard, which highlights the approach models of ex-ante and retrofit situations, intends on also generating added value to properties (Energy of the label is becoming a decision-making tool on carrying out, with environmental awareness, a property development operation: assessing a new project or intervening in existing dwellings (SEN, 2020).
The method to obtain the energy performance index (IPE, in Spanish), standardized in the reference standard (IRAM 11900, 2017), represents the “primary energy” requirement by unit of surface and year [kWh Prim. /m 2 year], to satisfy the heating, cooling, sanitary hot water and lighting needs of the dwelling. According to Risuelo (2010), labelling should provide information about different measures and investments, at a technological level, of the management and the cultural habits of the citizens.
The initial decisions at the projects’ conception are the most determining factors and offer a better balance in the cost-benefit ratio. Correctly deciding on the orientation of a building and the degree of compactness, sizing glazed surfaces based on the climatic characteristics of the location, ceteris paribus, should not be more demanding than negligent practices. In addition, any correction during the works themselves tends to be extremely difficult (Kozak, Evans, Adamo, Abálsamo & Romanello, 2017).
In the same way, the choice of structural materials and design operations regarding openings, the location of edges and offsets of the glazed surface, has a strong impact on the equation of economic costs versus the Achilles heel in the transition, due to its diversity and
(Evans, De Schiller and Kozak, 2015).
As the project and construction progress, opportunities close and to achieve a balanced thermal-energy performance, more money must be invested. The same occurs with sustainability-related decisions, like the choice of a material considering its environmental impact, starting from the energy involved in its production and that used during its transportation, or the degree of environmental health of the industrial process during its manufacturing (Brent & Petrick, 2007). This work presents the study of given construction strategy alternatives, possible options to be implemented in a domestic energy transition, where the economic costs and performance are assessed. As a rule of thumb, the earlier EE and sustainability strategies are included in an architecture project, greater benefits will be achieved at lower costs.
1 Energie Wende Bauen. Energieoptimierte und klimaneutrale Gebäude der Zukunft. Bundesministerium für Witschaft und Energie. BMWE 2020. Retrieved from https://projektinfos.energiewendebauen.de/forschung/ forschungsfoerderung/energieoptimiertes-bauen/
METHODOLOGY
As a first step, in methodological terms, a representative unit of the Papa Francisco Neighborhood is identified. Then field work takes place to collect the data to be analyzed. Features like geo-referential characteristics, technical-constructive characteristics (wall, flooring, roof and openings), proximities, solar obstructions, thermal areas, non-climatized or uninhabitable rooms are collected, as well as the equipment to cover heating, cooling, sanitary hot water and lighting demands and the contribution of renewables. To evaluate the energy performance of the unit, the requirements of the IRAM 11900: version 2017 standard are considered, and for the calculation, the Housing Labeling reference IT application (software) is used. Depending on the results obtained from the reference unit, improvements are made to the construction components of the opaque (solid) and transparent (windows) envelope in the retrofit applications, that is to say, the retroactive adaption of the finished dwelling and ex-ante, namely, simulating the draft stage prior to building the dwelling. Apart from the energy advantages of addressing different strategies, in a process leading towards an energy transition applied through this type of models, the economic and environmental suitability are assessed.
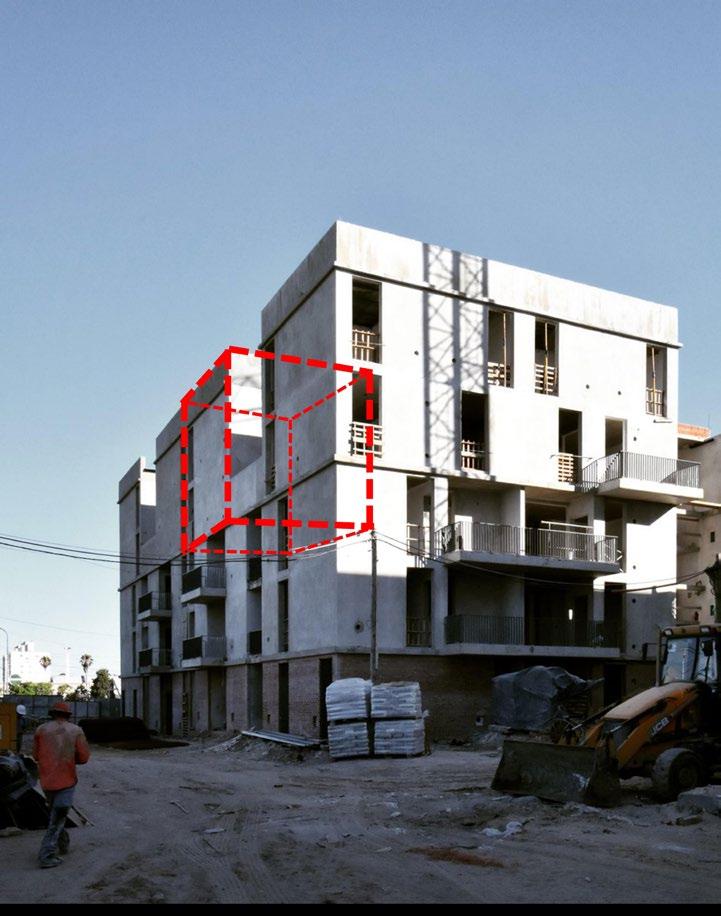
a) Progress of the works, 2019.
b) Location of the object of study.
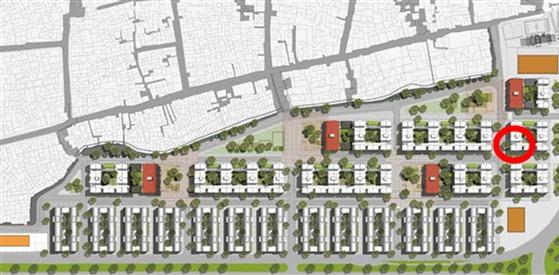
Figure 1. Intervention of social housing in the Papa Francisco Neighborhood. Source: City Housing Institute (IVC, in Spanish). Buenos Aires.
a) Unit identified with hashed red line.
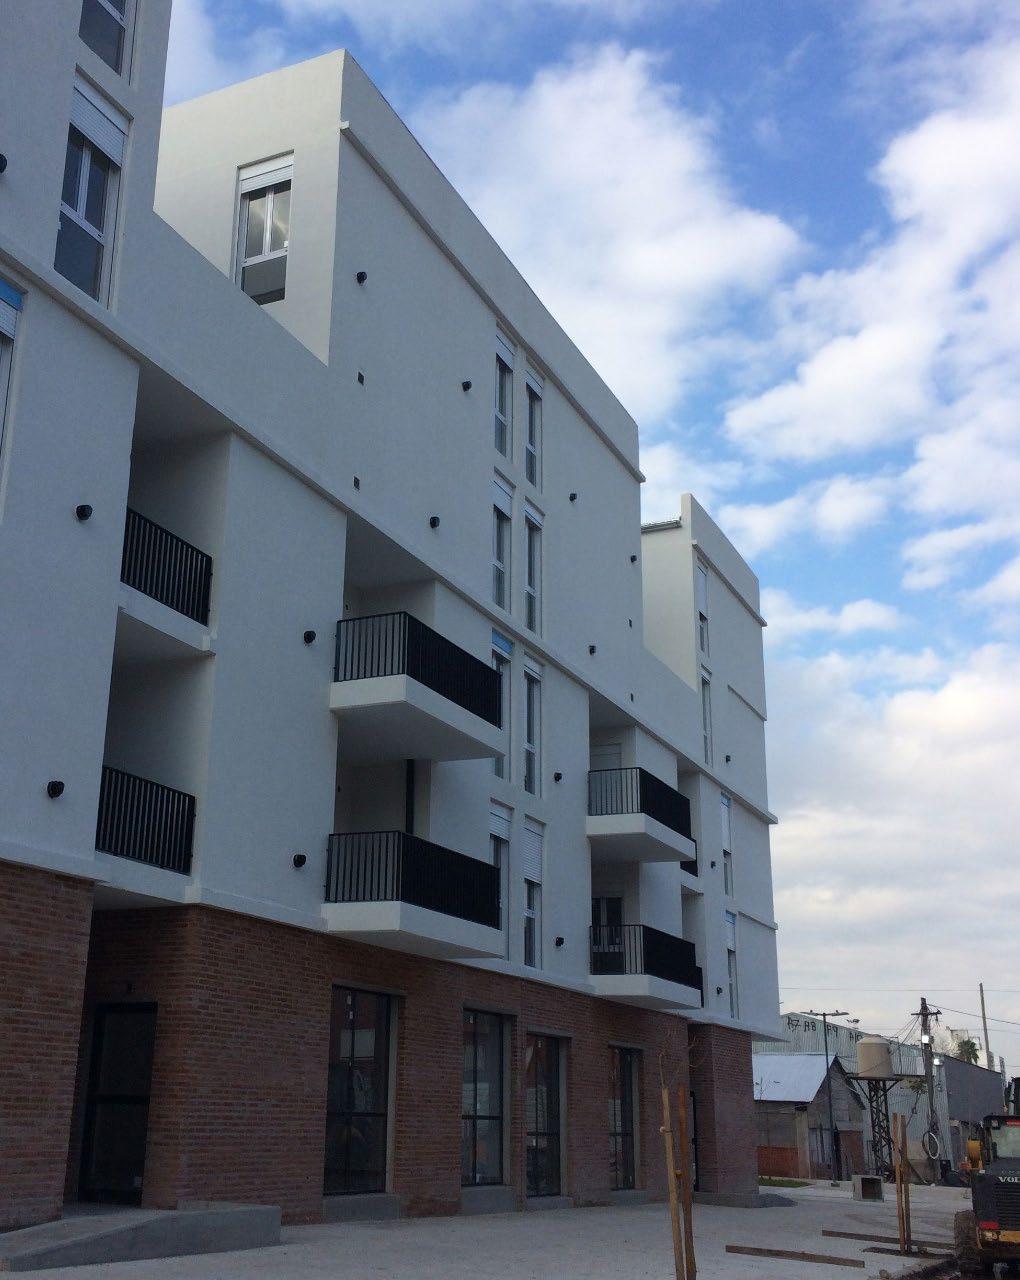
b) Finished facade and commercial boulevard on Ground Floor.
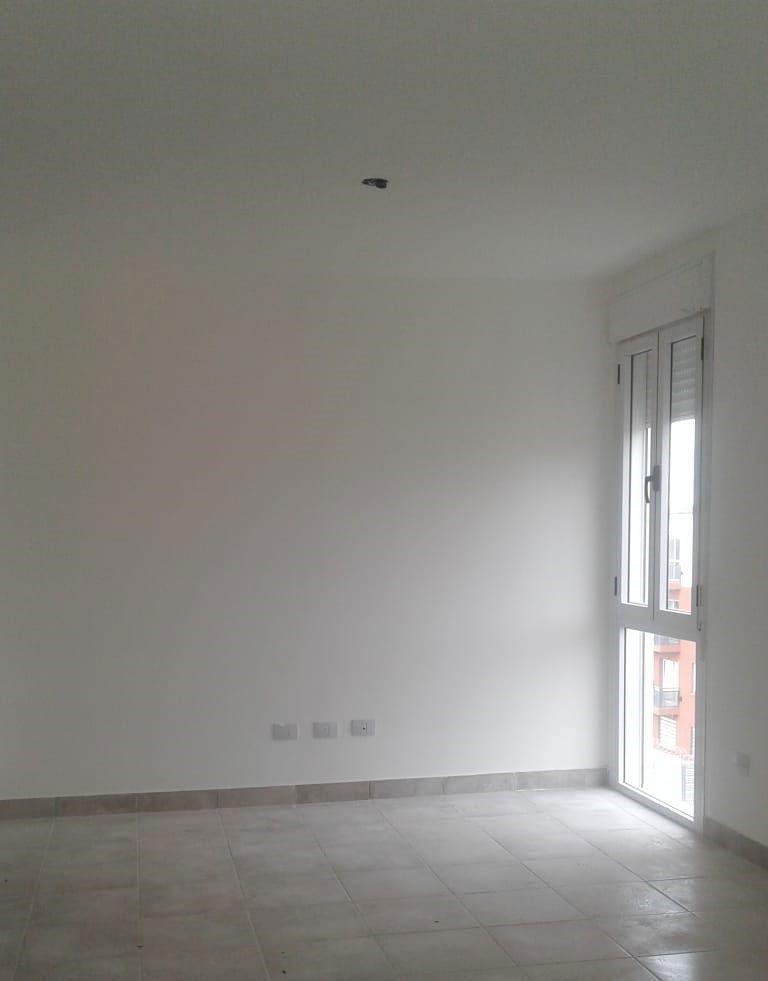
c) Indoor Surface finish and aluminum opening
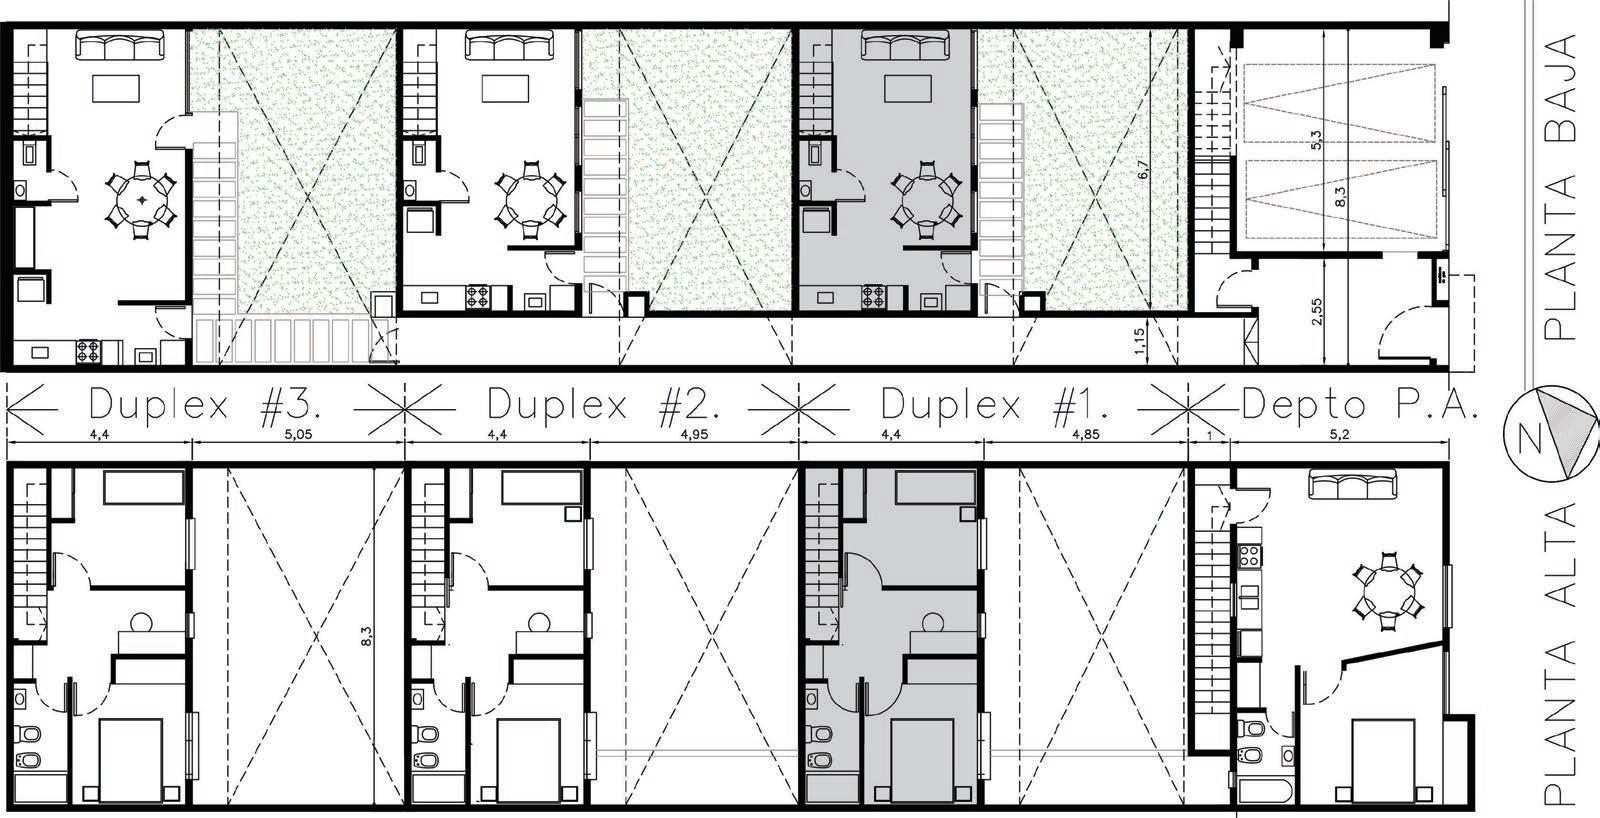
IDENTIFICATION OF THE CASE STUDY
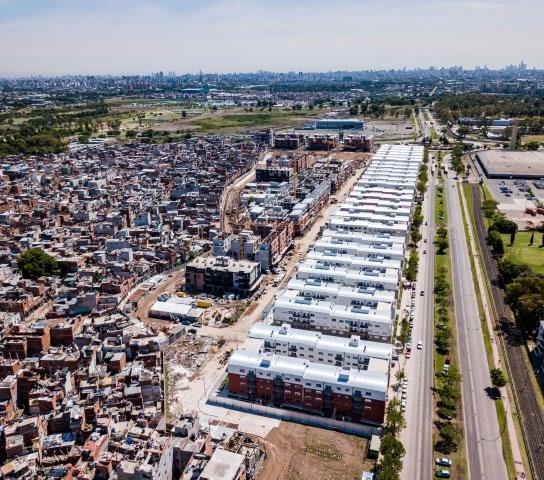
27,000 people live in Villa 20, in 4,581 dwellings (48 hectares). The “neighborhood integration” proposal (City Housing Institute – IVC, 2016) consists of generating 1,700 new habitational units (Figure 1a). An existing prototype is chosen as a social housing case study for the relocation of Villa N° 20 to the Papa Francisco Neighborhood, in Villa Lugano, Province of Buenos Aires, in bioenvironmental zone III-B. This has a warm-humid template climate, as per the IRAM 11603 standard’s rating (2012), with a mean winter temperature of 12.8°C (min of 9.7°C and max of 16°C) and of 23.3°C in summer (min of 19.6°C and max of 27°C), with an environmental relative humidity of 77% in winter and 69.3% in summer. The heating energy demand based on a 20°C comfort, as per IRAM 11603 (2012), is 1249 degrees/day. The “compact typology” prototype is the standard, within the set of other buildings with similar characteristics (Figure 1b).
TECHNICAL-CONSTRUCTION CHARACTERISTICS
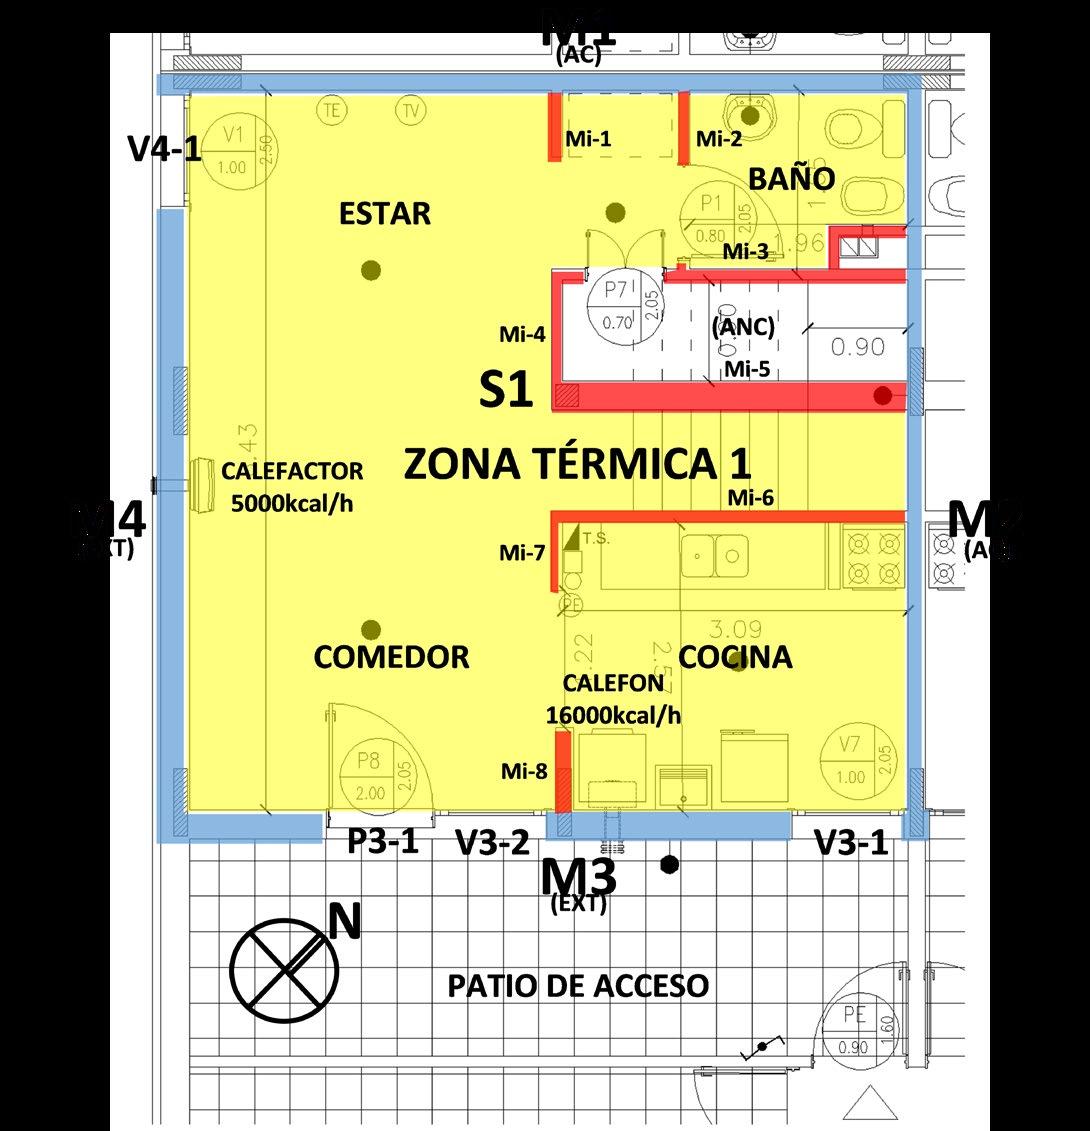
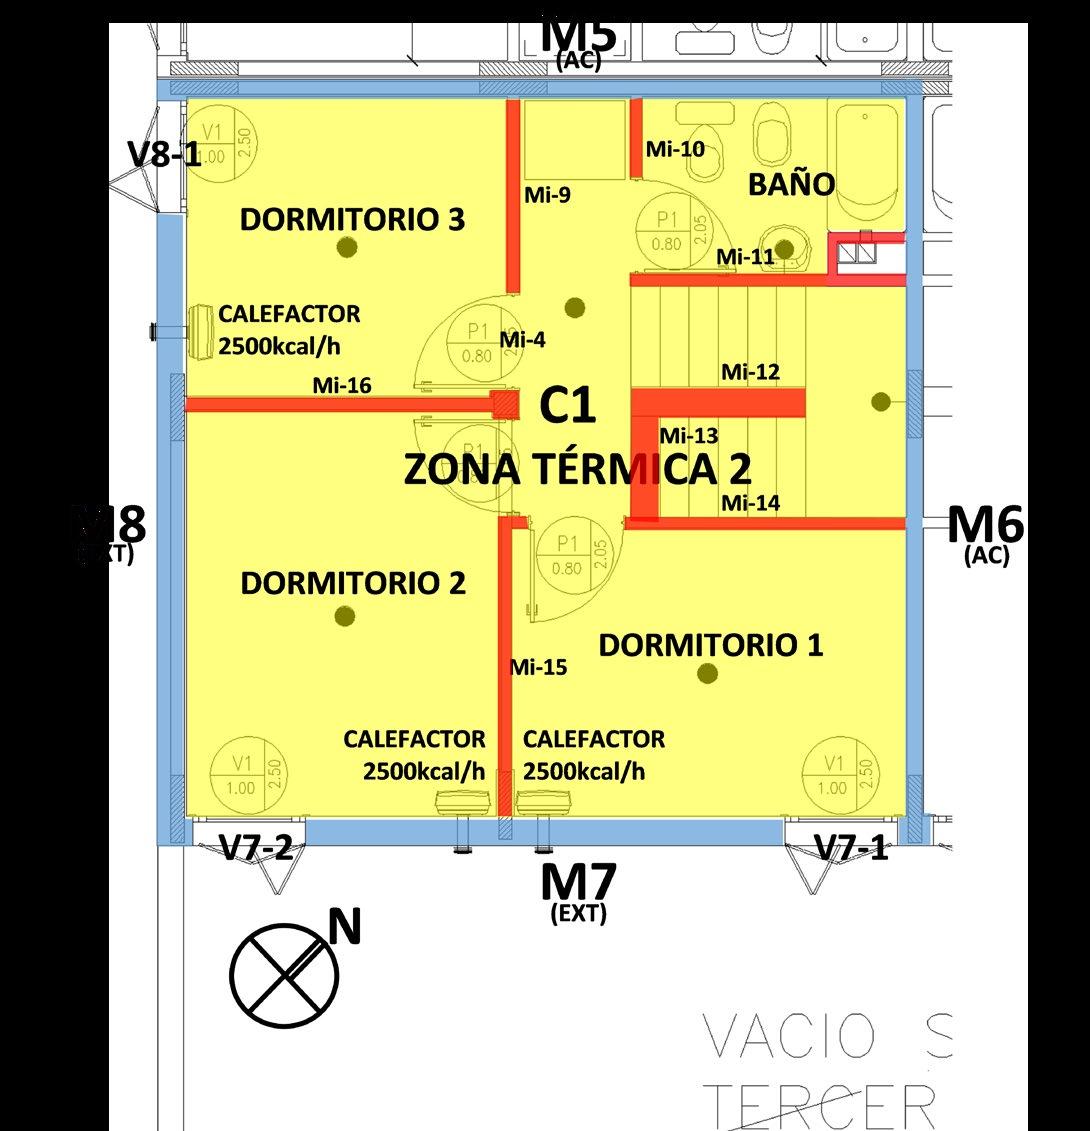
The property under study is located on the third floor of a block of apartments, which is reached by stairs. It is grouped into 8 apartment sub-blocks of 5 floors each (Figure 2a), with a commercial boulevard on the Ground Floor and onefloor apartments on the 1 st and 2 nd floors (Figure 2b). The prototype is a duplex with a 78.6m 2 floor plan, an indoor height of 2.6m (Figure 2c) and a volume of 204.5 m 3 . The program comprises an exterior access hall with that leads to a living-dining room, a kitchen and bathroom on the ground floor and 3 bedrooms with a full bathroom on the top floor (Figure 3). The envelope comprises 18 cm ceramic hollow block walls, with a 3 cm Isolteco type heat-insulating external white plaster, internal 2 cm Revear type plastic indoor plaster (white), with a transfer coefficient of K=1 W/m 2 K; galvanized sheet roof, insulated with 5 cm of glass wool and ceiling with 1.5 cm (white) plasterboard, K=0.72 W/m 2 K and beige tiled flooring K= 2.9 W/m 2 K (floor-to-ceiling). The openings, 1m in width and 2.10m in height which can be opened, are made of white aluminum, with double contact and simple glazing. As a solar protection, they have PVC white roller blinds, with roller blind box above the top frame, at the height of the door-head (Figure 2c), K=3.68 W/m 2 K.
EQUIPMENT
This is meant to cover the requirements to ensure quality of life, keep indoor temperature >20°C in winter and <26°C in summer, hot water (42°C) and lighting in indoor rooms >300 Lux. For heating, it has an installed power of 5.82 kW, in balanced draft heaters, 1 of 5000 kcal/h and 3 of 2500 kcal/h. For Sanitary Hot Water (ACS in Spanish), a 16000 kcal/h boiler (see Figure 3), in lighting, LED lights with a total of 72W. It does not have installations for cooling. There are no Renewable Energies present.
a) Ground floor of the duplex prototype.
b) Top floor of the duplex prototype
RESULTS AND DISCUSSION
By implementing the calculation application software (Housing Labeling, 2020) that the Energy Secretariat of the Nation promotes (SEN, in Spanish, 2020), following the requirements of the standard (IRAM 11900, 2017), the dynamic characteristics, requirements and thermal-energy behavior indicators are calculated, to analyze decision variants for the efficiency and energy restructuring of dwellings.
DYNAMIC ENERGY CHARACTERISTICS
The dynamic energy characteristics refer to the relationship between the contributions and losses of each period where there is additional energy demand. Starting from the simulation, it is noted that, from all the free contributions, 30% is captured in winter and it is possible to take advantage of almost all of it (97%). Conversely, the loss percentage through ventilation and thermal energy conduction from the envelope in summer (thermal dispersion) is 48%, of which less than half can be taken advantage of (47%). The location of the prototype has unfavorable sunlighting conditions regarding the “free contributions” and effective ventilation for “thermal dispersion”.
The degree of compactness of the property may be beneficial. In this aspect, the ratio between the envelope area and climatized volume “A/V”, measured in [m -1 ], is 1.5 m -1 (good). The “heat transfer factor” is added to this benefit. This refers to the location of a unit over the whole, with a non-dimensional value of 0.36 (low) on a scale of 0-1. From this, it is seen that the location is beneficial in winter. The ventilation strategy of the dwelling plays a fundamental role in the “thermal dispersion”, this having to be assured in summer, especially during the night when outdoor temperatures fall, due to cross ventilation.
The “heat transfer factor” is reflected in the “global heat transfer coefficient (H)” value, which indicates that for each degree of indoor-outdoor temperature difference, an energy requirement must be guaranteed in accordance with the seasons of the year. For this prototype, H is 106 W/K in winter (low) and 2.6 times higher in summer, 274 W/K (high). A low H coefficient indicates better “time constant” levels, measured in hours [h], that is to say, the thermal capacity of the envelope to absorb the indooroutdoor thermal jump, being 28.5 h for winter and 11 h for summer.
ENERGY PERFORMANCE INDEX (IPE)
The IPE represents the primary energy value [kWh Primary Energy / m 2 .y] regarding the environmental impact of the energy use required, and its value shows the energy efficiency level. Table 1, regarding the evaluated prototype, shows
Type of Energy measured in [kWh / m2 . year] Useful
Heating 47
Cooling 12
Sanitary Hot Water Production 12
Lighting Global specific energy requirement Specific contribution of renewable energies
Energy Performance Index, IPE. [kWh / m2 . year]
Net
72
5 16
1
0
132
Primary
90
18
20
4
132
Table 1. Total energy required to cover thermal and lighting demands of the dwelling.Source: Preparation by the authors.
“useful, net and primary energy” values which must be provided to the system, by useful [m 2 ] of the property in one year. The resulting IPE in Table 1, of 132 kWh Prim. /m 2 .y, is a reference value of the primary energy requirement and that, in relation to the average, in the label corresponds to Category D (yellow), that is to say, “mean or standard quality” as per IRAM 11900:v.2017.
The “useful energy” is the thermal energy that will allow maintaining the indoor temperature ≥ 20°C in winter with Heating (47 kWh/m 2 .y), ≤ 26°C in summer with Cooling (12 kWh/m 2 .y) and the Sanitary Hot Water ≥ 42 °C (12 kWh/ m 2 .y). These energy values found for this 78.6 m 2 property will vary by climate zone, shape, sunlighting, compactness, infiltrations and insulation, among other factors. The “net energy” represents the energy the dwelling requires to cover the thermal and lighting demand (electricity and/or gas). This indicator allows reflecting the performance of the installed equipment. The “primary energy” is the energy that needs to be obtained, before being transformed and/ or transported, to be provided as thermal or light energy to the room. To calculate it, “reduction factors to primary energy” are used and its value will depend on the type of energy matrix. For the case of Argentina, the gas to primary energy vector reduction factor will be 1.25, and for electricity, 3.3.
HEATING
“Balanced draft gas heater” heating is reflected on observing that, to provide 47 kWh Useful /m 2 .year, an additional amount of energy is needed, which is lost through the ventilation of the combustion gases. 72 kWh Net /m 2 .year must be consumed (see Table 1), that is to say, 65% more, without obtaining the thermal benefit. In the case of the “gas grid” vector, 90 kWh Prim. /m 2 .year is needed to cover the thermal demand, that is to say, an additional 25% over the net energy provided.
COOLING
The unit studied does not have cooling equipment, which does not mean that it is not needed. According to the calculations, to keep the indoors ≤ 26°C, 12 kWh Useful / m 2 .year are required. Unsuitable thermal conditions would lead the user to install, for example, a Split. The COP performance coefficient, EE class “A”, in Argentina is COP=3.3. This means that each unit of electricity provides 3.3 units of thermal energy. On not knowing the COP, the application provides a hypothetical value of COP=2.4 (Category C or D), requiring 5 kWh Net /m 2 .year (see Table 1). 18 kWh Prim. /m 2 .year are required for the electricity supply.
SANITARY HOT WATER
The useful thermal energy that has to be added to water to increase its temperature to 42°C is 12 kWh Useful. /m 2 .year, a value that depends on the useful surface of the dwelling and that will vary depending on the performance of the equipment. A gas boiler with instantaneous ignition and automatic pilot will be 30% more efficient than one which keeps the pilot on. The installed power in Sanitary Hot Water production (16000 kcal/h) covers the useful energy demand based on the conventional system that requires 16 kWh Net. /m 2 .year (30% more) and that, on being supplied through the gas grid, will require an additional 25%, namely, 20 kWh Prim. /m 2 .year.
LIGHTING
LED technology allows transforming almost all the net energy into useful, although the impact of using the electricity grid will continue to be high, as to provide 1 kWh Net. /m 2 .year, 4 kWh Prim.. /m 2 .year will be required.
RENEWABLE ENERGIES
The dwelling does not have renewable energies available. The assumption of including these technologies (solar, wind, biomass, geothermal, etc.) implies that the fraction generated for thermal or electrical self-consumption will reduce the total primary energy demand.
TOTAL ENERGY REQUIREMENT (GAS AND ELECTRICITY)
From the total energy requirement of the electricity 394 kWh Prim. /year and gas 4187 kWh Prim. /year vectors, the ones with the highest demand are heating 2944 kWh Prim /year and Sanitary Hot Water, 1243 kWh Prim /year. The cooling demand reaches 299 kWh Prim /year and the lighting demand is negligible.
TOTAL ENERGY REQUIREMENT BY THERMAL ZONE
On considering a duplex, two thermal zones must be identified (Figure 3): Zone 1 (Z1) on the Ground Floor and Zone 2 (Z2) on the Top Floor. There are no significant differences in the heating thermal demand in winter. Z1 has an energy requirement of 1779 kWh Useful /year and Z2 of 1914 kWh Useful /year. In summer, thermal dispersion is not effective, being 287 kWh Useful /year in Z1 and more than double in Z2, reaching 687 kWh Useful /year. This difference can be attributed to the low level of insulation and the high degree of exposure of the roof.
BEHAVIOR OF THE ENVELOPE
The energy differences seen in zones Z1 and Z2 lead to making a particular evaluation of the envelope, with its opaque components: wall (M), floor (S) and roof (C);
P3-1 9% V8-1 6% V7-2 6% V7-1 6% V4-1 9% V3-2 7%
Pérdidas energéticas en julioPérdidas energéticas en julio P3-1 M3 9% 6% otros V8-1 M4 5% 6% 10% V7-2 6% M7 6% V8-1 8% V7-1 6% M8 7% V7-2 6% V7-1 V4-1 6% 9% V4-1 V3-2 23% V3-1 8% 7% V3-1 8% C2 20%
a) Losses Ganancias energéticas de eneroGanancias energéticas de enero
M3 6% otros M4
M4 5% 7% 10%
M7 6% V8-1 8% C2 27%
M8 7% V7-2 6% V7-1 6% V3-1 V4-1 9% 23% V3-2
C2 9% 20%
b) Gains
M4 7%
C2 27%
V3-1 9% V3-2 9%
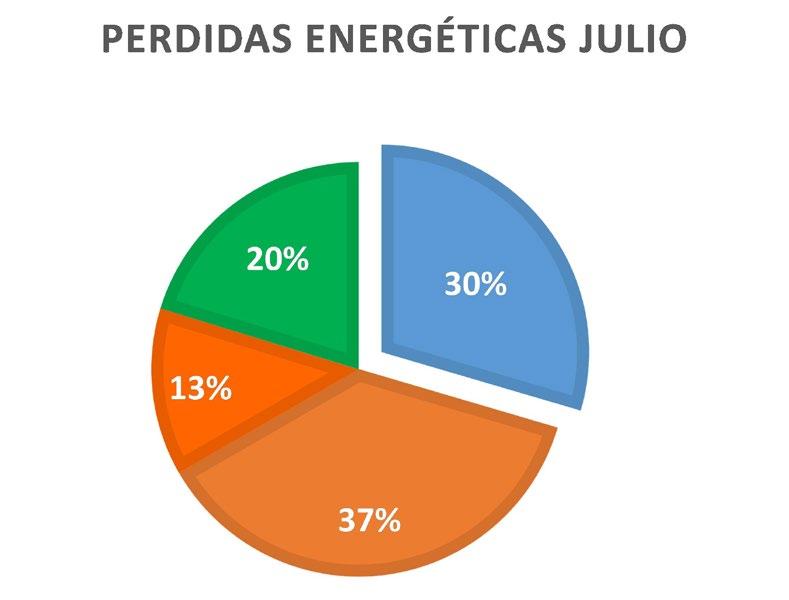
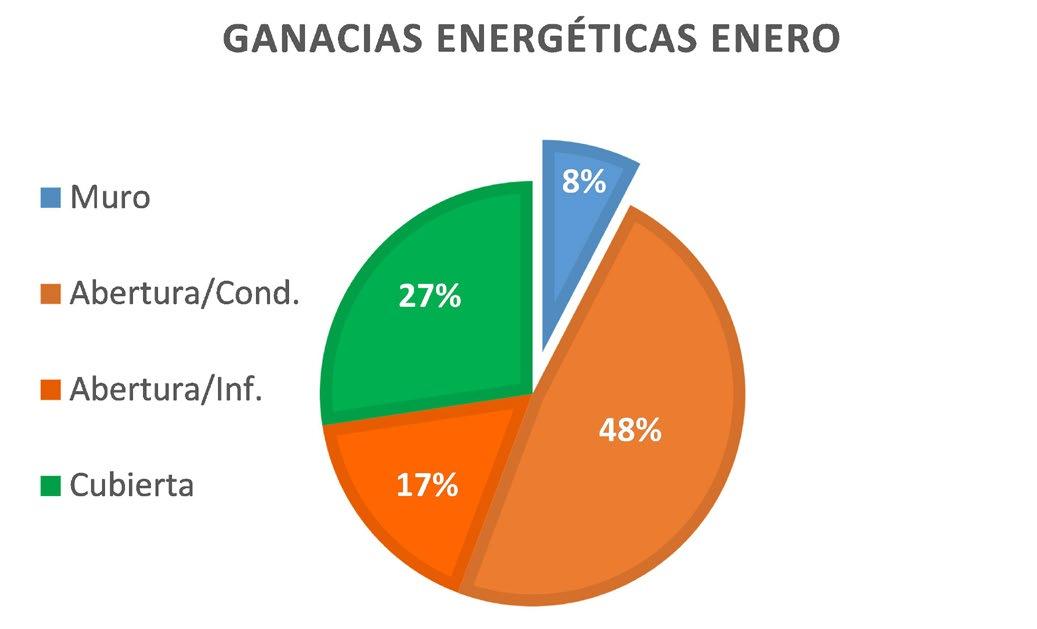
Figure 5. Losses and gains through the envelope, in July and January. Source: Preparation by the authors.
openings: window (V) and door (P). Figure 4 shows the percentage influence of the construction parts, regarding the energy requirement in the periods of highest monthly demand: July, through losses (heating) and January, through gains (cooling).
From the sum total of equivalent losses and gains, it is the roof (C2) in particular that is shown to be the most important, with losses equivalent to 20% in July and gains in January of 27% of the total. In addition, the wall (M4) corresponds to the highest loss in July and, above this, the opening (V4-1), that of highest gain in January (23%).
50% of the losses in July and 65% of the gains in January are due to the openings. If they are discriminated following the heat transfer mode, those that occur through leaks exceed by ¾ the transfer through conduction (Figure 5).
CALCULATION HYPOTHESIS
Improving the levels of delay, or in other words, reducing in hours the level of losses in winter and dispersion in summer, reconsidering the level of thermal transmittance of the envelope on walls and the roof, and of the insulation and leaks of the openings, allows correcting items with the highest impact, “heating and cooling” and conserving beneficial thermal conditions for human comfort at the minimum energy requirement.
Contrasting this hypothesis means analyzing to what extent the existing original project was thought of in terms of sustainability. After calculating and checking the insulation and thermal resistance conditions, as per the IRAM 11601 (2002) and IRAM 11549 (2002 standards – requirements considered in Provincial Law 13059 (2003) -, 3 (three) additional variants are simulated. One, a widespread construction type, called “conventional”; another where the existing dwelling is improved in the post occupation retrofit stage; and a final one where, in the architectonic project stage, decisions are made to reach the best EE and the lowest ex-ante environmental impact.
CONVENTIONAL
General walls: 2cm interior plastic, 18 cm ceramic hollow brick, 3 cm external plaster without insulation. K Value (thermal conductivity) = 1.54 W/m 2 K. Roof: Finish with 2cm plaster, 12 cm of reinforced concrete slabs without insulation, 0.03 cm asphalt membrane. K = 4.53 W/m 2 K. Openings: 50% larger opening than the existing one. Aluminum frame window, simple glazing, single leaf window, without solar protection. K = 5.8 W/m 2 K. Equipment: Just like the “existing one”.
RETROFIT
The following is added or changed to the existing one’s setup: • Outside wall. 3 cm coated heat-insulating plate. K = 0.55
W/m 2 K. • Roof: 8 cm glass wool layer added. K = 0.34 W/m 2 K. • Openings: Change of window frame, PVC and Double
Glazed 4+16+4, it can be opened, PVC roller blind. K = 1.91 W/m 2 K. • Equipment: Just like the “existing one”.
EX ANTE
New envelope: • Outside wall: 1.5 cm plasterboard, 7 cm air chamber, 10 cm PUR heat-insulating panel, outside plate finish. K = 0.26 W/m 2 K. • Roof: 1.5 cm suspended plasterboard ceiling, 10 cm unventilated air layer, 10 cm PUT heat-insulating panel for roofs. K = 0.25 W/m 2 K. • Openings: Window with PVC frame and double glazed 4+16+4, single leaf that can be opened, PVC roller blind. K = 1.91 W/m 2 K. • Equipment: Reduced (4 heaters, 1500 kcal/h.)
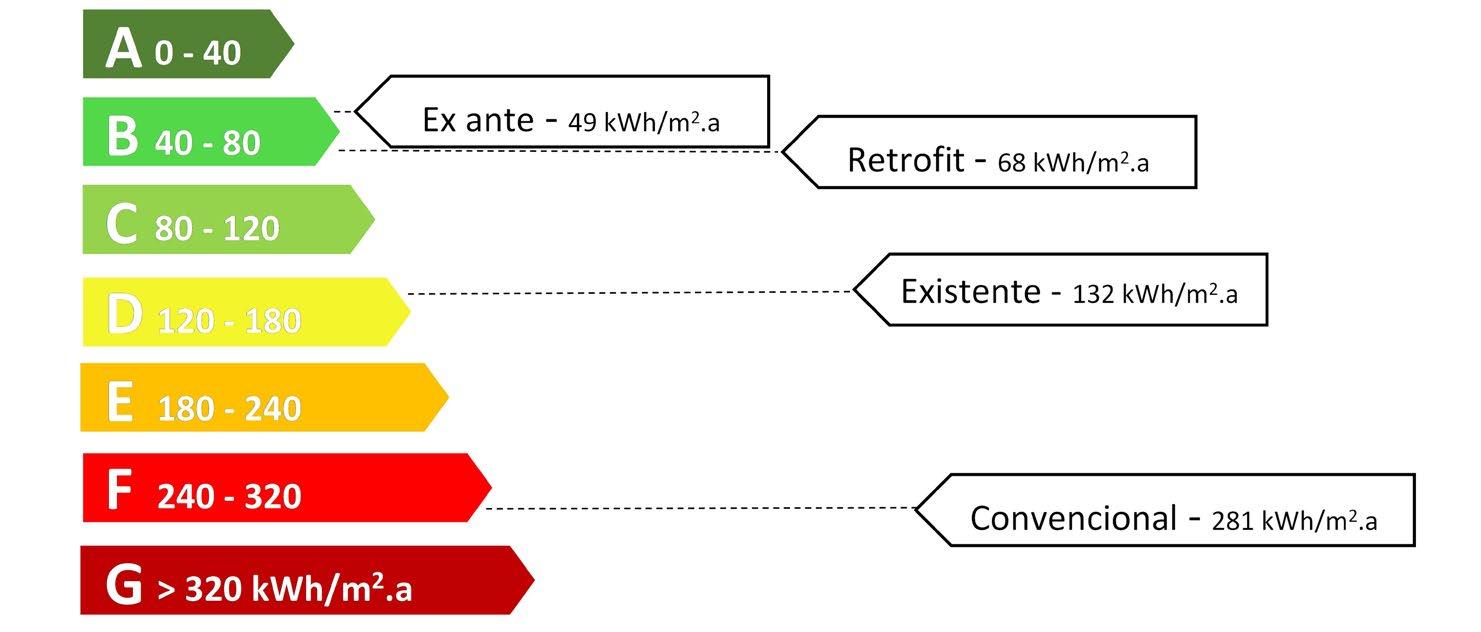
Figure 6. Energy Efficiency Label as per IRAM 11900:v.2017. IPE Values.Source: Preparation by the authors
.a] 2 Requerimiento energía primaria [kWh/m
300
250
200
150
100
50
0 Índice de Prestaciones Energéticas IPE [kWh Prim. /m 2 .año]
-53%
132 kWh Prim. /m 2 .a
U$D 880/m 2
-48% +16% U$D 995/m % 2
-63%
CONVENCIONAL
Calefacción
EXISTENTE
RETROFIT Variantes analizadas
Refrigeración Producción acs
EX ANTE
Iluminación
Figure 7. Primary energy requirements by variant and year. Source: Preparation by the authors. +6,8% U$D 940/m % 2
Variant
Existing one
Retrofit
Ex ante
IPE [kWhp/ m2.y]
132
68
49
Sup. [m2]
78.6
78.6
78.6
Energy [kWh/y]
10375.2
5344.8
3851.4
Year cost [$]
30243.708
15580.092
11226.831
Constr. [U$D/m2]
880.0
995.0
940.0
Investment [U$D/Un.]
69,168.0
78,207.0
73,884.0
Investment [$/Un.]
5,083,848.0
5,748,214.5
5,430,474.0
Tech. Inv. [$/Un.]
0.0
664,366.5
346,626.0
Amortization [years]
45.3
18.2
Table 2. Comparison of the energy costs versus the economic costs of the retrofit and ex ante variants, regarding the “existing” variant.Source: Preparation by the authors. Currency references USD1.00/$73.5 to 01/07/2020, Bank of the Nation – Argentina.
The IPE are obtained from the simulation of the proposed variants, by variant, and the values outlined in the label as per IRAM 11900:v2017, in categories (Figure 6). The “existing” variable with 132 kWh Prim. /m 2 .year, is located in an average position, corresponding to category D, and ends up being 53% more efficient than the “conventional” variant, with 281 kWh/m 2 .year (Category G). The improvements incorporated to the “existing” variant, lead to an increase in EE, reaching an IPE in the retrofit variant of kWh Prim. /m 2 .year and 49 kWh Prim. /m 2 .year in the ex ante variant, both categorized “B” in the EE scale.
ECONOMIC IMPACT
Figure 7 shows a general evaluation of the construction cost [U$D/m 2 ] regarding the energy benefit as per the variants analyzed, considering the heating, cooling, sanitary hot water and lighting items in [kWh Prim ./m 2 .year]. On applying improvements, the retrofit and ex ante variants end up being, 48% and 63% more efficient, respectively, than the “existing” variant. The insulation strategies of the envelope and change of openings turn out to be effective. To lower their IPE, renewable technologies must be implemented.
The cost analysis [U$D/m 2 ], regarding the energy benefit [kWh Prim ./m 2 .year], indicates that the retrofit variant represents increases of 16% over the “existing” variant. The ex ante variant ends up being economically and energetically more suitable on meaning increasing of 6.8%, over the “existing”, requiring just 49 kWh Prim. / m 2 .year (Figure 7). As a summary, Table 2 presents performance values (IPE) and annual energy costs for each variant (Ref. 2,915 $/ kWh, T1-R3, residential up to 400 kWh, EDENOR) and their relation with the construction costs [U$D/Unit]. These are shown in Figure 7. In order to estimate an amortization period of the investment, the investment costs in technology [$/Un.] are computed to local values, regarding the potential annual savings by variant [kWh/year]. This makes it possible to determine that, on following the retrofit variant, the amortization period will be 45.3 years and on opting for the ex ante variant, it will be 18.2 years.
It must be clarified that this analysis does not contain the affectation that the energy price would experience over time, calculated by Marinozzi (2020) based on an annual monomial price increase factor of 0.672. In this way, it is difficult to confirm a hypothesis of the energy price evolution in the future and, therefore, amortization estimations are unstable.
ASSOCIATED ENVIRONMENTAL IMPACT
The associated environmental impact is directly proportional to energy consumption and will depend on the energy vector involved (see point 3.2). According to the national greenhouse gas inventory (Environment and Sustainable Development – MAyDS, 2017), the residential sector impacts come in 5 th place, after farming, transport, forestry, and electricity generation, with 28.41 MtCO2eq/ year, which represents 7.7%, without considering the impact of wastewater and solid urban waste (3.8%). Regarding energy consumption, the environmental impact of the Argentine energy mix, by 2018, is 412 gCO2eq/ kWh. From the variants, the “existing” option emits 54 kgCO2eq/year. On considering that the impact of 1700 dwellings in the Papa Francisco Neighborhood over 80 years (service life) could be 0.007 MtCO2eq, reducing the impact associated to the consumption of resources constitutes a fundamental task for the sustainable and inclusive development in the integration of the neighborhoods in an energy transition plan.
CONCLUSIONS
The planned energy resource distribution turns into a leitmotiv when it comes to guaranteeing accessibility and equality in the use of the energy service, which, without a doubt, is the motor of a forced energy transition.
The possibility of referencing admissible energy demand values by surface area and year in the comparison, as well as making the energy, economic and environmental benefits visible, translated into an energy EE label (IRAM 11900, 2017), contribute to the awareness process of an evolving population. The standard represents a change of paradigm for sustainable construction.
Law 13,903 (2017) of Santa Fe promotes its drive so that properties classified with the “A” category receive a 30% bonus of the urban property tax. It is expected that a dwelling which reaches an Energy Efficiency Class – CEE label, is registered in the deed of ownership and is transferred to the General Property Registry to provide value to the unit and motivation to owners and tenants.
The rulings made in the project’s conception are the most determining factors and the ones that offer a better balance in the cost-benefit relationship. As the project process and construction move forward, possibilities to seriously modify it start closing. The Energy Performance Index (IPE), as a reference for the comparison with reference values, is a key tool at the time of planning properties from zero.
The Papa Francisco Neighborhood unit responds to better sustainability criteria regarding a widespread conventional variant, although the evaluation of the benefits had started in its initial phase, we would be witnessing a construction solution that is 63% more efficient, with an associated impact to the lower half and just 6.8% more costly, leaving a key impression on the planning of the built environment.
ACKNOWLEDGMENTS
We would like to thank the Architects, Eliana Ghia and Natalia Felder for their participation. They allowed concluding the analysis of the data and the energy evaluations. We also thank the Coordinator of the Buenos Aires City Housing Institute for contributing with information for the results discussion. We would also like to thank the National Council of Scientific and Technical Research of Argentina for their financing, and the Double Dependence Institutes, IRPHa-UNSJ-CONICET and CEUR-CONICET, for allowing us to work in their premises.
BIBLIOGRAPHICAL REFERENCES
Alonso Frank, A. & Kuchen, E. (2017). Validación de la herramienta metodológica de Alonso Frank & Kuchen para determinar el indicador de nivel de eficiencia energética del usuario de un edificio residencial en altura, en San Juan–Argentina. Revista Hábitat Sustentable, 7(1), 6-13.
Brent, A. C. & Petrick, W. (2007). Environmental impact assessment during project execution phases: towards a stage-gate project management model for the raw materials processing industry of the energy sector. Impact Assessment and Project Appraisal, 25(2), 111-122. https://doi.org/10.3152/146155107X205832 Chevez, P. (2017). Construcción de escenarios urbano-energéticos a partir de la implementación de estrategias de eficiencia energética y energías renovables en el sector residencial. Tesis doctoral. Universidad Nacional de Salta. Facultad de Ciencias Exactas Doctorado en Ciencias - Área Energías Renovables. Etiquetado de Viviendas (2020). Aplicativo Informático Nacional 2020. Retrieved from http://etiquetadoviviendas.energia.gob.ar/
Evans, J. M., De Schiller, S. & Kozak, D. (2015) – Auditorías de comportamiento térmico y eficiencia energética en edificios con acondicionamiento natural. In: S. de Schiller & J.M. Evans (Eds.), Eficiencia Energética en el Hábitat Construido (pp. 191-202). Buenos Aires: CIHE-FADU-UBA.
Fernández, R. (coord.). (2019). Transición Energética 2050. Hacia una visión compartida de la transición energética argentina al 2050: propuesta de objetivos y metas. (Edición: J. Dumas y D. Ryan). Buenos Aires: Centro de Estudios de la Actividad Regulatoria Energética (UBA), Instituto Tecnológico de Buenos Aires (ITBA), Fundación AVINA, Programa de las Naciones Unidas para el Desarrollo, Secretaría de Gobierno de Energía. Instituto de Vivienda de la Ciudad (IVC). (2016). Integración de los barrios. Retrieved from https://vivienda.buenosaires.gob.ar/#top
IRAM 11549 (2002). Instituto Argentino de Normalización y Certificación. Aislamiento Térmico en Edificios- Vocabulario. Buenos Aires, Argentina. IRAM 11601 (2002). Instituto Argentino de Normalización y Certificación. Aislamiento Térmico de Edificios: Métodos de Cálculo. Buenos Aires, Argentina. IRAM 11603 (2012). Instituto Argentino de Normalización y Certificación. Acondicionamiento térmico en Edificios: Clasificación Bioambiental de la República. Buenos Aires, Argentina.
IRAM 11900 (2017). Instituto Argentino de Normalización y Certificación. Prestaciones energéticas en viviendas. Método de cálculo y etiquetado de eficiencia energética. Buenos Aires, Argentina.
Kozak, D., Evans, J., Adamo, G., Abálsamo, D. & Romanello, L. (2017). Sustentabilidad en viviendas de escala intermedia en Buenos Aires. Revista Summa, 155, 102-110.
Kuchen, E., Plesser, S. & Fisch, M.N. (2012). Eficiencia energética y confort en edificios de oficina. El caso alemán. Revista Internacional Hábitat Sustentable, 2(2), 34-44.
Ley N° 13.059 (2003). Poder Legislativo de la Provincia de Buenos Aires. Acondicionamiento térmico de edificios de la Provincia de Buenos Aires. Cámara empresaria de desarrolladores urbanos de la República Argentina. Buenos Aires, 9 de abril de 2003. Ley N° 13.903 (2017). Poder Legislativo de la Provincia de Santa Fe. Etiquetado de eficiencia energética de inmuebles destinados a vivienda. Cámara de Diputados de la Provincia de Santa Fe, 1 de octubre de 2017.
Li, F., Trutnevyte, E. y& Strachan, N. (2015). A review of sociotechnical energy transition (STET) models”. Technological Forecasting and Social Change, 100, 290-305. https://doi. org/10.1016/j.techfore.2015.07.017
Marinozzi, E. (2020). Informe Mensual CAMMESA. Principales Variables del Mes. Gerencia Análisis y Control Global. Mayo 2020. Retrieved from https://portalweb.cammesa.com/default.aspx
Riavitz, L., Zambon, H. & Giuliani, A. (2015). La matriz energética argentina y la restricción externa. Cuadernos de Investigación. Serie Economía, (5), 110-141.
Risuelo, F. (2010). Certificados de eficiencia energética en edificios. Resumen ejecutivo. Buenos Aires: FODECO. Secretaría de Energía de la Nación (SEN). (2020) Eficiencia Energética: Programas. SEN 2020. Recuperado de https://www. argentina.gob.ar/produccion/energia
Secretaría de Medio Ambiente y Desarrollo Sustentable (MAyDS) (2017). Inventario de Gases de Efecto Invernadero de Argentina. Retrieved from https://www.argentina.gob.ar/sites/default/files/ inventario-nacional-gei-argentina.pdf