33 minute read
SUSTAINABLE HOUSING: A DISCUSSION ON THE EFFICIENT MANAGEMENT OF WATER USE IN DOMESTIC INSTALLATIONS. CASE STUDY: SANTA FE –ARGENTINA

Vivienda sustentable: Una discusión sobre el manejo eficiente del uso agua en instalaciones domiciliarias. Caso de estudio: Santa Fe –Argentina Rodolfo Bellot, Diego Fiscarelli
Revista Hábitat Sustentable Vol. 10, N°. 1. ISSN 0719 - 0700 / Págs. 68 - 81 https://doi.org/10.22320/07190700.2020.10.01.06
Advertisement
HS
69

Recibido 12/03/2020 Aceptado 20/07/2020
VIVIENDA SUSTENTABLE: UNA DISCUSIÓN SOBRE EL MANEJO EFICIENTE DEL USO AGUA EN INSTALACIONES DOMICILIARIAS. CASO DE ESTUDIO: SANTA FE –ARGENTINA
SUSTAINABLE HOUSING: A DISCUSSION ON THE EFFICIENT MANAGEMENT OF WATER USE IN DOMESTIC INSTALLATIONS. CASE STUDY: SANTA FE –ARGENTINA
RODOLFO BELLOT Arquitecto Docente e Investigador, Profesor Titular, Facultad de Arquitectura, Diseño y Urbanismo Universidad Nacional del Litoral Santa Fe Argentina https://orcid.org/0000-0003-1929-7820 rjbellot@fadu.unl.edu.ar
DIEGO FISCARELLI Doctor en Arquitectura Docente e investigador, Becario Posdoctoral-CONICET, Facultad de Arquitectura y Urbanismo Universidad Nacional de La Plata La Plata, Argentina https://orcid.org/0000-0002-7087-0816 dfiscarelli@fau.unlp.edu.ar
RESUMEN Este trabajo busca exponer una reflexión crítica sobre la eficiencia en el manejo del recurso agua, en el marco del caso de estudio –Ciudad de Santa Fe, Santa Fe (Argentina). Ponderando el rol de las instalaciones sanitarias en la optimización del uso del agua como recurso fundamental, se propone, en términos metodológicos, un análisis en base a tres dimensiones: el sistema hídrico de la ciudad, la normativa vigente en materia de regulación de excedentes y el suministro de agua por red. Se recuperan las propias investigaciones precedentes para mensurar el consumo domiciliario típico, atendiendo a dos variables: uso racional del agua y consideración de tecnologías al servicio de la eficiencia. Como síntesis, se elaboran curvas de abatimiento para caracterizar la eficiencia en tres escenarios. Y, en el terreno de la discusión, se interpelan las responsabilidades de los usuarios y la praxis de los profesionales de la arquitectura, encargados de concebir la sustentabilidad de la vivienda urbana santafesina.
Palabras clave vivienda, sustentabilidad, eficiencia, agua, curva de abatimiento.
ABSTRACT This work aims to present a critical reflection about the efficiency of water resource management in the case study - City of Santa Fe, Santa Fe (Argentina). Analyzing the role of sanitary installations in optimizing water use as an essential resource. In methodological terms, a three-dimensional analysis is proposed: the city’s water system, the current regulations for surplus management and the water network supply. The author’s prior research projects are recovered to measure typical household consumption, considering two variables: rational water use and consideration of service efficiency technologies.In summary, abatement curves are made to characterize the efficiency in three scenarios. As a discussion, the responsibilities of users, and the praxis of architecture professionals, responsible for conceiving the sustainability of urban housing in Santa Fe, are questioned
Keywords housing; sustainability; efficiency; water; abatement curve.
HS
70
INTRODUCTION
Architecture, throughout history, has looked to conceive an efficiently conditioned habitat, both regarding the safety and a location to perform activities. However, it was in the last century when these concerns reached an exponential importance. As a result, the design/ technology and project/installations dialectic pairs consolidated a scientific-technological enthusiasm, looking towards reducing emissions, sustainable design and improving efficiency conditions of the habitat.
The “new system” 1 , characterized by the depleting of energy resources due to the fossil fuel crisis in the 1970s, along with climate change which results from high emissions levels, forced architecture to reflect about project related practices. As Fernández Rojas states (cit. In Delucchi 2016, p. 23) “more responsible measures regarding the abuse and wastage that the representation of the spectacular in architecture has had, over simple and sustainable application criteria”, have become necessary.
Considering this scenario, this work proposes studying water as a limited resource 2 in the city of Santa Fe, Argentina. It sets out as a goal, an analysis that leads towards reflecting about the role of household installations as a project-related resource, oriented to taking advantage of water, and consequently, adapting the dwelling to the environment.
Therefore, the discussion involves professionals, but also users, who with their habits and decisions affect the performance of the resource (Alonso-Frank & Kuchen, 2017). Although background information that describes similar research lines by different authors is acknowledged, this work intends on providing an innovative perspective on studying the case of the city of Santa Fe, in the framework of the recent water regulation standard. In this sense, the essential contribution is based upon a critical revision of the instrumental case regarding the scope of the regulatory framework, even though the methodological nature of previous analyses is used.
In terms of architectonic characteristics, it must be stated that although this article outlines using regular
rainfall devices as a core variable, given the current regulation, in order to make a comparative study, the design and construction resolution criteria of buildings directly affect water efficiency. Using this study as a starting point, it is confirmed that the planning of the size and slope of roofs, just like the handling of the absorbance capacity in the cases that include green surfaces, consolidate guidelines to optimize water reuse, compared with those cases that only propose its evacuation.
METHODOLOGY
From the methodological point of view, this work, to reach the final discussion, considers two phases, which are outlined below:
Phase 1: Multidimensional analysis of the case study: City of Santa Fe.
Dimension 1: The drainage basin that endangers the city is characterized, with the goal of weighing the interrelationship between the geographical features of the area and the particular rainfall and water systems. Likewise, the origin of the rainfall control devices is described in the framework of different decisions, which have sought to cover the specificities of the region in terms of its natural conditions.
Dimension 2: The current regulation is characterized considering excess rainfall control.
Dimension 3: The network water supply is quantified in depth, retrieving data from the research of LATEC/ FAU/LATMAT/FADU and the FADU-UNL Installations lectures.
Phase 2. Analysis of case study (3 dimensions), starting from the following three scenarios:
1. User efficiency and change in consumption habits (Alonso-Frank & Kuchen, 2017)
2. Change in technology without using harvested rainwater.
3. Change in technology using harvested rainwater.
1 “New climate system” is a term coined by Bruno Latour. In his latest book (2017), he uses this concept by alluding to the end of the Holocene and beginning of the Anthropocene.
2 According to the water company, Aguas Santafesinas S.A., the amount of energy needed, pumping, transportation, treatment and distribution, to obtain 1 cubic meter of water that is suitable for human consumption from a river source, ranges between 0.35 and 0.40 kW/h/m3. In this way, even though this work acknowledges the interrelationship between the water and energy resources in the context of household supply, this aspect is intentionally omitted in the analysis of efficiency of water management as an essential resource.
HS
71

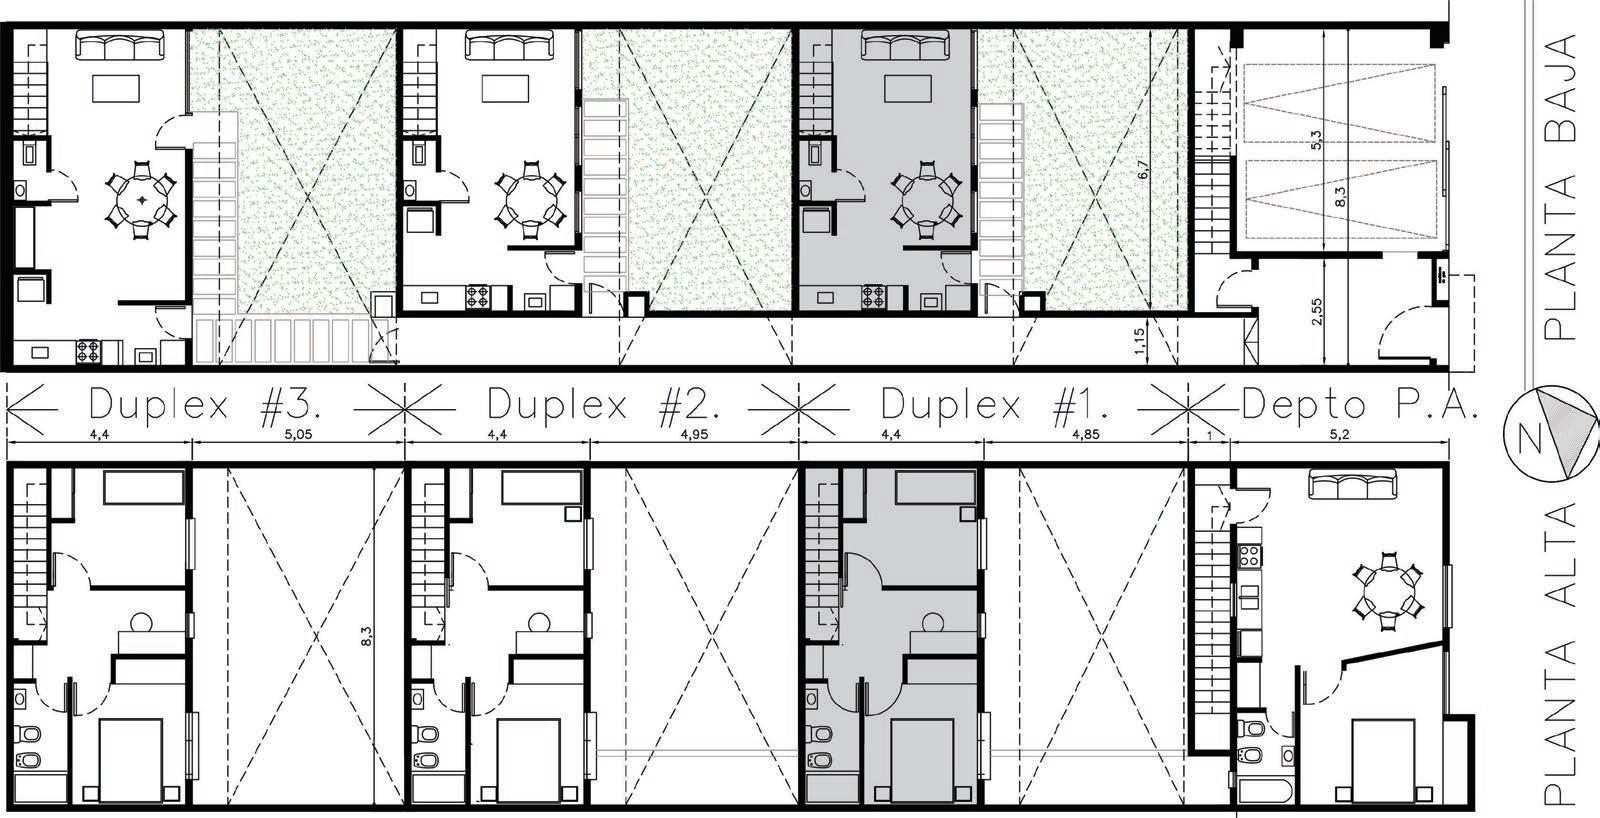
Figure 1. Typologies for the analysis. Source: Preparation by the authors.

Figure 2. Aerial photo of the Greater Santa Fe metropolitan area. Source: Preparation by the authors based on Google Earth.
While making the second phase of the analysis, three possible housing typologies are considered with traditional sanitary installations, to service an average of four inhabitants 3 , namely: a bathroom, a kitchen, a laundry and a service tap for a small or medium-sized yard (Figure 1). The typologies are:
a. Dwelling with one floor or on the ground floor. b. Dwelling with two floors or top floors. c. Dwelling in multi-family or high-rise building.
To prepare a summary of each efficiency scenario, the concept of “abatement” is returned to (Clerc, Díaz & Campos, 2013), where costs are understood as benefits received on replacing technology or traditional use for an alternative one. In this way, a curve can be prepared, as a graphical representation of abated costs from a menu of options, along with their reduction percentages.
ANALYSIS
The city of Santa Fe lies at the meeting and floodplain of two rivers: Paraná and Salado. Its physical limits are mainly fluvial, and 70% of its territory is formed by wetlands (lagoons, rivers, and swamps).
According to Sánchez & Sánchez (2004), the sustained increase in demand for water resources is limited, manifesting the need to seek more efficient ways to use them, as well as considering measures that moderate its use in processes or activities.
Santa Fe is also located in the drainage basin of the Paraná River, area that features constant cyclical hydroclimatic events, mainly in summer and fall, like abundant rains, rivers swelling and breaking their
3 The report “Santa Fe, how are we doing” (2019) determines that the average number of members in the census, is four people per dwelling.
HS
72
banks. The location of this basin, technically named “Middle Paraná”, is affected by all the phenomena that occur in the higher parts of Bolivia, Brazil, and Paraguay (Figure 2).
The Paraná River defines the Eastern side, while the Salado River, the Western, and despite its particular aspects, its floodplain comes into contact with the southern edge of the city, a situation that magnifies the vulnerability of the territory. Thus, and returning to Paoli and Schreider (2000), the Paraná River 4 is, without a doubt, the most important one of the “River Plate” basin, on having a basin surface area of 1,510,000 km 2 and an extension of approximately 2,570 km.
The geographical characteristics of the city have had historic consequences. Since 1905, swollen rivers and floods 5 have been recorded on countless occasions, but it was in 2003 and 2007 when the city went through two significant phenomena that merited the formulation of a Master Plan 6 . Structural actions were drawn up in this: consolidation of defenses, construction of new operation points for the city’s water extraction, formation of reservoirs to accumulate rainwater and a complex system of drains. Alongside this, legal regulations were implemented for waste treatment that affect sewage, the creation of greenbelts 7 , a new soil impermeabilization factor (FIS, in Spanish), modifications to the urban organization regulation – ROU – and surplus rainfall control systems.
It is also necessary to characterize, on one hand, the water system of the rivers and, on the other, the rainfall.
With regard to the former, the entire Middle Paraná system swells due to inflow from higher areas: “[…]

Figure 3. Monthly rainfall in Santa Fe, Sauco Viejo station. Source: National Meteorological Service, 2019.
the origin of the inflow indicates that rains produced in the tributary basins of the High Paraná, Iguazu River and Paraguay River, are the direct causes of overflows in middle or lower sections, with the inflow of these sections having a low impact” (Paoli and Schneider, 2000, p. 72). According to the authors, the Paraná River, at the height of the Province of Corrientes, Argentina, has an annual modulus of 17,000 m 3 /s, receiving inflow from the High Paraná and Paraguay, and in the entire middle section, it incorporates some 1,000 m³/s.
As for the rainfall system, due to the lack of rain in winter and excess in summer, it has an annual average of between 1,000 mm and 1,200 mm (Figure 3). According to the National Meteorological Service (SMN, in Spanish), these are not that far from those mentioned for the entire Basin: with 1,019.80 mm a year and maximum extremes of up to almost 200 mm
daily recorded in the month of March 2017.
4 The Paraná basin includes areas of Brazil, Argentina, Paraguay, and Bolivia, covering a surface area of 2.6 million km2 (84% of the fluvial system of the River Plate). It integrates the Brazilian continental platform and the eastern basin of an Andean sector along its route through Brazil, Bolivia, Paraguay, and Argentina. The system comprises three hydrographic areas: the Paraguay, Upper Paraná, Middle Paraná, and Lower Paraná Rivers (Bello, Ballesteros, Buitrago, González & Velasco, 2018).
5 Floods due to the swelling of the Paraná River: 1905, 1966, 1982/3, 1992, 1998; from the swelling of the Salado River: 1914, 1973, 2003; due to extraordinary rainfall; 2007 (Santa Fe 2019 Risk Management Report).
6 Uban rainfall storm drain Master Plan formulated in the framework of the 2010 Urban Plan. Government of the City of Santa Fe.
7 Greenbelts refer to a space with grass and/or trees that must be considered when building a sidewalk and set aside for a better rainwater absorption, reducing the surface area built with paving. In the city of Santa Fe, it is obligatory by ordinance and all cases where the sidewalk or curb width is over two meters. See: Ordinance N°11610. Honorable Municipal Council of the City of Santa Fe de la Vera Cruz. 17/9/2009.
HS
73


Figure 4. Hydraulic control device. Source: Left: Santa Fe Water Resources Secretariat. Figure 5. Reservoir designed in the building, SJ-58 Pilay-Capitel, Irigoyen Freyre 2230, Santa Fe. The ground floor yard is, in itself, the reservoir, and covers its entire surface. Source: Photograph by the authors.
DIMENSION 2: SURPLUS CONTROL AND STANDARDS
In December 2012, Ordinance N° 11959 “Surplus rainfall control system” 8 was enacted in the city. The way it proposes contributing to the optimization of the urban system’s operation, consists in the incorporation of hydraulic devices, whose mission would be to control the gradual evacuation of surplus rainfall, delaying the drainage to control its impact on the system. These hydraulic devices must reduce the maximum flow to a minimum of 50%. These comprise two conceptual elements: a “reservoir” and a “regulator”.
Regarding household installations, the system works in the following way: the water runs along impermeable surfaces and roofs to gutters and chutes. It is then transported to downpipes where it encounters a “regulator”, that leads the rainwater through a duct with a reduced exit hole, into the network, and the rest – overflow, through a standard one that redirects it and stores it in a “reservoir”. In this, in the same way, a part is run off to the network through an exit with a regulated hole, and the rest is stored in the cistern. To determine component capacities and
diameters, a simple calculation is made that consists of determining the impermeable surfaces of the building and considering the slopes of roofs. With this information, a delay curve of 50% is considered. Then, using the tables, the reservoir volume is obtained, and the exit hole diameter is defined (Figures 4 and 5).
THE HYDRAULIC REGULATOR AS A REGULATORY INSTRUMENT
To establish accuracy in the regulatory analysis framework, a practical example is proposed: a dwelling with a roof 9 of 100 m² and a storm design with an intensity 10 of 180 mm/h, which means that 18,000 liters of water must be evacuated.
The flow to be evacuated for the example cited, considering the equation of Díaz Dorado (2008), is: 5 l/s.
Q (flow) = (S (sup.) x Imax (rain) x e (friction coeff.))/3600
The following graph shows the rainfall curves of the analyzed area, considering the recurrence, where, with a double entry, the duration is indicated on the
8 Ordinance N°11959, Surplus rainfall control system for Santa Fe de la Vera Cruz, Municipal Council, December 13th 2012.
9 The ordinance demands considering all waterproof surfaces, paving, etc. Only for illustrative purposes, a roof is provided as an example.
10 “Rain intensity” is the ratio of height increase that the rain reaches over time. Its unit of measurement is mm/h.
HS
74
x-axis and the intensity on the y-axis. From this, the information of 180 mm/h is determined for the later calculations (Figure 6).
Apart from considering the flow to be evacuated by a property, it is necessary to specify another parameter: the rainfall pattern. With that, the amount of water that is stored in a cistern could be quantified, complying with norm N° 11959 throughout a given period. Some data is considered to transform it into sources of information as, according to the SMN, as was already mentioned, the rainfall pattern of the city of Santa Fe, is between 1,000 and 1,200 mm a year (Figure 7).
SMN has rigorous data for two periods (1961/1990 and 1981/2010), where it is seen that 1,000 mm to 1,200 mm a year do not fall in a balanced way, with summer months rainier than winter ones. The number of days in each month and each season with rainy days is also reported. Considering this information, by which it is not feasible to accumulate rainwater in a balanced fashion in all months and seasons, it is proposed, for practice purposes, to evaluate the 1,000/1,200 mm a year pattern with a linear average.
As a result, a dwelling with a roof of 100 m 2 that receives 1,000 mm to 1,200 mm of water a year, will gather 120,000 to 144,000 liters yearly. From this, a monthly average of 10,000 to 12,000 liters is calculated.
It remains to be said that, although ordinance N° 11959 considers the storage to attenuate the water impact on the urban system, it does not stipulate its harvesting for use. So, the cistern volumes, to begin with, do not have full capacity to accumulate the amount of rainfall, so it will depend on the seasons, month and days with rain.
DIMENSION 3: WATER SUPPLY AND NETWORK DISTRIBUTION
According to the report, “Santa Fe, how are we doing 2016, 2017 and 2019”, produced by the city government and the Stock Exchange, as well as the official data of the water company, Aguas Santafesinas S.A (ASSA), more than 92% of the city has a drinking water network that comes from the surface intake on the Colastiné River (part of the Paraná River basin). The rest of the population is supplied with water from community or household wells. The daily water consumption per inhabitant in the location is 397.5 liters, while 100 liters per capita is the recommendation of the WHO (Bartam et al., 2009), some four times the stipulated values. This average consumption indicator appears, according to ASSA, from assuming what is produced and distributed among the users. According to what Franco (2019) confirms, the real consumption must be managed with metering systems and not

Figure 6. IDF intensity-duration-frequency curves, 1970-2006 series (Bertoni) II – Regionalization Workshop. Source: FICH-UNL Faculty of Engineering and Water Sciences of the National University of the Littoral.

Figure 7. Annual rainfall for the periods of 1961-1990 and 1981-2010. Source: SMN.
by a production distribution among those served. As Calcagno, Mendiburo and Gaviño (2000) say, the average liters/inhabitant/day in Argentina varies greatly between Provinces, ranging from a maximum of 654l/h/d to a minimum of 168l/h/d.
The uncounted water values constitute one of the main efficiency issues in most drinking water services. It is estimated that between 35% and 40% of the water produced is lost in the networks and in illegal connections. In this sense, Jiménez (1994) proposes a classification for efficient water use based on five groups: leak detection, leak repair, tariffs, user education, and regulations.
According to information from the water company, ASSA (2019), 17,380 meters have been installed, which represents 16% of all the connections. This means that a large part of the users pays using the cadastral tariffing system – through the volume allocation. For this reason, most of the tariffing system in the city, is based on the water volume system assigned
HS
75
through cadaster and is regulated by Provincial Law N° 11220 “Service Supply Tariffing System” 11 . The users connected to the service have a calculation formula which is expressed as follows:
MF =
(CF + P x Q) x FS x TR
MF
Amount to be billed ($/period)
CF
Fixed charge ($/period)
P
Price per m 3 of water ($/m 3 )
Q
Water volume to be billed (m 3 /period – QM
measured, or QA assigned)
FS
Service factor
TR
Fair control and regulation rate (ENRESS)
The tariff revision maintains the Provincial State user subsidy scheme, which will continue to cover part of the expenses the company must face to provide its services, with treasury funds. The state subsidy in Santa Fe is around 30% (ASSA, 2019). Considering the study made by FADU-UNL, in connections with meters installed by ASSA, the average water consumed, QM, is 188l/h/d, a value that is far off the 397.5l/h/d stated by the company.
Considering this, it is possible to state that the values confirm, on one hand, the overallocation of consumption for unmetered systems and the positive difference between the real consumption per person and that stated by the water company, a gap of between 40% and 50%.
EFFICIENCY IN RESOURCE USE
The National Sanitary Works regulation (OSN, in Spanish) sets reserve tank capacity values considering the average daily consumption assigned to a standard location unit that includes: a main bathroom, a service bathroom, a kitchen sink and a laundry sink (Lemme, 1973). The standard unit was considered with a 4-member family. The Domestic Household Installations Regulation 12 established that for the standard unit, it had to have an 850-liter tank, when this was supplied directly – without a pumping tank -. Meanwhile Title II (household water supply), Chapter III, art. 142, paragraphb 1., indicates: “[…] these shall have dimensions proportional to the amount of water they should provide and their useful capacity shall be, at least, equal to the consumption corresponding to twenty-hours of use”. Here is where a stipulated average consumption per person and per day of 212.5 liters of water appears (Table 1 and Figure 8).
Table 1. Household use water consumption considered in liters/ inhabitant/day. Source: FADU-UNL Installations Course (2018).
11 Government of Santa Fe. Provincial Law N° 11220, Transformations of the public drinking water sector, sewers, and sanitation. December 12th, 1994.
12 Decree N° 11877 of the P.E.N. – National Public Works Ministry – National Sanitary Works General Administration – Argentina – 1954 and modifications.
HS
76
In this context, this research uses the household water use identification method proposed by Castillo- Ávalos & Roviera-Pinto (2013), so it formulates a comparative calculation between the potential water volumes that can be saved in a dwelling, using the FADU-UNL Techniques and Materials Laboratory (LATMAT) 13 , to readapt the method and recalculate water consumption values for dwellings in the city of Santa Fe:
ANALYSIS FROM 3 SCENARIOS
Returning to the three dimensions used to build the analysis in the first stage, which characterize the case study in terms of water supply, use and resource management, three scenarios are defined that constitute typical situations to compare, aiming at completing the analysis, obtaining results and provoking the final discussion.
1ST SCENARIO – USER EFFICIENCY LEVEL
The first option, “user efficiency level” (NEU, in Spanish), to use the term of Alonso-Frank & Kuchen (2017), can be included with the following actions: A 10-min shower consumes 100 liters of water, while a 5-min one would consume half. If a glass is used to brush teeth, 0.25 liters of water are used, while leaving the tap open uses between 20 and 30 liters. Shaving, closing the tap, consumes 3 liters, while doing so with the tap open, consumes some 40 liters of water. Keeping yards and gardens green by watering in the afternoon/evening or at sunrise instead of using controlled triggers, allows saving half the water. All this information, taken from the Argentinean Sanitary and Water (2019) (AySA) and LATMAT, FADU-UNL research, show that it is possible to reduce water use by 30%, just by using it rationally and making changes in the users/inhabitants’ habits.
If the item, personal hygiene is considered (Figure 9), responsible for 70% of the water consumption per inhabitant and per day, the possible efficient use in liters for the different appliances involved can be graphed, where it can be seen that there could see a reduction of up to 30% in consumption, without altering comfort levels. In the item, home hygiene (Figure 10), the NEU can reach values of over 20%, for example, by using buckets to clean floors instead of keeping hoses running. Regarding garden upkeep (Figure 11), considering small and medium sized yards, the efficient use is not as significant as the aforementioned options, as it reaches values of up to 10% of the NEU thanks

Figure 8. Uses regarding water consumption. Source: FADU-UNL Installations Course (2018). Source: Lecture on installations, FADU –UNL (2018).


Figure 9-10-11-12 (from left to right and up down). Possible efficiency levels for the different uses. Source: Preparation by the authors based on ASSA, AySA and FADU-UNL Facilities Course database (2018).
13 CAI+D Research (2008) called “Sustainable architecture, experimental development of a habitational module with 0 energy consumption”, under the direction of Professor Alberto Maidana, FADU-UNL.
HS
77
Table 2. Table with collected consumption information (demand) and possible reduction values (abatement) in liters of water, applying user efficiency criterion. Source: Preparation by the authors.
to using dosing triggers or sprinklers. Considering the water consumed (Figure 12) for cooking, drinking and infusions, no NEU is considered.
To make a summary of each efficiency scenario, the concept of “abatement”, proposed by Clerc et al. (2013) is used again, referring to the curve that shows the impact produced when facing consumption, emission and energy use reduction measures, which allow establishing indicators between the different mitigation and saving decisions, in order to plan the efforts associated to this.
From this perspective, the costs are understood as perceived benefits, on replacing a traditional technology or use for an alternative one. Concretely, an abatement curve can be prepared, as a graphical representation of the costs abated from a menu of options, along with their reduction percentages. In this graph, it is possible to see the different choices organized, as well as relevant information to evaluate and compare the effects of different measures. Likewise, the curves find their main source of knowledge in the abatement of CO 2 and GHG emissions but, with illustrative purposes, the concept is used to prepare a representative graph of the possible abatement in liters of water consumed in the items considered above the NEU.
From the 226l/h/d, applying the NEU, an efficiency of up to 26.88% can be achieved, namely some 60.75l/h/d (Figure 13).
2ND SCENARIO – CHANGE IN TECHNOLOGY WITHOUT USING HARVESTED RAINWATER
The second option, changing technologies without including water harvesting, refers to all the possibilities there are where more efficient appliances and installations can be used, without reducing comfort levels or changing basic consumption needs. An example of these would be using selective WC cisterns 14 or valves, instead of traditional cisterns or,

Figure 13: Graph of abatement in liters of water, applying user efficiency criterion. Source: Preparation by the authors.


Figures 14-15-16-17 (from left to right and up down). Bar chart showing the possible efficiency levels for the different uses. Source: Preparation by the authors based on ASSA, AySa and FADU Installations course database
14 “WC cisterns are known as discharge deposits or tanks with mechanical capacity cleared by pressing them, to release all or part of the water, depending on their capacity.
HS
78
Table 3. Table with information of collected consumption (demand) and possible reduction values (abatement) in liters of water, applying bathroom technology change criterion. Source: Preparation by the authors.
Table 4. Cases and uses of harvested rainwater. Source: Preparation by the authors. * needs pumping to the reserve tank, to include harvested rainwater in the cistern ** only possible for use in garden upkeep, cleaning sidewalks and common areas (Ground Floor).
using timer-button activated or automatic taps, instead of traditional ones (Figures 14, 15, 16, 17 and 18).
As an illustration, a comparison of some elements is presented here 15 :
• Top brand WC discharge value: $7,646
• Top brand WC cistern: $6,550
• Top brand 4 th turn, ceramic, bathroom tap: $8,345
• Top brand automatic bathroom tap: $10,320.
From the 226 l/h/d, and applying the “technology changes” efficiency criterion, without considering using the harvested rainwater, an efficiency of up to 30%, i.e., some 67,80 l/h/d in savings, can be achieved.
3RD SCENARIO – CHANGES IN TECHNOLOGY USING HARVESTED RAINWATER
Incorporating the available harvested rainfall into household use, taking advantage of the obligatory nature of its implementation, as per Santa Fe Ordinance N° 11959 “Surplus rainfall regulation”, presents a wide range of possibilities, both in types of use and in cases.
Regarding the building type: unlike the two efficiency scenarios presented ut supra, which do not imply changes of implementation regarding dwelling types, in other words, where it is possible to apply an NEU criterion and

Figures 17 (from left to right and up down). Bar chart showing the possible efficiency levels for the different uses. Source: Preparation by the authors based on ASSA, AySa and FADU Installations course database

Figure 18. Graph of abatement in liters of water, applying bathroom technology change criterion. Source: Preparation by the users.
15 Reference of research that considers elements available in the local market of Santa Fe and top brands, like FV, Ferrum and Roca. Values in Argentinean Pesos to December 2019. Reference Dollar $62.5 (Argentinean Pesos).
HS
79
Table 5. Table with data of collected consumption (demand) and possible reduction values (abatement) in liters of water, applying rainwater use criterion. Source: Preparation by the users.
a change in the technology, both in ground floor dwellings and on top floors and in multi-family apartment buildings, in this third scenario, restrictions appear depending on the type of building: single floor dwellings, two-level dwellings and dwellings in multi-family or high-rise buildings. In the first of these, considering the pressure gauge level available in Santa Fe, there is no need for a pumping tank, but they do need a reserve one, and they may have grid water in the kitchen, for example, for consumption and drinking. In the second, buildings built on two levels, the ground and first floor need a pumping and a reserve tank, but with the possibility of direct service consumption. Meanwhile, the third requires a pumping and reserve tank, without the possibility of direct services.
Regarding the use: the uses, in terms of taking advantage of harvested rainwater, are characterized into two groups: the first, simple use, i.e., only use from the cistern; and second, complex use, i.e., incorporation of the water collected in the sanitary hydraulic circuit, with the exception of for drinking and consumption. This last one is considered as significant, since an efficiency value can only be achieved in that situation. In fact, if the accumulated water is used, without incorporating it into the hydraulic circuit, only with the extraction of the cistern at the same level, through a tap, its use is limited to cleaning floors, sidewalks and garden upkeep, all consumptions that do not directly impact the main part of the daily average.
The different possibilities considering the three dwelling cases can be summarized in the following table (Table 4)
Pursuant to what has been seen, the accumulated rainwater cannot be significantly used in high-rise buildings, where its use, in the framework of what is set out in the current regulations, Ord. 11595, is restricted to solely small actions: cleaning common spaces, watering green areas, among others. Therefore, we will limit considerations to single-floor and two-floor dwellings (Figures 19, 20, 21, 22 and 23). If we consider a hypothetical and ideal situation, where there were no limitations in the amount of rainfall or in the storage capacity, these could abate, in the sense of replacing the grid service consumption with rainwater, as follows:
In the personal hygiene graph, 100% can be abated, that is, 160l/h/d of water consumption. In the home hygiene graph, it is possible to abate 58%, that is 26.25l/h/d.


Figures 19-20-21-22: Abated percentages in liters of water for each use level, personal hygiene, home hygiene, garden upkeep and consumption and drink. Source: Preparation by the authors

Figure 23. Graph of abatement summary in liters of water, applying rainwater use criterion. Source: Preparation by the authors.
HS
80
Table 6. Table with monthly consumption data (demand) and possible reduction values (abatement) in liters of water, which considers the annual average rainfall in Santa Fe and the storage capacity of cisterns, as per Ordinance N° 11595, and for the case study used. Source: Preparation by the authors.
Washing up here is considered in the kitchen sink and, as will be explained, it constitutes a network water supplied consumption. In the garden upkeep graph, 100% can be abated: 18l/h/d. Finally, in the water consumption graph, abatement is not possible, as the consumption for drinking and cooking is assumed by default as through the grid, which guarantees the technical suitability (Figure 24). This ideal situation, in the city, has a limitation in both the amount of rainfall and in reserve. To replace this ideal scenario for a real one, it is proposed to refer to the aforementioned example, where “a dwelling with a 100m 2 roof” that receives 1,000 mm to 1,200 mm of water a year, will collect 120,000 lts to 144,000 lts a year. The resulting amount has a monthly average of 10,000 to 12,000 liters. If 226 l/h/d are needed for an average home, 27,120 liters of water are required monthly, in other words, by simplifying each item to a linear abatement function, 44% water use could be achieved. If to this, the fact that Ord. N° 11595 establishes design volumes that, for this standard dwelling with four inhabitants and 100 m 2 of impermeable surfaces, 6,000 liters of harvesting a month are reached, and the
possible abatement would be around 22%.
RESULTS AND DISCUSSION
Regarding the results of the study, and in the framework of the three scenarios addressed by the analysis, the following considerations are suggested.
In the first scenario, with a suitable User Efficiency Level (NEU), efficiency values of up to 27% are achieved, which clearly state the importance of the inhabitants regarding the use and the need to inform, train and broadcast the virtues of a rational use of water. In the second scenario, using technologies available in the local market with efficiency criteria and without greater costs, allows abating up to 30%, which indicates, among other aspects, the relevance of the criteria, the responsibility and knowledge of professionals on making projects and carrying out works. The third scenario permits abatements of between 22% and 44%, which implies a commitment of the professional and the user, not just in complying with an ordinance, but with the environment and the resources. From this, it is seen that the rainwater harvesting, apt for different uses, can represent a significant contribution regarding the water consumed from the network, reaching reduction values of around 40%.

Figure 24. Graph of abatement in liters of water, which applies rainwater use criterion, considering annual average and storage capacity for the example outlined. Source: Preparation by the authors.
On the other hand, through the description of the city’s water system, or the way network water is consumed and the current legal regulations for surplus rainfall control, it can be inferred that the rainwater accumulation system is effective, in the sense that it fulfills a purpose. However, thinking that it is intended to achieve the essential, using what is available, this is not efficient regarding the use of resources.
CONCLUSIONS
As it has been presented, although the decision to accumulate the surplus and its then gradual later elimination complies with the current legislation, it does not promote margins of efficiency: even when uses overlap, the harvested water does not contribute to reducing network supply consumption. Alongside this, the recent regulation establishes values associated to the morphological aspects of buildings; however, they are presented solely for the purpose of guiding the corresponding calculations: slopes, run-off surfaces, size of downpipes, etc. In fact, there are still no express guidelines which, in design terms, allow optimizing the reuse of water resources, without detriment of its service quality and to satisfy the analyzed demand minimums.
Finally, it is worth stating that the result of the study, without questioning the regulation in the framework of the urban system, tries to provide a reflection about those decisions of the project praxis which, in the framework of infrastructure construction to optimize water consumption in Santa Fe, do not promote efficiency as an added value and, therefore, discourage the conception of the dwelling as a sustainable habitat.
HS
81
REFERENCIAS BIBLIOGRÁFICAS
Alonso-Frank, A., Kuchen, E. (2017). Validación de la herramienta metodológica de Alonso-Frank & Kuchen para determinar el indicador de nivel de eficiencia energética del usuario de un edificio residencial en altura, en San Juan, Argentina. Revista Hábitat Sustentable. Volumen 7 (1), pp. 6-13.
Bartram, J., Corrales, L., Davison, A., Deere, D., Drury, D., Gordon, B., Howard, G., y Stevens, M. (2009). Manual para el desarrollo de planes de seguridad del agua: metodología pormenorizada de gestión de riesgos para proveedores de agua de consumo. Ginebra: Organización Mundial de la Salud.
Bello, O., Ballesteros, J., Buitrago, M., González, M. y Velasco, O. (2018). Análisis retrospectivo de las inundaciones: lecciones y recomendaciones. Buenos Aires: CEPAL - ONU.
Calcagno, A., Mendiburo, N., Gaviño Novillo, J.M. (2000). Informe sobre la gestión del agua en Argentina. Buenos Aires: Ed. Global Water Partnership.
Castillo-Ávalos, Y. y Rovira-Pinto, A. (2013). Eficiencia hídrica en la vivienda. Revista Tecnología y ciencias del agua. Volumen 4 (4), pp.159-171.
Cátedra de Instalaciones I, II y III (2018). Cuadernillo bibliográfico de Instalaciones [Apuntes]. Taller Vertical Bellot. FADU. UNL.
Clerc, J., Díaz, M. y Campos, B. (2013). Desarrollo de una metodología para la construcción de curvas de abatimiento de emisiones de GEI incorporando la incertidumbre asociada a las principales variables de mitigación. Banco Interamericano de Desarrollo.
Delucchi, A. (2016). Acerca del proyecto en arquitectura. Entre la reconstrucción y la invención. Buenos Aires: Ed. Diseño.
Díaz Dorado, M.D. (2008). Instalaciones sanitarias y contra incendios en edificios. Buenos Aires: Ed. Alsina.
Franco, F. (2019). Cuadernillo del Laboratorio de Hidráulica. [Apuntes] Facultad de Ingeniería en Ciencias Hídricas (FICH). Universidad Nacional del Litoral.
Jiménez, A. (1994). Capítulo 1. En H. Garduño y F. Arreguín (Eds.), Uso eficiente del agua (pp. 6-26). Montevideo: UNESCO-ORCYT.
Latour, B. (2017). Cara a cara con el planeta. Una nueva mirada sobre el cambio climático alejada de las posiciones apocalípticas. Buenos Aires: Siglo Veintiuno Editores.
Lemme, J. C. (1973). Instalaciones aplicadas en los edificios. Buenos Aires: Luis y Félix Fossati SRL.
Paoli, C. y Schreider, M. (Eds.). (2000). El Río Paraná en su tramo medio. (Vol. 1). Santa Fe: Centro de Publicaciones UNL.
Sánchez, L.D. y Sánchez A. (2004). Uso eficiente del agua. Ponencias sobre una perspectiva general temática (TOP). Instituto de Investigación y Desarrollo en Agua Potable, Saneamiento Básico y Conservación del Recurso Hídrico (CINARA). International Water and Sanitation Centre (IRC).