22 minute read
THE GEOTHERMAL COOLING POTENTIAL FOR BUILDINGS IN ARID ZONES

Recibido 14/08/2019 Aceptado 12/11/2019
Advertisement
MARIO CÚNSULO Igneniero Civil, Docente adjunto e Investigador Universidad Nacional de San Juan - Instituto de Estudios en Arquitectura Ambiental INEAA -Consejo Nacional de Investigaciones Científicas y Técnicas (CONICET) https://orcid.org/0000-0001-7981-6683 mcunsulo@unsj.edu.ar
SANTIAGO TOSETTI Doctor en Ingeniería Investigador Instituto de Automática (INAUT) Consejo Nacional de Investigaciones Científicas y Técnicas (CONICET) - Universidad Nacional de San Juan Argentina https://orcid.org/0000-0001-9255-5422 stosetti@gmail.com ALEJANDRA KURBÁN Doctora en Arquitectura y Urbanismo Docente titular Facultad de Arquitectura Universidad Nacional de San Juan - Consejo Nacional de Investigaciones Científicas y Técnicas (CONICET) https://orcid.org/0000-0002-8795-1129 akurban@unsj.edu.ar
EDUARDO MONTILLA Arquitecto Docente Titular Facultad de Arquitectura Urbanismo y Diseño Universidad Nacional de San Juan, San Juan, Argentina https://orcid.org/0000-0001-7814-5734 alejo_montilla@yahoo.com.ar
RESUMEN En el presente artículo se analiza cuantitativamente el potencial geotérmico para ser usado como sistema pasivo de refrescamiento edilicio en un ambiente árido urbano, tomando como caso de estudio el Área Metropolitana de San Juan (República Argentina). Se utiliza como insumo la base de datos climáticos y meteorológicos correspondiente a la estación verano, obtenida en el Complejo Universitario Islas Malvinas (CUIM) de la Universidad Nacional de San Juan, lugar donde el Instituto de Estudios en Arquitectura Ambiental “Arq. Alberto Papparelli” (INEAA) registra: temperatura del suelo, a distintas profundidades, y parámetros meteorológicos ambientales. Los resultados están relacionados con la identificación de gradientes y profundidades óptimas para el aprovechamiento del recurso como Sistema Pasivo de Refrescamiento Geotérmico, a fin de proveer condiciones de confort higrotérmico en zonas urbanas áridas durante el verano. En promedio, se obtiene una diferencia máxima de 8,7ºC entre la temperatura del aire y la de la tierra, a una profundidad de 3m. La longitud de los conductos enterrados necesaria resulta de 64m para una velocidad del aire de 3m/s, la cual se reduce a 27m para una velocidad de aire de 2m/s.
Palabras clave arquitectura bioclimática, sistemas pasivos, ahorro energético.
ABSTRACT In this article geothermal potential is quantitatively studied to be used as a passive building cooling system in an arid urban environment. The San Juan Metropolitan Area, Argentina is taken as a case study. A climate and weather database for the summer season was used as input. It was generated at the National University of San Juan’s Islas Malvinas University Complex (CUIM), where the Arq. Alberto Papparelli Institute for Studies in Environmental Architecture (INEAA) records data on soil temperature at different depths and meteorological parameters in the environment. The results identify gradients and optimal depths to use this resource as a passive geothermal cooling system in order to provide hygrothermal comfort in arid urban zones during the summer. There was an average maximum difference of 8.7 °C between the air temperature and the ground temperature at a depth of 3m. The required length of the buried tubes is 64m for an air speed of 3 m/sec, which decreases to 27m for an air speed of 2m/s.
Keywords bioclimatic architecture, passive systems, energy savings
INTRODUCTION
Passive thermal conditioning systems for homes are presented as a valid alternative to achieve hygrothermal comfort, particularly for those who cannot access the use of systems that employ conventional energy, due to their high cost. The energy savings that would be obtained with the implementation of the concept of sustainable architecture specifically in the planning and execution of social housing would produce a great impact on the demand of the local energy matrix, since this energy saving could be used in production activities. At the same time, through this perspective, a reduction of dangerous CO 2 emissions into the atmosphere is achieved (Kurbán, Cúnsulo, Álvarez, Montilla and Ortega, 2015).
The province of San Juan is located in the center-west of the Argentine Republic (south latitude 31º 32’; west longitude 69º 31’), in the arid South American diagonal. The San Juan Metropolitan Area (AMSJ), located to the southwest of the province, presents an arid urban climate (Thornthwaite index = 0.0794) and continental (Gorczynsky [K] = 34.12). It has high thermal amplitudes, both daily and seasonal and annual (17.3ºC), low humidity levels (annual average = 40.92%), summer regime of low rainfall (annual = 77.72mm), high solar radiation throughout the year (490W/m 2 ), as a result of an increasingly reduced cloudiness, and a water deficit of 979.28mm. Throughout the year, the most frequent wind is from the southern sector (average 7km/h), with intense gusts associated with dust storms, sometimes due to a change in weather. In fact, before the weather changes, a local wind called “zonda” usually appears, which constitutes a föhen effect, characterized by very dehydrated and torrid air that can last from a few hours to several days (Kurbán et al., 2015).
In summary, the study area has resources that can be used to provide hygrothermal comfort responses to the population, while at the same time it involves a highly sustainable strategy by directly influencing energy savings and, with it, reducing environmental pollution (Kurbán et al., 2015; Cabezas, 2013). Whenever building thermal conditioning systems are designed it is very important that their efficiency is validated through simulation programs in order to assess the relevance of their application (Flores Larsen and Lesino, 2001).
The basic design inputs of most passive systems are records of temperature, solar radiation, relative humidity and winds; usually difficult to get for urban areas. Hence the importance of the urban meteorological data bank obtained at the INEAA, with 20 years of continuous records, which allows studies with accurate and reliable data.
The use of passive and/or hybrid systems to condition the air entering the buildings has gained increasing acceptance in recent years due to economic savings achieved in energy requirements necessary for thermal conditioning (Flores Larsen, Hernández, Lesino and Salvo, 2001; Bansal, Misra, Agrawal and Mathur, 2010).
The same does not happen when the passive system is geothermal cooling. In San Juan, prior to the completion of the project that gave rise to this article, there were no records of temperature or soil moisture with geothermal passive use objectives. To perform some kind of resource estimation, data extracted from other regions with climatic and edaphic characteristics generally different from this area were used. This lack of data made the possible applications of a strategy used in other latitudes with good bioclimatic results unreliable. Aridity conditions intervene directly in the thermophysical properties of the earth, so it is not valid to simply extrapolate applications to other urban environments of different geographical contexts.
Earth behaves like a great collector and accumulator of energy. The soil has many potentially valuable thermal properties due to its high heat capacity and high thermal inertia. With an average density of 1800- 2500kg/m 3 , it has a specific heat of 920J/kgºK and an average thermal conductivity of 0.3W/mºK (compared to 0.58W/mºK for water and 380W/mºK for copper). The volumetric thermal capacity of soil is around 2MJ/m3ºK compared to 4.5MJ/m3ºK of water (Iannelli and Gil, 2012). On the other hand, its low thermal conductivity makes the penetration of heat into the soil very slow, as well as its cooling (Xamán et al., 2014, Ahmed, Ip, Miller and Gidado, 2009).
The thermal properties of the soil mean that diurnal temperature variations do not penetrate beyond 0.5m, but annual temperature variations reach a depth of about 4m. Beyond these depths, the temperature of the earth remains constant throughout the year (Iannelli et al., 2013).
The systematization of geothermal exploitation can be carried out using the air fluid for thermal transfer. In that case, buried pipes are used whose function is the summer or winter air conditioning of ventilation air. The system consists of circulating air from outside to inside the building through underground conduits, which allow heat exchange (Vidal and Vidal, 2011, Bisoniya T. 2015, Tiwari, Singh, Joshi, Shyam and Prabhakant, 2014).
According to Hollmuller and Lachal (2005), the internal temperature that is obtained taking advantage of the geothermal potential is 15ºC anywhere in the world, day or night, in winter or in summer, but these authors do not specify the depth of the pipe.
3.5m, there is a stabilization of the soil temperature around 23.5°C. In summer, the average environmental temperature is 28.4°C, which is significantly higher than the average of the soil.
Research carried out in Kusuda (USA) in 1965 determined that the temperature at a depth greater than 2m no longer shows variability and corresponds to the average annual temperature (Baver, Gardner and Gardner, 1991).
In hot climates, the soil temperature in summer is colder than the nighttime outside temperature, but still very warm to produce effective building cooling. Therefore, it is necessary to cool the soil below its natural temperature.
One of the experiences carried out in areas of warm and arid climate, such as San Juan, is that of Neguev (Israel). Due to the desert characteristics of the region, at Ben Gurion University, Boquer Headquarters, it was experienced covering the soil with 10cm of a layer of aggregates, which was wet very early in the morning. The condition was that the soil was not sandy, so that it retained moisture. Monitoring considered 10cm, 30cm and 60cm thick. From the beginning of watering of the layer of aggregates until the soil registered a thermal equilibrium, approximately one week passed; equilibrium that became continuous, provided watering did not cease. If the latter happened, in 5 days the temperature increased (Givoni, 1984).
For Hazim Zaki, Al-musaed and Khalil (2005), buried tube designs exhibit a varied combination in size and shape: some systems have parallel tubes ending in a header, others have a radial collection prototype in a central sump (to facilitate the removal of moisture) and, in other cases, it is only a tube. They further argue that it is important to design the system to minimize cost and maximize benefits, and, on the other hand, that the length of a tube of more than 10m, for example, is inefficient.
Similarly, small diameter tubes are more effective per unit than large tubes; they should be placed as deeply as possible, although no specifications on such depth are recorded (De Paepe and Janssens, 2003; Rouag, Benchabane and Mehdid, 2018).
DATA ACQUISITION
In order to evaluate the real cooling potential of the geothermal system in an arid zone and due to such a disparity of values in the specific bibliography, research is being carried out at INEAA with measurement of temperature and humidity values in situ. Since December 2018, temperature and humidity values of the subsoil are recorded in a suburban area of San Juan (Rivadavia-San Juan), simultaneously with measurements
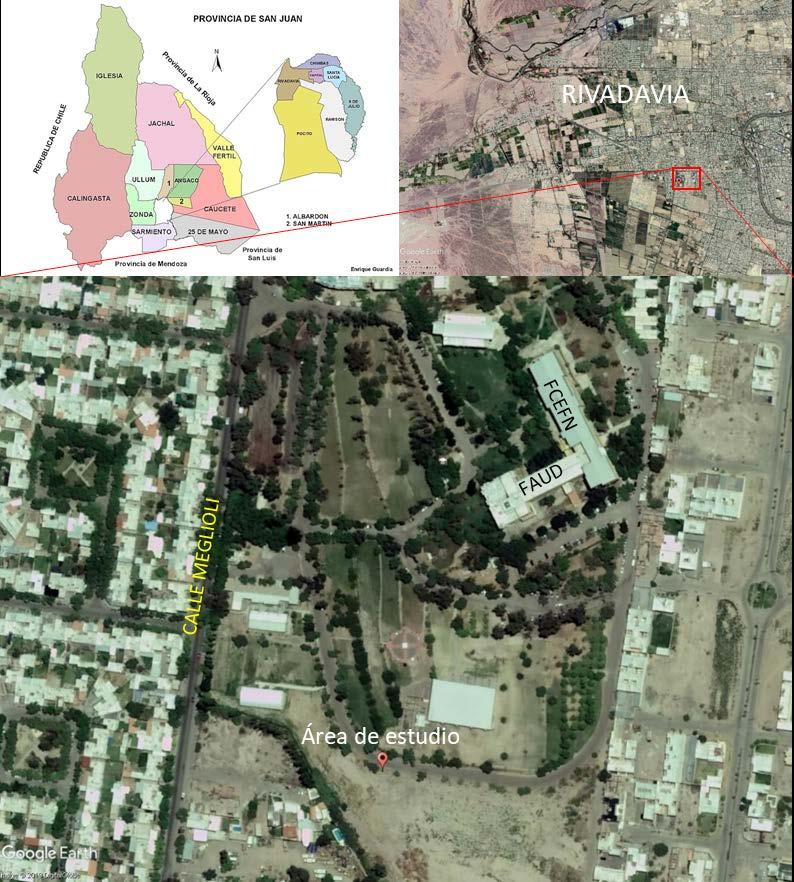
Figure 1. Location of the study area. Source: Pitaluga et al, 2019, p. 4.
of environmental parameters.
The sector under study (Figure 1) is located in Malvinas Islands University Complex (CUIM) of Universidad Nacional de San Juan (UNSJ), a complex that brings together several faculties dependent on the UNSJ. Geographically, it is located in the department of Rivadavia, located west of the capital city of San Juan (Figure 1).
In order to identify the soils present in the study sector and recognize the main characteristics and qualities that allow them to understand their origin, know their physical and chemical properties and be able to classify them taxonomically, a study was conducted (Pittaluga, Ocaña and Cortez, 2019) whose specific objectives were:
• Edaphological characterization of the sector to analyze. • Determination of physical properties of soils. • Sampling for characterization of properties in laboratory. • Taxonomic classification of soils present.
The observation site is located in the proximal portion of the mega-fan of Tulum, a geoform developed in the so-called Tulum Valley, which corresponds to an intermontane depression of tectonic origin, filled with hundreds of meters of Quaternary age river deposits. The
46 Potencial de enfriamiento geotérmico para edificaciones en zona árida Mario Cúnsulo, Alejandra Kurbán, Santiago Tosetti, Eduardo Montilla Revista Hábitat Sustentable Vol. 9, N°. 2. ISSN 0719 - 0700 / Págs. 42 -51 https://doi.org/10.22320/07190700.2019.09.02.04
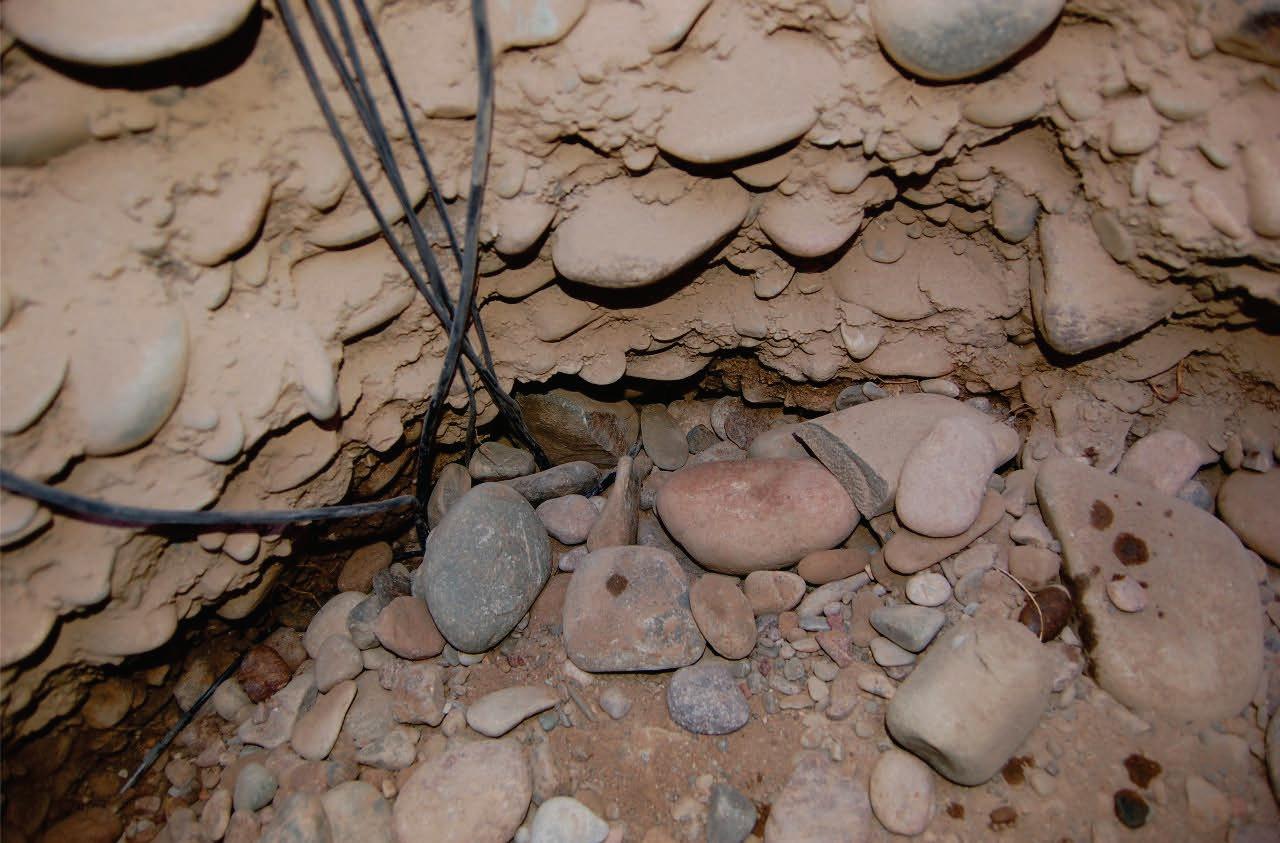
Figure 2. a) Weather Station b) Calibration c) Placement of thermocouples on the ground Source: Made by the author.
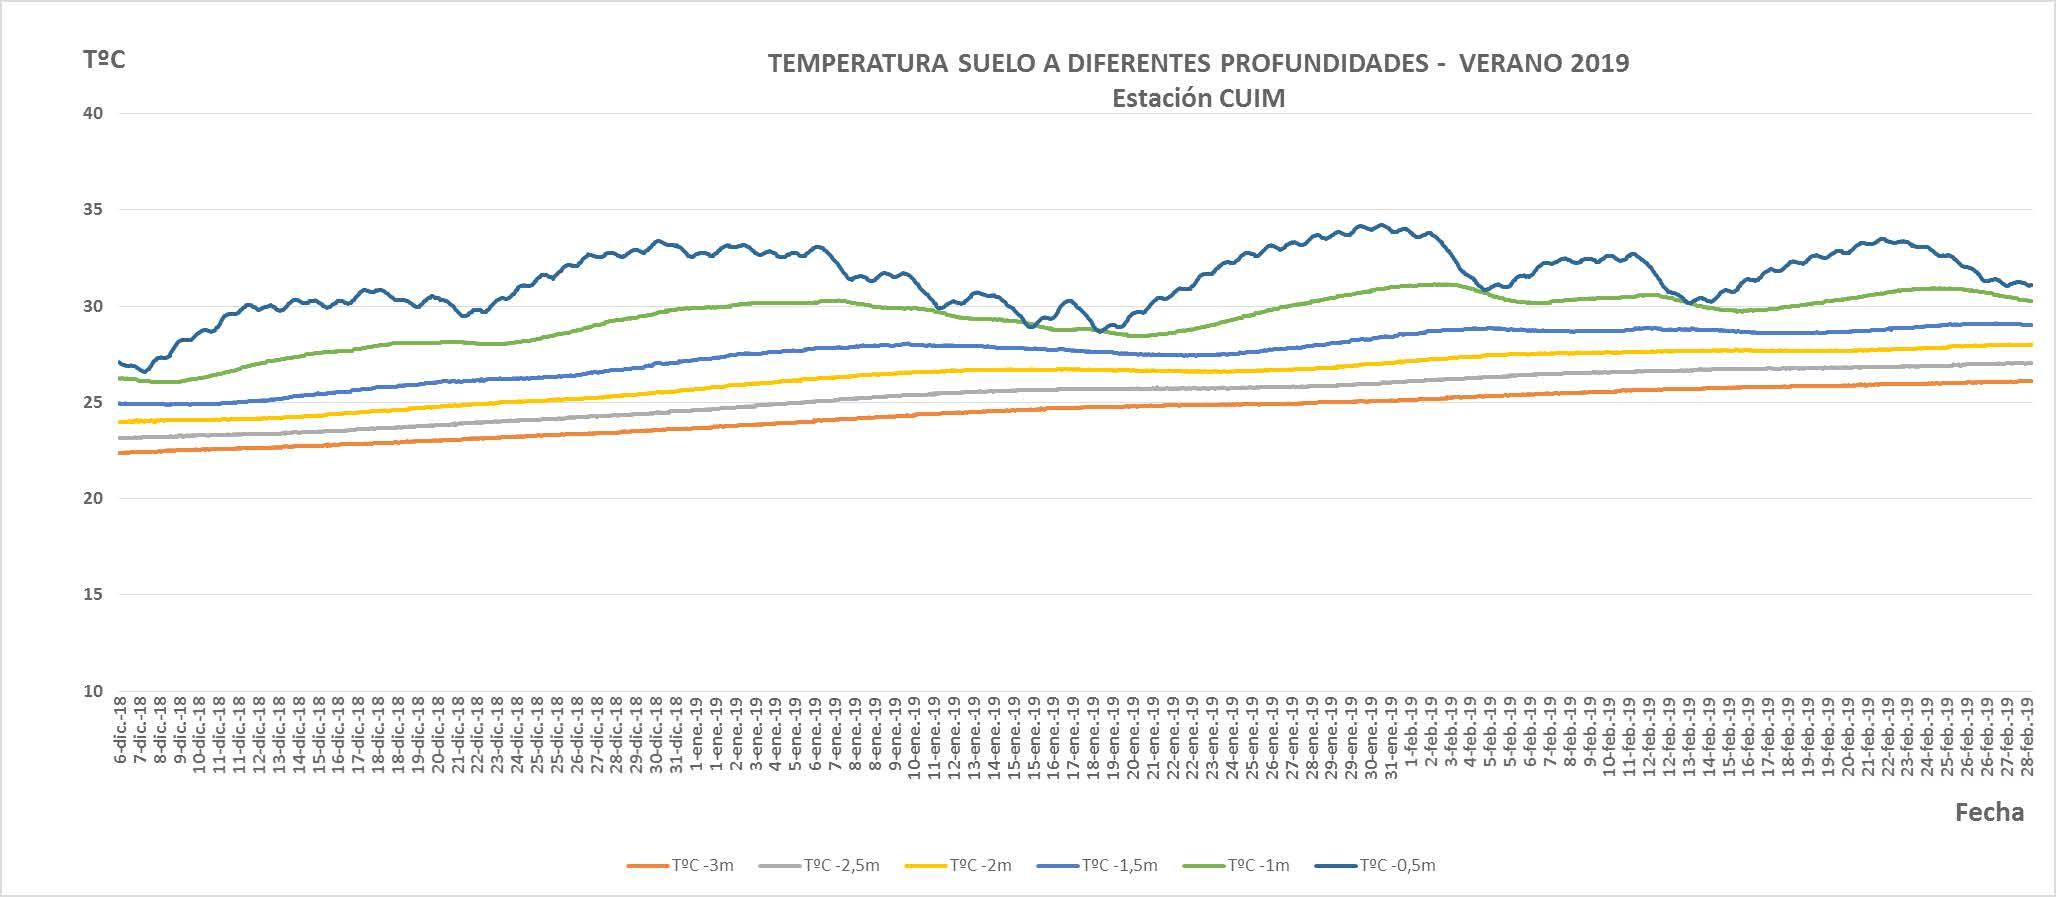
Figure 3. Air and soil temperatures at different depths Source: Made by the author.
samples analyzed have a relatively large block structure that indicates that the soil resists water penetration and movement. The average size of individual aggregates can be classified as coarse to very coarse and the degree of development is very strong. With the pH analysis, the selected layers also show values ranging from 6.67 to 8.03, from which it is possible to classify the soil as moderately basic to neutral. The low content of organic matter in the samples indicates the presence of a young soil, developed in dry and warm climates derived from materials with coarse textures.
For geothermal measurements, pairs of thermocouples from 0.50m to 3.00m deep were installed (Figure 2c), with an interval of 0.50m and a humidity sensor at a depth of 1.5m. The information was stored on a SIM card placed in the electronic control device that received the signal from buried sensors. This information was periodically accessed with a notebook, which was complemented with records from an automatic weather station (Figure 2a and b), which measures temperature and relative humidity of air, solar radiation, rainfall and atmospheric pressure, among other variables. Records of both systems are made with intervals of 1 hour.
TEMPERATURE DATA PROCESSING
TIME -3m -2,5m -2m -1,5m -1m -0,5m EXT Dif. Air/SoIL(-3m) 0 24,4 25,3 26,3 27,6 29,5 31,5 27,2 2,8 1 24,4 25,3 26,3 27,6 29,5 31,5 26,3 2,0 2 24,4 25,3 26,3 27,6 29,5 31,6 25,6 1,2 3 24,4 25,3 26,3 27,6 29,5 31,6 24,9 0,5 4 24,4 25,3 26,3 27,6 29,5 31,6 24,1 -0,3 5 24,4 25,3 26,3 27,6 29,5 31,6 23,3 -1,1 6 24,4 25,3 26,3 27,6 29,5 31,7 22,7 -1,7 7 24,4 25,3 26,3 27,6 29,5 31,7 22,3 -2,1 8 24,4 25,3 26,3 27,6 29,5 31,7 23,5 -0,9 9 24,4 25,3 26,3 27,6 29,5 31,7 25,1 0,7 10 24,4 25,4 26,4 27,6 29,5 31,7 26,4 2,0 11 24,4 25,3 26,3 27,6 29,5 31,7 27,7 3,3 12 24,4 25,3 26,3 27,6 29,5 31,7 29,0 4,6 13 24,4 25,3 26,3 27,6 29,5 31,6 30,3 5,9 14 24,4 25,3 26,3 27,6 29,5 31,6 31,3 6,9 15 24,4 25,3 26,3 27,6 29,5 31,6 32,2 7,8 16 24,4 25,3 26,3 27,6 29,5 31,6 32,8 8,4 17 24,4 25,3 26,4 27,6 29,5 31,5 33,1 8,7 18 24,4 25,3 26,4 27,6 29,5 31,5 33,1 8,7 19 24,4 25,3 26,4 27,6 29,5 31,5 32,7 8,3 20 24,4 25,3 26,4 27,6 29,5 31,5 31,6 7,2 21 24,4 25,3 26,4 27,6 29,5 31,5 30,3 5,9 22 24,4 25,3 26,4 27,6 29,5 31,5 29,2 4,8 23 24,4 25,3 26,4 27,6 29,5 31,5 28,2 3,8 PROMEDIO 24,4 25,3 26,3 27,6 29,5 31,6 28,0 3,6
Table 1. Average hourly temperature values for summer. Source: Made by the author.
January and February 2019. The pairs of hourly records were averaged at the same depth and, subsequently, the corresponding 60 values at each hour of the day, thus obtaining a record for each hour of the average summer day. Figure 3 shows the ambient temperature and those recorded at different depths of soil, in the period considered. Average values for each hour of the period studied are shown in Table 1.
Figure 4 shows the seasonal averages for summer of variations in air and soil temperature at different depths.
Although to date the number of records in CUIM is scarce (7 months), measurements made do not confirm the estimates of Hollmuller and Lachal (2005), according to which, anywhere in the world, day or night, in winter or in summer there are soil temperatures of 15ºC. Instead, they are closer to what Baver et al., (1991) has upheld, who establish that temperature at a depth of 2m corresponds to the average annual temperature. In this regard, and as indicated by the statistics of urban climate of the Metropolitan Area of San Juan (Ortega, Montilla and Cúnsulo, 2013), temperature at 2m depth is 21.07ºC.
For Iannelli et al. (2013), thermal properties of the soil mean that diurnal temperature variations do not penetrate beyond 0.5m, but annual temperature variations reach a depth of about 4m. Beyond these depths, the temperature of the earth remains constant throughout the year. Its value is approximately 1.7ºC higher than the average value of the annual surface air temperature.
48 Potencial de enfriamiento geotérmico para edificaciones en zona árida Mario Cúnsulo, Alejandra Kurbán, Santiago Tosetti, Eduardo Montilla Revista Hábitat Sustentable Vol. 9, N°. 2. ISSN 0719 - 0700 / Págs. 42 -51 https://doi.org/10.22320/07190700.2019.09.02.04
However, it is observed that temperatures recorded by sensors installed in the CUIM show values higher than those indicated by that bibliography.
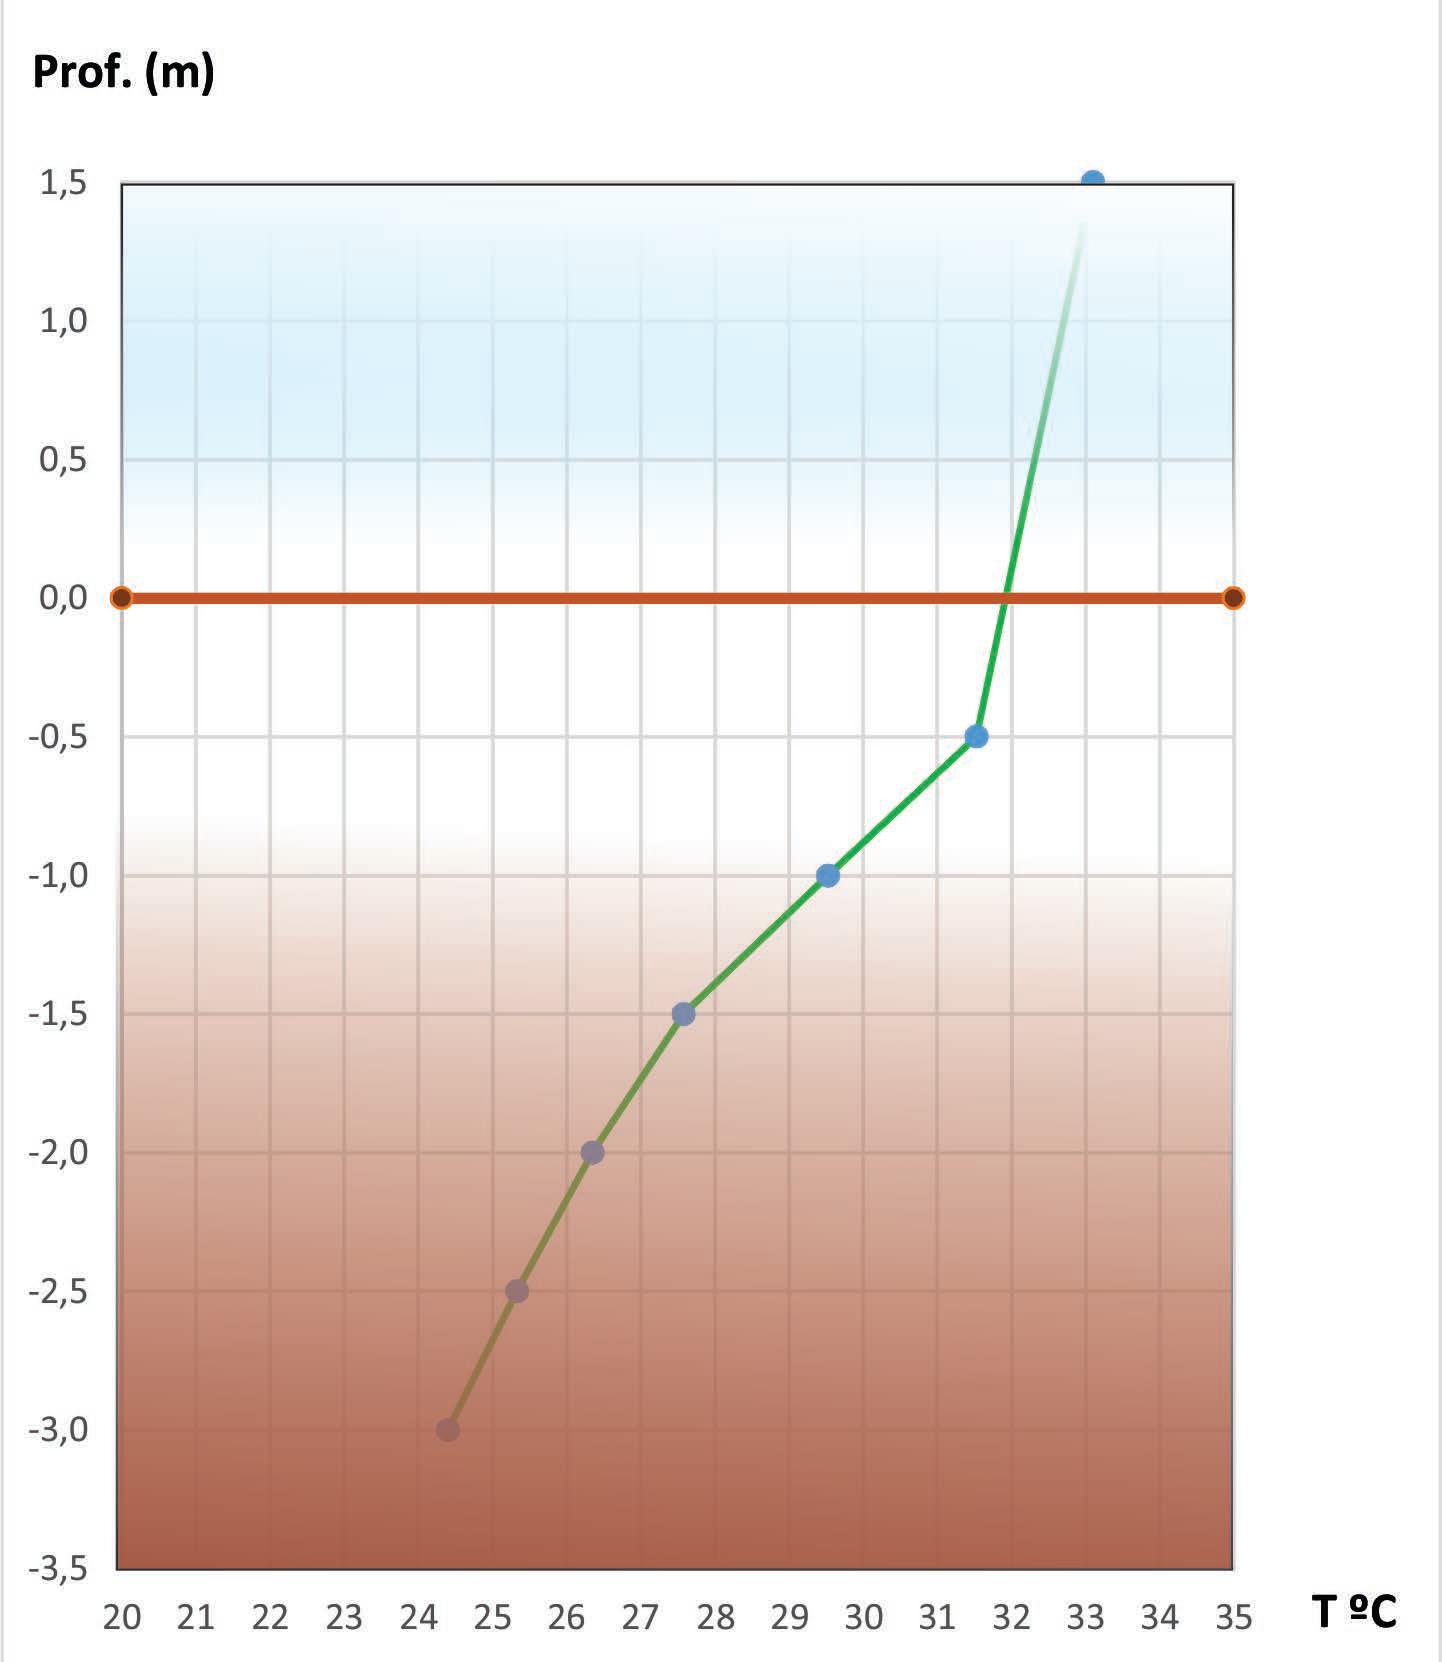
With the values of soil temperature obtained, two graphs were prepared that show the profile of that climatic variable in the hours of exterior maximum and minimum (07 am and 05 pm). They are presented in Figures 5 and 6, respectively.
APPLICATION OF THE GEOTHERMAL SYSTEM IN THE CLIMATIZATION OF A SOCIAL HOUSING
In order to design the geothermal cooling system, applying it to a three-bedroom bioclimatic housing of social interest (Kurbán, Cúnsulo, Matar, Ripoll and Ortega, 2017), it is based on the calculation of the flow necessary to air condition the volume of the

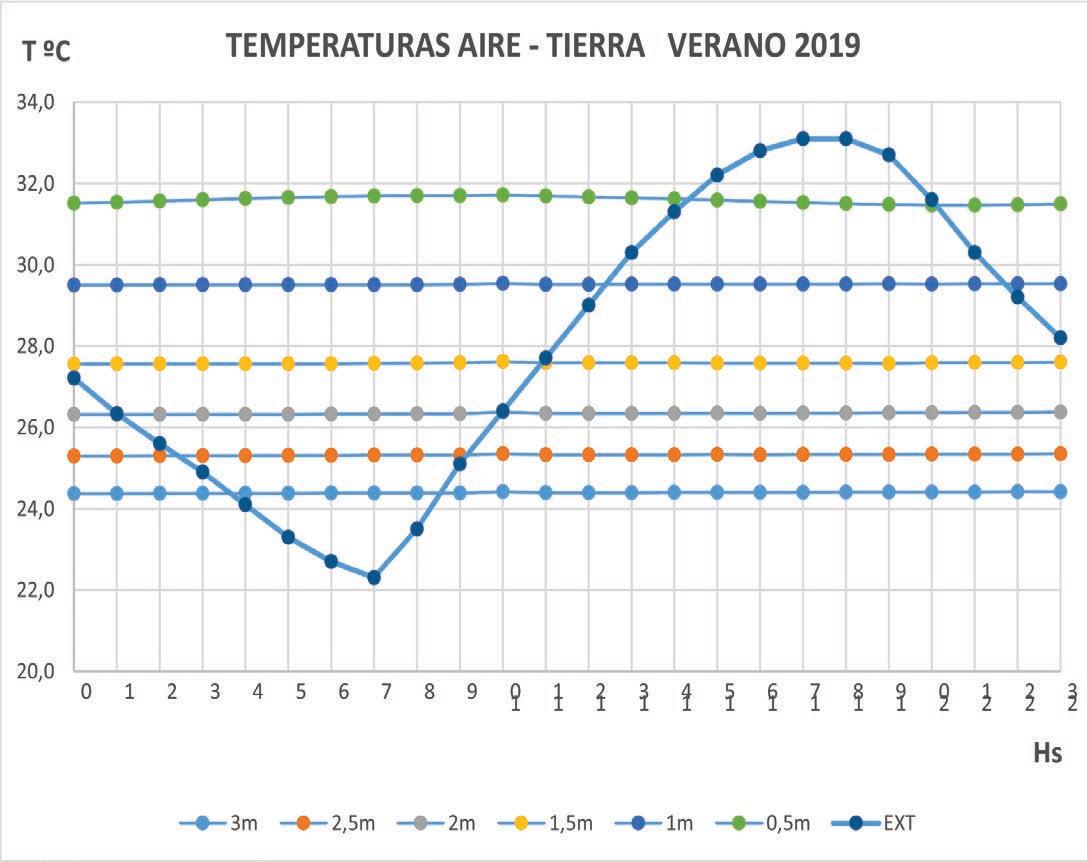
Figure 4. Subsoil temperatures at different depths. Source: Made by the author.


house, which was 212m 3 /h. Initially, a speed of 3m/s is considered within the PVC conduit of 200mm diameter and 5.9mm wall thickness with a thermal conductivity = 0.17W/mºK.
Air flow that goes through each pipe is given by the following expression: Convection resistance R conv is a function of air velocity, v(m/s) is given by the expression:
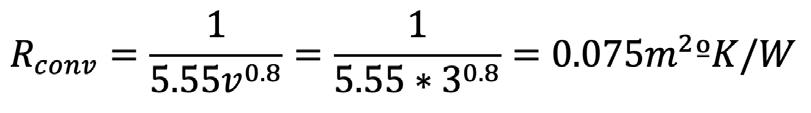
Consequently,

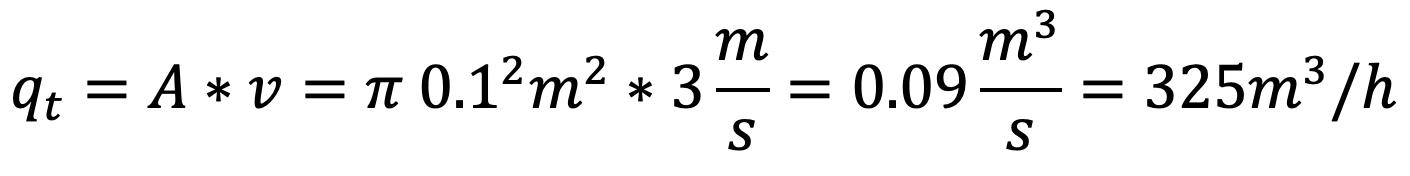
Where (m 2 ) is the area of the pipe and (m/s) is the velocity of the air in the pipe. With this value, the quantity of pipes needed is calculated based on the necessary and available flow, according to the section of the selected pipe. It is rounded to the upper integer.
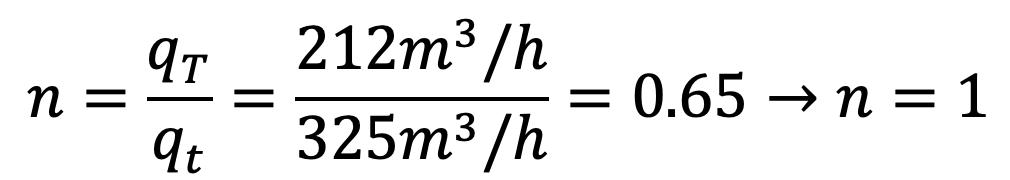
That is to say, that with a single tube it is enough to cover the air demand. With this value, the length of the pipe is calculated based on the desired indoor temperature (25ºC), the inlet air (33.15ºC) and the ground at 3m deep (24.4ºC).
To determine the heat exchange surface and the length of the pipe, it is necessary to calculate the average temperature inside the duct T ma .
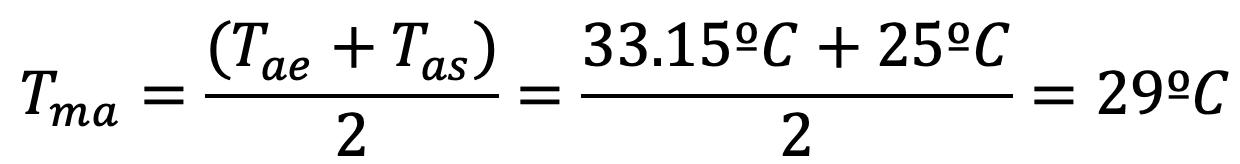
Tae is the temperature in the inlet of the pipe (ºC) and T as the temperature in the outlet.
In order to evaluate the heat exchange between the ground and the circulating air, the thermal resistance of the pipe is calculated (m 2 ºC/W), which is given by the conduction resistance R cond and convection resistance R conv .
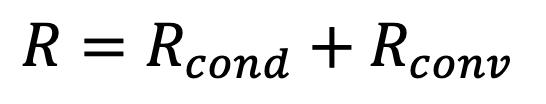
To define , the thickness of the duct wall (e = 0.0059m) and thermal conductivity (λ =0.17W/mºK) are taken into account
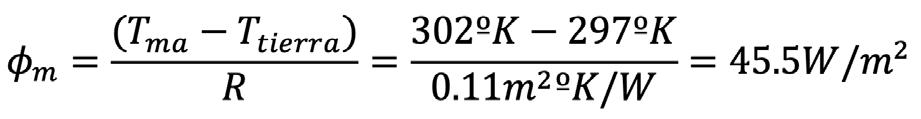
The average heat flow per unit area (W/m 2 ) is proportional to the temperature difference between the soil and inside the pipe and inversely proportional to the thermal resistance of the duct wall.
Tma = 29ºC = 302 ºK T tierra = 24ºC = 297 ºK R = 0.11m 2 ºK/W
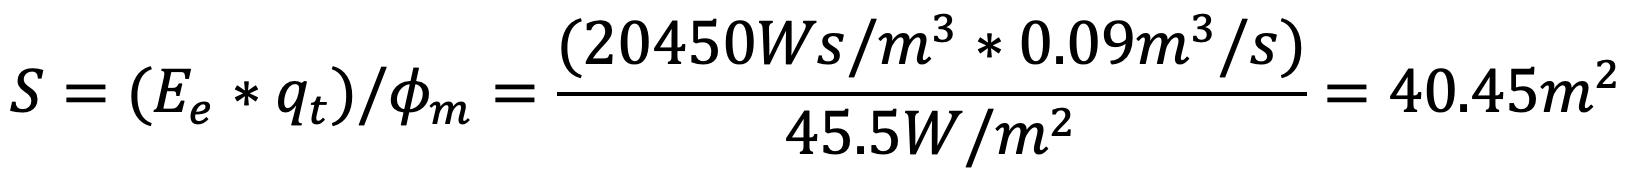
The energy that is necessary to extract from the air inside the pipe is (Ws/m 3 ) and is given by the formula:
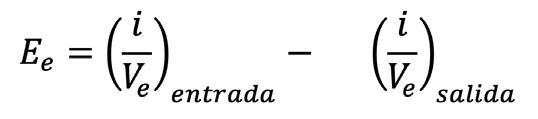
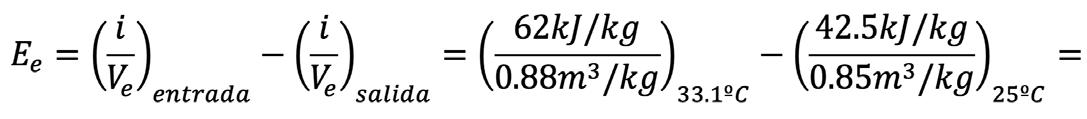
They are: i : Enthalpy of Dry Air V e : Specific Air Volume
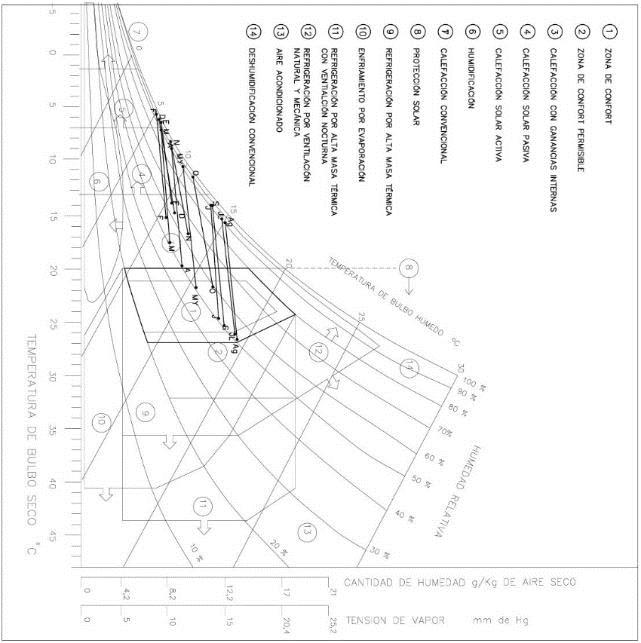
From the psychometric chart which considers a relative humidity of 35%, the values of i and V e are obtained at the inlet and outlet contemplating air temperature at the inlet and outlet, respectively.
Inlet Air Temperature (T ae ) = 33.15ºC Relative Humidity = 35% From the psychometric chart, you get then: Enthalpy of Dry Air i = 62kJ/Kg Specific Air Volume V e = 0.88m 3 /Kg
Outlet Air Temperature ) = 25ºC Relative Humidity = 35% From the psychometric chart, you get then: Enthalpy of Dry Air i = 42.5kJ/Kg Specific Air Volume V e = 0.85m 3 /Kg
Replacing the values in the previous formula, you get:
The necessary exchange area S(m 2 ) results in:
BIBLIOGRAPHIC REFERENCES
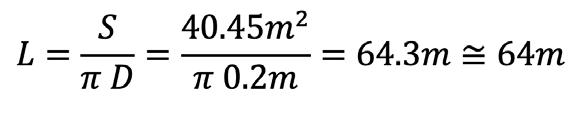
To calculate the length of the pipeline, it is necessary to divide the exchange surface, taking into account the diameter (D) of pipes.
If the air speed is lowered to 2m/s, the air flow that would circulate through the ducts would be 0.06m 3 /s, and the length of the ducts could be reduced to 27m.
CONCLUSIONS
The geothermal cooling system is a good alternative to consider for summer thermal conditioning, especially at times when the outside air temperature is 35ºC or more, since a thermal jump of 11ºC is achieved. The cooling effect produced by ventilation by the movement of the air driven from the ducts must be added to this (Neila F., Bedoya C. (2001).
The system is not effective in some hours, especially at night, when the temperature of the outside air is lower than that of the ground at 3m depth. In these cases, the nighttime ventilation strategy is more effective, because of the cooling.
The temperature at 3m deep in summer is approximately 3ºC higher than the annual average air temperature, with the characteristics of the soil present at the measurement site. This may vary in presence of another type of soil, which should be validated through field studies.
The soil temperature has a tendency to continue decreasing depending on the depth, beyond 3m with the type of soil analyzed. Consequently, a greater thermal jump could be obtained by burying the pipe in greater depth, but the greater cost overrun should be studied in order to assess its feasibility and the amortization time.
From the values found, it can be stated that the implementation of a geothermal system for building cooling is highly beneficial from the point of view of the thermal comfort of the inhabitants and contributes to generating significant money savings in building air conditioning, that is, it collaborates with the sustainability of the human habitat.
Ahmed, A., Ip, K., Miller, A. y Gidado, K. (2009). Thermal performance of earth-air heat exchanger for reducing cooling energy demand of office buildings in the United Kingdom. En Eleventh International IBPSA Conference, Glasgow, Scotland, July 27-30, 2009.
Bansal, V., Misra, R., Agrawal, G.D. y Mathur, J. (2010). Performance analysis of earth-pipe-air heat exchanger for summer cooling. Energy and Buildings, 42 (5), 645-648.
Baver, L., Gardner, W. y Gardner, W. (1991). Física de suelos. Primera ed. México: Grupo Noriega.
Bisoniya, T. (2015). Design of earth–air heat exchanger system. Geothermal Energy, 3(18). DOI 10.1186/s40517-015-0036-2
Cabezas, A. (2013). Eficiencia energética a través de utilización de pozos canadienses con el análisis de datos de un caso real “Casa Pomaret”. Tesina final de Master en Edificación. Universidad Politécnica de Catalunya – UPC, Barcelona.
Cohenca, D., Bordas, M., Schvartzman, D. (2013). Caracterización de las propiedades térmicas del suelo – Campus universitario San Lorenzo –Paraguay. En Acta de la XXXVI Reunión de Trabajo de la Asociación Argentina de Energías Renovables y Medio Ambiente. Vol. 1 (pp. 08.43-08.52). Salta: ASADES.
De Paepe, M. y Janssens, A. (2003). Thermo-hydraulic design of earth-air heat exchangers. Energy and Buildings, 35(4), 389- 397.
Flores Larsen, S., Hernández, A., Lesino, G. y Salvo, N. (2001). Measurement and simulation of the thermal behavior of a massive building with passive solar conditioning. En Proceedings of VII International Building Simulation Congress (pp. 183-190), Río de Janeiro, Brazil.
Flores Larsen, S. y Lesino, G. (2001). Modelización de intercambiadores tierra-aire para acondicionamiento térmico de edificios. En Actas del 8º Congreso Latinoamericano de Transferencia de Calor y Materia (LATCYM 2001), México.
Givoni, B. (1984). Curso Extensivo “Acondicionamiento térmico para edificios en verano, mediante emergías naturales”. Mendoza (5 al 28 de mayo).
Hazim Zaki, H., Al-musaed, A. y Khalil, A. (2005). En Thermal earth inertia such a source of energy for bio-sustainable house. The 2005 World Sustainable Building Conference, Tokyo.
Hollmuller, P. y Lachal, B. (2005). Buried pipe systems with sensible and latent heat. Exchange validation of numerical simulation against analytical solution and long-term monitoring. Montreal: Escuela Politécnica de Montreal.
Iannelli, L., Bezzo, E., Bermejo, A., Cozza, P., Fiora, J., Niño, J., Prieto, R., Romero P., Gil S. (2013). La tierra como acondicionador natural de ambientes. En Primer Encuentro Latinoamericano de Uso Racional y Eficiente de la Energía (25-27 septiembre 2013), Universidad de Buenos Aires (UBA), Instituto Nacional de Tecnología Industrial (INTI).
Iannelli, L. y Gil, S. (2012). Acondicionamiento térmico de aire usando energía geotérmica-ondas de calor. Lat. Am. J. Phys. Educ., 6(1), 100.
Kurbán, A., Cúnsulo, M., Álvarez, A., Montilla, E. y Ortega, A. (2015). The role of bioclimatic architecture in the reduction of the emission of CO 2 in arid environments. Environmental Science, 11(6), 171-178.
Kurbán, A., Cúnsulo, M., Matar, M., Ripoll, V. y Ortega, A. (2017). Social bioclimatic urban prototype in arid area. Energy and economic assessment. International Journal of Applied Science and Technology, 7(4).
Neila, F. y Bedoya, C. (2001). Técnicas arquitectónicas y constructivas de acondicionamiento ambiental. 2ª Edición. Madrid: Murilla –Lería.
Ortega A., Montilla E. y Cúnsulo M. (2013). Clima urbano árido. Base de datos para estudios del Área Metropolitana de San Juan. AVERMA, 17, 11.19 a 11.26.
Pittaluga, A., Ocaña, E. y Cortez, V. (2019). Estudio de suelos en el área del Complejo Universitario Islas Malvinas (CUIM). Rivadavia - Provincia de San Juan. (Inédito).
Rouag, A., Benchabane, A. y Mehdid, C. (2018). Thermal design of Earth-to-Air Heat Exchanger. Part I. A new transient semianalytical model for determining soil temperature. Journal of Cleaner Production, 182, 538-544.
Tiwari, G., Singh, V., Joshi, P., Shyam, D. A., Prabhakant, G. A. (2014). Design of an Earth Air Heat Exchanger (EAHE) for Climatic Condition of Chennai, India. Open Environmental Sciences, 8, 24-34.
Vidal J. y Vidal O. (2011). Instalaciones de ventilación. En: Sistemas Eficientes de Climatización (pp. 2-8). Barcelona: La Salle - Universitat Ramón Llull.
Xamán, J., Hernández-Pérez, I., Arce, J. Álvarez, G., RamírezDávila, L. y Noh-Pat, F. (2014). Numerical study of earth-to-air heat exchanger: the effect of thermal insulation. Energy and Buildings, 85(Suppl. C), 356-361.


