5 minute read
Appendix A: Notes about the Social Gradient and Mortality Analysis

APPENDIX A
Notes about the Social Gradient and Mortality Analysis
Advertisement
This appendix is a technical manual to accompany the SDOH guide. We recommend that LHD epidemiologists read the SDOH guide first, then refer to this appendix to read in more detail. This appendix is for the staff that will actually do the work of downloading, cleaning, analyzing, and mapping the data. It was designed with an epidemiology student intern in mind, but more seasoned epidemiologists will benefit by reading this as well. The manual includes steps, screenshots, limitations, and more advanced technical considerations about how to download and analyze the core data for SDOHs. Some of these datasets are only available in California (i.e., California Health Interview Survey and the Healthy Community Indicator Project); nevertheless, health departments outside of California will benefit from the detailed instructions and discussions about analyzing mortality, along with data from the Census Bureau.
THE SOCIAL AND EDUCATIONAL GRADIENT
For the purposes of this analysis, a neighborhood is defined as a collection of Census tracts categorized by the poverty groups. To calculate it, one must total the numbers of people living below the federal poverty level, normally less than 5.0%, 5.0% to 9.9%, 10.0 to 19.9%, 20.0 to 29.9%, and 30.0% and more, and stratified these rates by race and ethnicity. For this guide, we have Hispanic/ Latino as a mutually exclusive group; note that this is not possible in every dataset. A similar method is used for educational attainment, which is explained elsewhere in this appendix.
LIFE EXPECTANCY AT BIRTH
To calculate life expectancy at birth along the social gradient, one has to have geocoded mortality data with the Census tract appended. Further, a life table is required as this graph requires 25 separate life expectancy calculations. Methods on life tables can be found in standard textbooks.
AGE-ADJUSTED MORTALITY
In order to remove the effects of age on mortality, deaths rates should be adjusted (i.e., standardized to the U.S. population) to make meaningful comparison along the social gradient. In order to calculate this, death rates for specific age groups in each social and racial strata should be calculated. BARHII used ten-year age groups for its calculations. Methods on age adjustment are found in standard epidemiology textbooks.
POPULATION-ATTRIBUTABLE RISK AND EDUCATIONAL ATTAINMENT
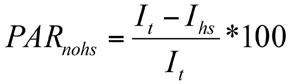
Population-attributable risk (PAR) measures the excess incidence of a disease in a population that is attributable to a risk factor, or “no high school education” in this analysis. The PAR for cause-
specific mortality with no high school education as the risk factor in BARHI member counties was calculated by subtracting the incidence of death in adults 25 to 64 years with a high school education or greater from the total incidence of death of adults 25 to 64 years for each group cause of death. The education status of the deceased is indicated on his/her death certificate, which was obtained from the California 2009, 2010, and 2011 Death Statistical Master Files. Population denominators are from Census 2010. This method is found in standard epidemiology textbooks, but this publication, Methods for Measuring Health Inequalities (Part II), from the World Health Organization explains the method well: http://bvs1.panaftosa.org.br/local/file/textoc/SCHNEIDER_CASTILLO_BACALLO_LOYOLA_MUJICA_VIDAURRE_ROCA_methods_inequalities.pdf. For table 1 in the introduction, the following formula was used:
PARnohs = Population-attributable risk cause-specific mortality, no high school education I t = Incidence of death in all adults aged 25–64 Ihs = For each group cause of death, the incidence of death of adults aged 25–64 with a high school education or greater.
THE SLOPE INDEX OF INEQUALITY
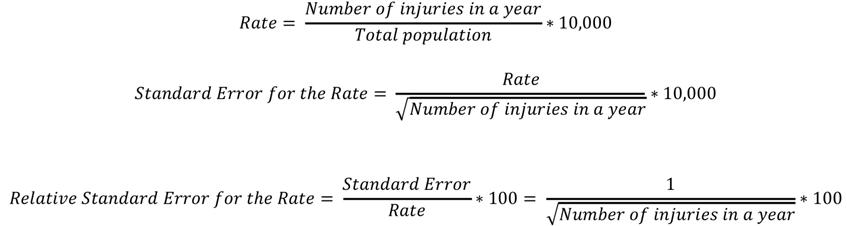
A more complex method to identify causes of death with the strongest association with neighborhood wealth is the slope index of inequality (SII). The SII is a regression coefficient that measures the association between neighborhood wealth with a health outcome such as death. BARHII adapted the methods from the WHO publication Methods for Measuring Health Inequalities (Part II) for its analysis. The death rate is calculated from death certificates of adults 18 to 64 years geocoded to their Census tract of residence in BARHII counties from 2009 through 2011. Census tract poverty denominators of those 18 to 64 years are from the American Community Survey table B17024 five-year estimates, which were multiplied by three to estimate person years for BARHII counties. For this model, neighborhood wealth is measured by a ridit score, which is based on the cumulative population living in each Census tract poverty group up the social gradient. The higher the ridit score, the wealthier the Census tract group. Once calculated, a Poisson
regression of neighborhood poverty vs. cause-specific mortality rates was run using the ‘genmod’ procedure in SAS 9.2. The general formula of the SII is as follows:
ln(deathrate) = α + β(ridit) + εv
LN(deathrate) = the natural log of the Census tract poverty group death rate for each group cause of death α = the y-axis intercept β = the slope index of inequality (i.e., the regression coefficient) ε = the error factor Ridit = The formula for a ridit score is as follows:
pj = the prevalence of people living in each Census tract poverty group (<5%, <10%, 20%, 30%+ etc) pc = the cumulative population
The SII can be plotted visually to better show the relationship between neighborhood wealth and cause-specific mortality rates. For example, Figure A-1 shows the SII for group cause of death 340
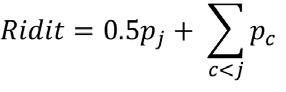
FIGURE A-1: SLOPE OF INDEX OF INEQUALITY RATES OF MORTALITY BY ASSAULT BY FIREARM, BARHII REGION, 2009-2011
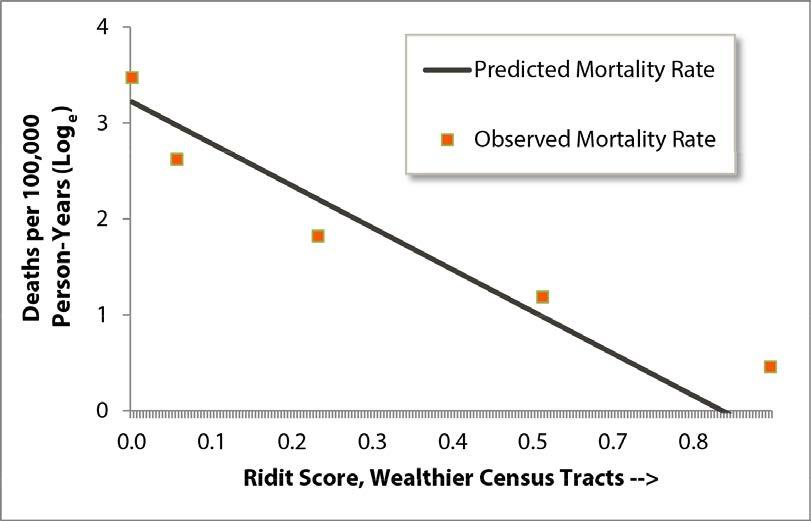
or assault by firearm. Among all causes of death in the BARHII region, this cause had the strongest association with neighborhood wealth. As shown, the model fits the data well, is statistically significant, and shows how rates of mortality by firearm decrease as neighborhood wealth increases. Conversely, Figure A-2 shows little association with neighborhood wealth and rates of death by multiple sclerosis (group cause of death 149).
FIGURE A-2: SLOPE INDEX OF INEQUALITY RATES OF MORTALITY BY MULTIPLE SCLEROSIS, BARHII REGION, 2009-2011

162 APPLYING SOCIAL DETERMINANTS OF HEALTH INDICATORS TO ADVANCE HEALTH EQUITY

