33 minute read
Aloysius A. Pam, Abdul H. Abdullah, Yen P. Tan, Zulkarnain Zainal


AUTHORS:
Aloysius A. Pam1 Abdul H. Abdullah2,3 Yen P. Tan2 Zulkarnain Zainal2
Advertisement
AFFILIATIONS:
1Chemistry Department, Federal University Lokoja, Lokoja, Nigeria 2Chemistry Department, University of Putra Malaysia, Selangor, Malaysia 3Material Synthesis and Characterisation Laboratory, Institute of Advanced Technology, University of Putra Malaysia, Selangor, Malaysia
CORRESPONDENCE TO:
Aloysius Pam
EMAIL:
aloysius.pam@fulokoja.edu.ng
DATES:
Received: 23 Mar. 2022 Revised: 24 June 2022 Accepted: 24 June 2022 Published: 29 Sep. 2022
HOW TO CITE:
Pam AA, Abdullah AH, Tan YP, Zainal Z. Physicochemical properties of porous activated carbon prepared from palm kernel shell through a low-cost activation protocol. S Afr J Sci. 2022;118(9/10), Art. #13497. https://doi.org/10.17159/ sajs.2022/13497
ARTICLE INCLUDES:
☒ Peer review ☐ Supplementary material
DATA AVAILABILITY:
☐ Open data set ☒ All data included ☐ On request from author(s) ☐ Not available ☐ Not applicable
EDITORS:
Priscilla Baker Amanda-Lee Manicum
KEYWORDS:
activated carbon, palm kernel shell, H3PO4 ratio, biomass, pyrolysis, ecofriendly
FUNDING:
None
© 2022. The Author(s). Published under a Creative Commons Attribution Licence.
Biomass-promoting routes for the synthesis of activated carbon (AC) have recently received considerable attention due to the advantages of this method: it is simple, cost-effective, and ecofriendly. This method is also an alternative way to avoid the unsafe practice of waste incineration. We describe the preparation of activated carbon from palm kernel shell (PKS) – an abundant biomass that is available in Africa and Asia. We investigated the effect of process variables such as impregnation ratio (ratio of H3PO4 to PKS) and carbonisation temperature (500–700 °C) on yield, microstructure, morphology, pore structure, and adsorption properties to optimise these parameters. Nitrogen adsorption isotherm analysis indicated that the AC was predominantly microporous in nature. Under optimal conditions, an AC with the highest surface area of 1560 m2/g was obtained. The aqueous adsorption test showed that the AC had significant removal capacity for methylene blue and iodine. The higher iodine value is consistent with the structural properties of the adsorbent, while the lower methylene blue value is consistent with the limited mesopore width. Considering the chemical and surface properties and adsorption properties of the AC produced, PKS has been shown to be an excellent precursor material for AC, thus solving the disposal problems associated with this biomass.
Significance:
• AC significantly promotes adsorption and offers a low-cost and cleaner production method. • PKS could serve as a dependable precursor for the synthesis of porous AC. • This study provides useful information on how H3PO4-impregnated PKS influences the porosity of the resulting AC. • Differences in porosity, yield, and morphology and Brunauer–Emmet–Teller surface area are achievable using AC from PKS.
Introduction
Activated carbon (AC) is an excellent adsorbent with good physical and chemical properties, including a large surface area, abundant functional groups (e.g. oxygen groups), and high porosity, and is widely used as an adsorbent in separation and purification processes.1,2 However, due to the high cost of their production, these materials are considered more expensive than other adsorbents.3 Therefore, researchers have increased their efforts to identify more efficient precursors that are less expensive, environmentally friendly, and readily available for the production of AC. Biomass is a renewable carbon source and has many ecological advantages.4 Consequently, many lignocellulosic materials – including agricultural wastes and agro-industrial by-products, such as wood sawdust5 , coconut shell6 , Polygonum orientale L.7, yam peels1, corncob8, and hazelnut bagasse9 – have been used as starting materials for the production of AC. Currently, most AC is mass-produced by chemical activation because of the high yield10, low activation time and temperature, single activation step, and well-developed pore structure11. Chemically, AC is produced from various agricultural/industrial waste, including foxnut12, tea industry waste13, grape seeds14 , corncob15, kenaf core16, and coconut shell17. The palm oil tree is commonly grown all over the world, particularly in West Africa and Southeast Asia. In Malaysia, the industrial milling process and consumption of oil palms generates a large amount of waste that is not properly disposed of in the environment. Only 60% of the palm fibres and shells generated from this milling process are utilised as the boiler fuel in the mill to generate steam and electricity.18 Hence, there is an urgent need to reuse this material and reduce the amount for disposal. An alternative to solving the disposal problems associated with agricultural waste is to increase the value of biomass through the preparation of adsorbent materials.19 Moreover, the main ecological problem in Malaysia is the pollution of water environments caused by rapid industrialisation and urbanisation.20 Therefore, the conversion of palm kernel shells (PKS) into a value-added product (such as AC) serves not only as a cost-effective solid waste control measure for the palm oil industry, but can also be applied to water treatment. Fundamentally, the porous and adsorption properties of chemically prepared AC depend on the pyrolysis conditions and the type of precursors (preferably high-carbon, low-ash, high-availability and low-cost precursors)2 and the activators used. Often chemical activation contributes to the porous structure and chemical properties of AC21 and many chemical activators, such as ZnCl2 21, KMnO4 22, H3PO4 23, KOH and K2CO3 24, have been used in the preparation of AC. Lately, H3PO4 has received increasing attention as a high-performance activator for the preparation of porous carbon materials from different biomasses. This is because of the advantages of activation and biomass dehydration at lower temperature25, inhibition of tar formation, and contribution to high surface area and desired porous structure. In addition, compared with other current activators, H3PO4 has the advantages of easy recycling and minimal environmental impact26, making it one of the most attractive activators for carbon materials. For example, using H3PO4 at moderate temperature (350 °C), an AC with high surface area of 1547 m2/g was obtained from fir sawdust27; also H3PO4 was used to produce AC from a Douglas fir with a high surface area of 826.4–1726.5 m2/g.26
Similarly, a high surface area of 2806 m2/g was obtained by preparing AC by chemical activation of paulownia wood with H3PO4. 28 Therefore, H3PO4 is a potential activation candidate for enhancing the apparent surface area and porous structure of carbon materials. Thus, it is necessary to study the effect of H3PO4 on the carbonation of PKS. However, it can be challenging to improve the pore structure of PKS AC and enhance its adsorption performance without proper optimisation of the activator behaviour, and there are few reports in the literature on the H3PO4 activator behaviour of PKS. Here we report on a low-cost method we have developed to produce high-quality porous carbon by preparing a series of ACs from PKS through H3PO4 treatment. We also investigated the effects of carbonisation temperature and H3PO4 ratio to obtain improved porous AC with enhanced adsorption performance. In addition, we performed proximate, apparent surface area, porosity, and microstructure analyses critical to understanding the properties of AC in PKS and its future applications. The ACs obtained were then applied in methylene blue and iodine removal from aqueous solution. Moreover, we aimed to promote the potential of PKS waste to address agricultural/industrial waste disposal issues and enhance its economic value. Waste that is not properly managed can have negative impacts on the environment. Burning waste in the open can cause air pollution and is particularly dangerous. Therefore, the valorisation of PKS also has environmental importance.
Materials and methods
Reagents
The main chemicals used in this study – namely phosphoric acid (H3PO4), NaOH and HCl – were purchased from Sigma-Aldrich. All chemicals were high purity and were prepared using deionised water. The PKS was supplied by the Malaysian Palm Oil Board.
Preparation of activated carbon
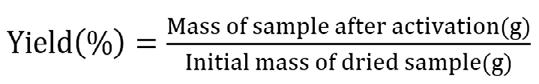
The PKS was washed with distilled water, dried in the sun, and crushed using a grinder (Hsiang Tai Machinery Industry Co.,Ltd.). PKS AC was prepared by chemical activation with 85% concentrated H3PO4. The H3PO4 and PKS powders were mixed in different ratios (1:1, 2:1, 1:2, and 3:1) of wt./wt., stirred intermittently by hand for 30 min, and then dried in an oven at 110 °C for 24 h. The samples were carbonised in a vertical tube furnace at predetermined temperatures (500 °C, 600 °C, and 700 °C) at a heating rate of 10 °C/min under a nitrogen flow of 20 mL/min for 1 h. The resulting AC was washed several times with warm deionised water until the pH was constant, then filtered and dried at 110 °C for 24 h. The yield of the AC obtained was calculated according to Equation 1. Figure 1 is a schematic of the adsorbent preparation.
Equation 1

Figure 1: Schematic depiction of the preparation of activated carbon.
Characterisation of adsorbents
The textural properties of the ACs were analysed with a surface area and porosity analyzer (Quanta Chrome Autosorb Automated Gas Sorption Instrument, Boynton Beach, FL, USA) at the temperature of liquid nitrogen. ACs were degassed under vacuum at 110 °C for 12 h before analysis. The BET (Brunauer–Emmet–Teller) equation was used to measure the specific surface area, and the pore distribution functions were determined from the adsorption branch of the isotherm according to the Barrett–Joyner–Halenda (BJH) model.29 The surface morphology and elemental composition of the ACs were observed on a Field Emission Scanning Electron Microscope (FESEM, FEI Nova 230, Denton, TX, USA). Before the imaging, samples were mounted onto self-adhesive tape, in order to obtain good cross-sectional micrographs and avoid cross contamination, and then gold coated using an auto fine coater (JFC-1600, Akishima Japan) at 20 mA for 140 s to avoid charging. The elemental composition was studied by energy dispersive X-ray spectroscopy (DAX TEAM, USA), integrated with a high-resolution FESEM. The functional groups of the ACs were analysed by Fourier transform infrared spectroscopy (FTIR, Perkin-Elmer spectrum 100, Shelton, CT, USA) using the attenuated total reflectance sampling techniques. The dried AC samples were first ground into powder and then vacuum dried. With the help of a mechanical anvil, about 20 mg of each ground AC sample was mounted on the attenuated total reflectance crystal, and spectra were reported in the range of 4000 to 400 cm-1 with a total of 32 scans per sample taken at a resolution of 4 cm-1 . The point of zero charge of the carbon materials was by pH drift method. A conical flask containing 100 mL of electrolyte solution (0.1 M NaCl) was maintained to a pH of 2, 4, 6, 8, or 10 with NaOH or HNO3 solutions (0.1 M) using a pH meter. An amount of 0.1 g of the adsorbent was added to the flasks and the suspensions were agitated in a shaker bath for 24 h at 160 rpm (25±2 °C). After the preset time had elapsed, we decanted the equilibrated solution and recorded the final stabilised pH, then plotted the final recorded pH against the initial pH.
The porosity and adsorption tests
Aqueous adsorption tests were carried out on the produced ACs in order to assess their potential application in water treatment. Iodine and methylene blue (MB) were considered as probe molecules to represent a range of molecular sizes, i.e. for assessing the adsorption capacity of adsorbent pores for solutes of molecular sizes <10 Å (iodine) and >15 Å (MB)30 . For the method reported in Pam et al.25 and Thitame and Shukla31, iodine (I2) and MB were used respectively. The remaining MB concentrating in the filtrate was determined spectrometrically using a Perkin-Elmer Lambda 35 UV-vis spectrometer at 664 nm. The Langmuir model was applied to analyse the relationship between the equilibrium adsorption capacity of the MB on the activated carbon and its equilibrium solute solutions as expressed in Equation 232:
Equation 2
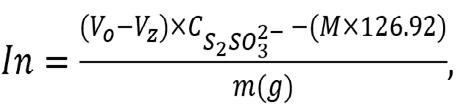
where KL is the Langmuir constant (L/mg) and qm is the maximum adsorption capacity (mg/g) relating to the monolayer covering of the adsorbate molecules. The concentration of iodine in the solution (mg/g) is expressed by Equation 3:
Equation 3
Where M is the mass of the AC, the volumes of sodium thiosulfate used for titration of the blank and the tested sample are Vo and V z, respectively, the concentration of the sodium thiosulfate solution is and 126. 92 is the mass of 1 mole of iodine. All adsorption experiments were performed in duplicate.
Results and discussion
Elemental compositional and proximate analysis
The major elements on the surfaces of the carbons, as examined through energy-dispersive X-ray spectroscopy, revealed that the adsorbents consist primarily of elemental oxygen and carbon with small amounts of phosphorus. Results of the elemental compositional analysis are presented in Table 1.
Table 1: Elemental and proximate analysis values for the various adsorbents
Sample Elemental analysis weight (%) Proximate analysis (%) C P O Si Volatile matter Ash content Moisture
AC-500 1:1 76.99 5.63 17.38 13.2 2.0 10.0 AC-500 2:1 73.82 6.53 19.65 3.6 4.0 12.0 AC-600 1:1 78.09 0.80 15.36 5.75 21.1 1.0 10.0 AC-600 1:2 75.62 9.18 15.19 1.4 1.0 7.3 AC-600 2:1 75.00 11.09 13.91 13.5 1.4 7.9 AC-600 3:1 83.21 0.78 13.77 2.24 25.0 2.0 9.0 AC-700 1:1 73.96 7.77 18.27 10.3 1.0 6.0 AC-700 2:1 73.19 8.69 18.12 19.8 1.0 7.3
As can be seen from Table 1, an increase in the proportion of H3PO4 led to an increase in the ash content. This observation is similar to that of Anisuzzaman et al.33 who attributed the leftover ash in the AC to trapped dehydrated H3PO4 products. In addition to this, a decrease in moisture percentage from 12% to 6% can be seen as carbonisation temperature increased from 500 °C to 700 °C; however, the impregnation ratio had no substantial effect on the moisture percentage. The decrease in the moisture content with increasing reaction temperature is due to the elimination of water molecules at higher temperature.
Basic properties
Point of zero charge (pHpzc) refers to the point at which the surface charge density generated on the surface of the adsorbent is zero. The examination of pHpzc offers an insight into the specificity of adsorption.34 Figure 2a represents the plot of initial and final pH values and the pHpzc is the point at which the curve of pH final vs pH initial intersects the line pHinitial pHfinal. 35 The pHpzc values of ACs are concentrated in the range of 2–4.5, which indicates that the surface of the ACs are acidic and shows a clear correlation with the surface chemistry of ACs obtained from FTIR; such a character demonstrates good potential for the elimination of metals from contaminated water. Generally, the charges on the surface can be -YOH2 + or -YOH, or -YO-, which represents the protonated, neutral, and deprotonated sites on the surfaces of the ACs, respectively. If the pH value of the adjacent solute is lower than -YOH, the carbon material is positively charged (due to migration of the neighbouring H+ to the oxygen radical of AC) and more anions are adsorbed. However, a pH of the surrounding solute above -YOH introduces negatively charged surfaces (due to breaking H+ bonds in OH or COOH which exposes negative oxygen ions) promoting the removal of cations in aqueous solution. pHPZC is the point where -YOH2 + and -YO- are equal to zero. In generally, ACs with more oxygen-containing functional groups show lower pHPZC. 36 Results of the FTIR analysis of the ACs are shown in Figure 2b. The FTIR spectra for AC-700 2:1, AC-600 3:1, AC-600 2:1, AC-600 1:1, AC-500 2:1 and AC-500 1:1 have peaks that were observed in the regions 1158, 1180, 3248, 2900, 1742 and 1061 cm-1, conforming to a P=O bond in phosphate ester, O-C bond (in P-O-C linkage or P=OOH bond), OH stretch, CH, C=O and C-O, respectively.37-40 The FTIR peaks have similar patterns and related functional groups, which can be attributed to the same precursors deployed. No major differences were observed in the peaks when varying the H3PO4 concentration. Similar spectral results were also observed for AC prepared from rice husks.41 The surface morphologies of various ACs observed by FESEM are shown in Figure 3. The average degree of porosity strongly depends on the concentration of the impregnation agent.33 Obviously, AC-500 (Figure 3a–b) and AC-600 1:2 (Figure 3d) showed very limited and poorly developed pore structure. Figure 3c–d shows that, as the impregnation concentration increased from 1 (AC-600 1:1) to 2 (AC-600 2:1), the morphology of the pore increased. The surface structure of AC-600 2:1 showed cleaner and burnout pores with tunnel-like structures or cavities (Figure 3e), as confirmed by the BET result (Table 2). AC-600 1:1 and AC600 3:1 showed typical cauliflower-like structural morphology, while AC600 1:2 (Figure 3d) showed loaf-shaped, ellipsoidal aggregated pellets.

Figure 2: (a) Determination of pHpzc of activated carbon by the pH drift method. (b) Fourier transform infrared spectroscopy of activated carbon.
Figure 3: Field emission scanning electron micrograph of prepared adsorbents: (a) AC-500 1:1, (b) AC-500 2:1, (c) AC-600 1:1, (d) AC-600 1:2, (e) AC-600 2:1, (f) AC-600 3:1, (g) AC-700 1:1 and (h) AC-700 2:1.
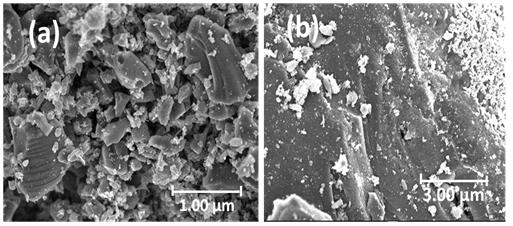
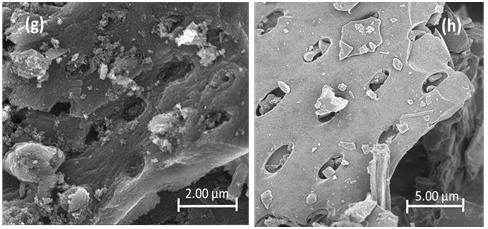
The development of the pore structure can be traced to the decomposition of the lignocellulosic structure in PKS due to the activity of H3PO4 and thermal expansion during carbonisation. During the carbonisation process, the presence of H3PO4 promotes pyrolysis dehydration, the decomposition of lignocellulosic materials and the formation of crosslinked structures, which promote the development of pores.28 This was
reasonable enough, because increasing the proportion of H3PO4 would activate the carbon and increase the volatile loss of the biopolymer, and bring about a greatly improved pore volume and surface area. However, a negative trend in pore development was observed at acid ratio 3 (at 600 °C), while the surface structure of the AC sample showed unclear pores (Figure 3f). This finding may be because the pores in the sample were blocked by H3PO4, which led to the destruction of the morphological structure of the AC. Furthermore, addition of H3PO4 beyond the optimum degree of impregnation may result in an insulating layer covering the particles, which may reduce the activation process.33 This may reduce the BET surface area and average pore size observed in this sample. In addition, when the temperature was increased to 700° C (Figure 3g–h), the pore morphology was reduced due to destruction of the morphological structure, thereby reducing the space between the pores at higher temperature.42 The details of the pore size distribution of the ACs are shown in Table 2. According to the IUPAC classification, the reported isotherm is a typical IV-type isotherm, supplemented by an H4 hysteresis loop, which is well known for micro-mesoporous carbon. AC-500 2:2, AC-600 2:1, AC-600 1:1 and AC-700 2:1 have obvious adsorption at low p/po, and there is a slight hysteresis, suggesting that micropores are filled and mesopores are affected by limit. The pore structure of AC measured by the BJH method is predominately microporous, concentrated around 1.50–2.50 nm (Figure 4c–d).
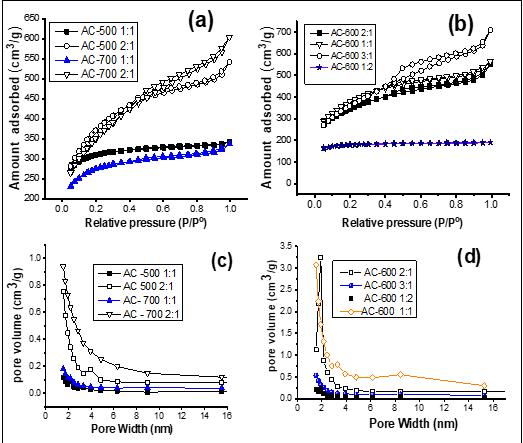
Figure 4: (a) and (b) Adsorption-desorption isotherms of N2; (c) and (d) show the corresponding pore size distribution curve obtained by the Barrett–Joyner–Halenda (BJH) method for AC-500 2:1, AC-500 1:1, AC-700 2:1, AC-700 1:1, AC-600 3:1, AC-600 2:1 and AC-600 1:1. From the results, the heat treatment and the acid/precursor weight ratio affected the BET surface area, pore volume and micropore size. At all carbonisation temperatures (500–700 °C), as the ratio of acid to PKS increased, the total pore volume increased, and the impregnation rate had a significant effect on the total pore volume. The textural properties of the prepared ACs were compared with those of previous agricultural waste based ACs and commercially available ACs. The apparent surface area of 1560 m2/g is very high and is in the comparable range of carbon (500–1500 m2/g) associated with commercial biomass AC.6 The corresponding maximum specific surface area of 1560 m2/g is much larger than that of ACs prepared from rice husk (750 m2/g) and bagasse (674 m2/g).43 The specific surface area of the AC was also larger than or equal to those reported from Yam peels (715 m2/g)1, sugarcane bagasse (1132 m2/g)44, peanut shells (1642 m2/g)45, and jackfruit peel (1260 m2/g)46, suggesting that the AC prepared from PKS is a promising adsorbent. Also, the highest pore volume of 0.611 cm3/g in the current study is correspondingly larger than those of the commercial AC, i.e. 0.172, 0.369, and 0.250 cm3/g for BPL47, and 0.60 and 0.52 cm3/g for PCB (Calgon Carbon Co., Pittsburgh, USA)48. It is well known that phosphoric acid can produce AC with inherent nuances in pore structure and a high proportion of micropores and mesopores. This may explain the satisfactory high-quality AC with an improved microstructure reported in this work.
Effects of process parameters on AC yield, BET surface area and pore properties
Product yield is an important measure for evaluating the feasibility of an adsorbent from a given precursor.49 As shown in Table 2, the percentage yields ranged from 23.4% to 53.6% and were observed to decrease with increasing acid/PKS ratio and activation temperature (500–700 °C). The H3PO4 impregnation decreased the yield percentage of AC due to the increased removal of char.50 Chen et al.51 explained that at high H3PO4 content, the gasification of surface carbon atoms became predominant, resulting in an increase in the weight loss and a low carbon yield. This trend is consistent with the findings of Al Bahri et al.52 Temperature had a significant effect on the activation yield; increasing the temperature from 500 °C to 600 °C decreased the yield from 55.5% to 30.7%. The reason for this is that, at a higher carbonisation temperature, more acid and/or volatile substances will evaporate from the sample, thereby reducing the carbon yield.50 Yefremova et al.53 proposed that the decrease in the yield of carbonised products at higher pyrolysis temperatures may be due to the increase in the primary decomposition of the precursor and the increase in the secondary decomposition of the formed carbon material. Mussatto et al.49 , Hayashia et al.54 and Wu et al.55 reported similar results from biomass materials. The effects of temperature and chemical ratio on BET surface area and average pore volume are shown in Table 2. As the activation temperature was increased from 500 °C to 700 °C, the surface area was observed to increase at a relatively low value of 961 m2/g, reaching a maximum value of 1560 m2/g at 600 °C, and then reduced reasonably to 875.8 m2/g at 700 °C. The decrease in the surface area at 700 °C may be due to the fact that the elastic limit and volume shrinkage at high temperatures make the acid
Table 2: Structural properties of activated carbons prepared at different pyrolysis temperatures and H3PO4/PKS ratios
Sample PKS/H3PO4 Temperature (oC)
AC500 1:1 1:1 AC500 2:1 2:1 AC600 1:1 1:1 AC600 1:2 1:2 AC600 2:1 2:1 AC600 3:1 3:1 AC700 1:1 1:1 AC700 2:1 2:1 500
500 600 600 600 600
700 700
SBET
(m2/g)
961 1267 1293 548 1560 1266 876 1216
Total pore volume (cm³/g) Micropore surface area (Smic,m2/g) Fixed carbon (%)
0.049 0.264 0.256 0.02
0.303 0.611 0.095 0.411 29.63 169.26 128.48 11.63 139.74 371.37 48.24 268.45 72.8 82.4 68 90.3 77.2
64.0 82.7 72.7
habitually sedentary to support more pore development.56 The impregnation rate has a significant effect on the total pore volume, because the total pore volume increases rapidly with the increase of the acid/PKS ratio, regardless of the carbonisation temperature. The BET surface area and the average pore width (nm) of the ACs, respectively, increased from 961 m2/g and 1.53 nm to 1560 m2/g and 1.71 nm as the impregnation ratio increased from 1 to 2. This is because the increase in H3PO4 promotes the contact area between PKS and H3PO4, which increases the diffusion of H3PO4 into the pore structure which increases the porosity of the final product. The BET surface area and average pore width were then reduced to 1266 m2/g and 1.53 nm, respectively, at ratio 3. This is because the higher phosphoric acid concentration forms a protective layer that prevents the incorporation of the activator into the sample, thereby preventing any increase in the specific surface area and total pore volume.51 However, when the ratio (H3PO4/PKS) was reduced to 1:2, the total pore volume was significantly reduced to a minimum value of 0.02 cm3/g. This could be due to an insufficient amount of H3PO4, which could not activate the sample effectively.39 Similar behaviour has also been reported for the effect of the impregnation ratio on the porosity of ACs obtained by H3PO4 activation of other biomass.46,57 Compared to other ratios, the AC produced at 2:1 H3PO4 showed the strongest pore width of 1.71 nm. It can be concluded that an acid/precursor ratio of 2:1 is suitable for the formation of useful pore structures and that maintaining this ratio can lead to favorable development of porosity in ACs. The effects of carbonisation temperature and impregnation ratio on BET surface area are summarised in Figure 5.
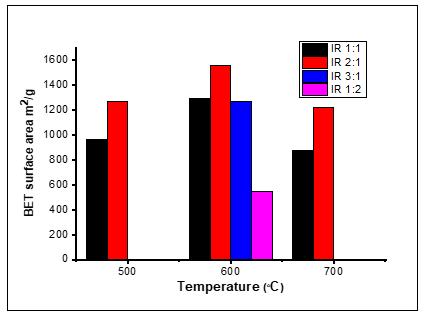
Figure 5: Effect of carbonisation temperature and impregnation ratio on Brunauer–Emmet–Teller (BET) surface area.
Adsorptive properties of the AC produced
The experimental data on MB and I2 adsorption are shown in Figure 6. The data show that the MB adsorption capacity and iodine value of AC are significantly affected by the activator ratio and temperature. We report an adsorption capacity of 118–358 mg/g for MB, while that for I2 was between 235.8 mg I2/g and 781.7 mg I2/g. The values obtained were higher than 1.33 mg/g and 769 mg/g reported by Aygün et al.58 and Gong et al.32 for MB adsorption, respectively. We found a positive correlation between the I2 value and average pore volume. Notably, AC-600 2:1, with the highest average pore width (1.71 nm), also had the highest iodine value at 781.7 mg I2/g carbon. A sudden increase in iodine value was observed as the carbonisation temperature increased from 500 °C to 600 °C, but decrease at 700 °C, which could be caused by a reduction in the carbon framework at higher temperature, which is due to shrinkage in the carbon structure at higher temperature. Similar assertions were made in related research by Mopoung and Preechachan59. The higher iodine value depends on the structural properties of the adsorbent; the MB value is lower and consistent with the limited mesopore width, as shown in Figure 4a–d. Consequently, during the diffusion process, because the cross-section of the pores is too small, the MB cannot enter the pores, which may lead to pore blockage. Another important consideration is that the presence of surface oxygen complexes may increase the resistance of MB molecules to diffusion in carbon pores.60 Therefore, this suggests that AC can adsorb more small molecules (such as iodine) and may not be suitable for adsorbing macromolecules such as MB.
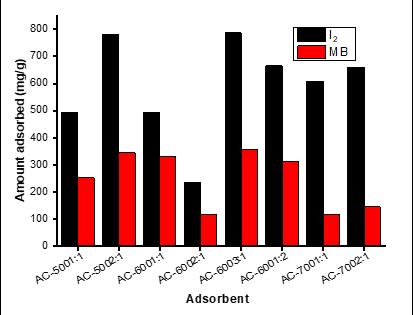
Figure 6: Experimental results for methylene blue (MB) and iodine (I2) adsorption.
Adsorption mechanism of methylene blue dye
The driving factors of the adsorption of the MB dye from aqueous solution onto the AC have been classified as electrostatic interaction, hydrogen bonding, π-π interaction and pore filling. According to the available functional groups (carboxyl, hydroxyl, and carbonyl) on the surface of the ACs as buttressed by the FTIR spectral results, there are possible electrostatic interactions between the negatively charged functional groups on the AC surface and the positively charged species of the MB (Figure 7a). Hydrogen bonding is also a potential adsorption mechanism. The nitrogen atoms on the adsorbate MB could generate hydrogen bonding with the oxygen atoms available on the surface of the ACs, as sketched in Figure 7b. In addition, MB molecules can be easily adsorbed by the π-π stacking interaction between the aromatic backbone of MB molecules and the graphene framework of the ACs (Figure 7c). Additionally, pore filling can take place due to the porous nature of the adsorbent with acceptable pore volume, thus pore filling is considered a potential mechanism (Figure 7d). However, MB as a highmolecular-weight dye may have difficulty accessing the inner pores of the AC samples, which reduces its adsorptive capacity in comparison to iodine, as reported earlier in this work. The probable MB adsorption mechanism onto the ACs is schematically illustrated in Figure 7.
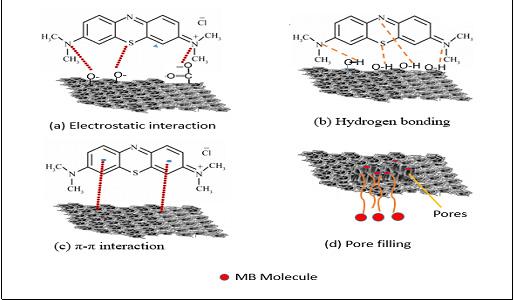
Figure 7: Schematic of the possible interactions between methylene blue (MB) and activated carbon.
Conclusion
The present findings demonstrate the efficacy of using PKS to prepare high-porosity ACs via H3PO4 activation. The isotherm of the prepared AC was type IV. Increasing the acid ratio from 1 to 2 increased the
BET surface area from 961 to 1560, but showed a negative trend at ratio 3. Increasing the acid ratio increased the total pore volume of the AC suddenly; however, the pore diameter showed no significant change. At optimal conditions, the AC (AC-600 2:1) produced at an acid to precursor ratio of 2:1 and carbonation temperature of 600 °C, showed the highest apparent BET surface area and total pore volume. The adsorption potential of the ACs in aqueous solutions containing methylene blue and iodine was promising, and further demonstrated the biosorbent potential in water purification. The physicochemical properties of H3PO4-treated PKS AC was far better than those of other agricultural-based and commercially available AC. This method may provide a new alternative strategy to produce low-cost AC and manage PKS waste without burning or throwing it into waterways.
Competing interests
We have no competing interests to declare.
Authors’ contributions
A.A.P.: Methodology; investigation; project administration; review and editing; writing – original draft; reviewing and editing. A.H.A.: Supervision; writing – review and editing; project leadership; project management. Y.P.T.: Supervision; writing – review and editing; project management. Z.Z.: Supervision; writing – review and editing; project administration; project management.
References
1. Herrera-García U, Castillo J, Patiño-Ruiz D, Solano R, Herrera A.
Activated carbon from yam peels modified with Fe3O4 for removal of 2,4-dichlorophenoxyacetic acid in aqueous solution. Water. 2019;11:2342. https://doi.org/10.3390/w11112342 2. De Castro CS, Viau LN, Andrade JT, Mendonça TAP, Gonçalves M.
Mesoporous activated carbon from polyethyleneterephthalate (PET) waste:
Pollutant adsorption in aqueous solution. New J Chem. 2018;42:14612–14619. https://doi.org/10.1039/C8NJ02715C 3. Naushad M, Khan MR, ALOthman ZA, AlSohaimi I, Rodriguez-Reinoso F,
Turki TM, et al. Removal of BrO3− from drinking water samples using newly developed agricultural waste-based activated carbon and its determination by ultra-performance liquid chromatography-mass spectrometry. Env Sci Pollut
Res. 2015;22:15853–15865. https://doi.org/10.1007/s11356-015-4786-y 4. Ma X, Yang H, Yu L, Chen Y, Li Y. Preparation, surface and pore structure of high surface area activated carbon fibers from bamboo by steam activation.
Materials. 2014;7:4431–4441. https://doi.org/10.1007/s11356-015-4786-y 5. Foo KY, Hameed BH. Mesoporous activated carbon from wood sawdust by
K2CO3 activation using microwave heating. Bioresour Technol. 2012;111:425–432. https://doi.org/10.1016/j.biortech.2012.01.141 6. Abdeljaoued A, Querejeta N, Durán I, Álvarez-Gutiérrez N, Pevida C, Chahbani
MH. Preparation and evaluation of a coconut shell-based activated carbon for CO2/CH4 separation. Energies. 2018;11:1748. https://doi.org/10.3390/ en11071748
7. Wang L, Zhang J, Zhao R, Li Y, Li C, Zhang C. Adsorption of Pb (II) on activated carbon prepared from Polygonum orientale Linn: Kinetics, isotherms, pH, and ionic strength studies. Bioresour Technol. 2010;101:5808–5814. https://doi. org/10.1016/j.biortech.2010.02.099 8. Aworn A, Thiravetyan P, Nakbanpote W. Preparation and characteristics of agricultural waste activated carbon by physical activation having microand mesopores. J Anal Appl Pyrolysis. 2008;82:279–285. https://doi. org/10.1016/j.jaap.2008.04.007 9. Demiral H, Demiral I, Tümsek F, Karabacakoğlu B. Pore structure of activated carbon prepared from hazelnut bagasse by chemical activation. Surf Interface
Anal. 2008;40:616–619. https://doi.org/10.1002/sia.2631 10. Nowicki P, Kuszyńska I, Przepiórski J, Pietrzak R. The effect of chemical activation method on properties of activated carbons obtained from pinecones. Cent Eur J
Chem. 2013;11:78–85. https://doi.org/10.2478/s11532-012-0140-0 11. Anisuzzaman SM, Joseph CG, Daud WMABW, Krishnaiah D, Yee HS. Preparation and characterization of activated carbon from Typha orientalis leaves. Int J Ind
Chem. 2015;6:9–21. https://doi.org/10.1007/s40090-014-0027-3 12. Kumar A, Jena HM. High surface area microporous activated carbons prepared from Fox nut (Euryale ferox) shell by zinc chloride activation. Appl
Surf Sci. 2015;356:753–761. https://doi.org/10.1016/j.apsusc.2015.08.074 13. Gundogdu A, Duran C, Senturk HB, Soylak M, Imamoglu M, Onal Y.
Physicochemical characteristics of a novel activated carbon produced from tea industry waste. J Anal Appl Pyrolysis. 2013;104:249–259. https://doi. org/10.1016/j.jaap.2013.07.008 14. Okman I, Karagöz S, Tay T, Erdem M. Activated carbons from grape seeds by chemical activation with potassium carbonate and potassium hydroxide. Appl
Surf Sci. 2014;293:138–142. https://doi.org/10.1016/j.apsusc.2013.12.117 15. El-Sayed GO, Yehia MM, Asaad AA. Assessment of activated carbon prepared from corncob by chemical activation with phosphoric acid. Water Resour Ind. 2014;7:66–75. https://doi.org/10.1016/j.wri.2014.10.001 16. Shamsuddin MS, Yusoff NRN, Sulaiman MA. Synthesis and characterization of activated carbon produced from kenaf core fiber using H3PO4 activation. Procedia Chem. 2016;19:558–565. https://doi.org/10.1016/j. proche.2016.03.053 17. Wang X, Li D, Li W, Peng J, Xia H, Zhang L, et al. Optimization of mesoporous activated carbon from coconut shells by chemical activation with phosphoric acid. BioResources. 2013;8:6184–6195. https://doi.org/10.15376/biores. 8.4.6184-6195
18. Shafie SM, Mahlia TMI, Masjuki HH, Ahmad-Yazid A. A review on electricity generation based on biomass residue in Malaysia. Renew Sustain Energy
Rev. 2012;16:5879–5889. https://doi.org/10.1016/j.rser.2012.06.031 19. Tejada-Tovar C, Gonzalez-Delgado AD, Villabona-Ortiz A. Characterization of residual biomasses and its application for the removal of lead ions from aqueous solution. Appl Sci. 2019;9:4486. https://doi.org/10.3390/app9214486 20. Al-Shami SA, Rawi CSM, Hassan Ahmad A, Nor SAM. Distribution of
Chironomidae (Insecta: Diptera) in polluted rivers of the Juru River Basin,
Penang, Malaysia. J Environ Sci. 2010;22:1718–1727. https://doi.org/10.1016/
S1001-0742(09)60311-9 21. Zhao H, Zhong H, Jiang Y, Li H, Tang P, Li D, et al. Porous ZnCl2-activated carbon from shaddock peel: Methylene blue adsorption behavior. Materials. 2022;15:895. https://doi.org/10.3390/ma15030895 22. Togibasa O, Mumfaijah M, Allo YK, Dahlan K, Ansanay YO. The effect of chemical activating agent on the properties of activated carbon from sago waste. Appl Sci. 2021;11:11640. https://doi.org/10.3390/app112411640 23. Deng H, Zhang G, Xu X, Tao G, Dai J. Optimization of activated carbon from cotton stalk by microwave assisted phosphoric acid-chemical activation. J Hazard
Mater. 2010;182:217–224. https://doi.org/10.1016/j.jhazmat.2010.06.018 24. Deng H, Li G, Yang H, Tang J, Tang J. Preparation of activated carbons from cotton stalk by microwave assisted KOH and K2CO3 activation. Chem Eng J. 2010;163:373–381. https://doi.org/10.1016/j.cej.2010.08.019 25. Pam AA, Abdullah AH, Tan YP, Zainal Z. Optimizing the route for medium temperature-activated carbon derived from agro-based waste material.
Biomass Conv Bioref. 2021. https://doi.org/10.1007/s13399-021-01597-5 26. Villota EM, Lei QM, Yang Z, Villota SMA, Zhang Y, Yadavalli G. Optimizing microwave-assisted pyrolysis of phosphoric acid-activated biomass: Impact of concentration on heating rate and carbonization time. ACS Sustain Chem
Eng. 2018;6:1318–1326. https://doi.org/10.1021/acssuschemeng.7b03669 27. Xu W, Liu J, Sun K, Liu Y, Chen C, Wang A, et al. Effect of activation temperature on properties of H3PO4-activated carbon. BioResources. 2021;16:4007–4020. https://doi.org/10.15376/biores.16.2.4007-4020 28. Yorgun S, Yıldız D, Şimşek YE. Activated carbon from paulownia wood: Yields of chemical activation stages. Energ Sources Part A. 2016;38:2035–2042. https://doi.org/10.1080/15567036.2015.1030477 29. Yihunu EW, Minale M, Abebe S, Limin M. Preparation, characterization and cost analysis of activated biochar and hydrochar derived from agricultural waste: A comparative study. SN Appl Sci. 2019;1:1–8. https://doi. org/10.1007/s42452-019-0936-z 30. Stals M, Vandewijngaarden J, Wróbel-Iwaniec I, Gryglewicz G, Carleer R,
Schreurs S, et al. Characterization of activated carbons derived from short rotation hardwood pyrolysis char. J Anal Appl Pyrolysis. 2013;101:199–208. https://doi.org/10.1016/j.jaap.2013.01.009
31. Thitame PV, Shukla SR. Porosity development of activated carbons prepared from wild almond shells and coir pith using phosphoric acid. Chem Eng Commun. 2015;203:791–800. https://doi.org/10.1080/00986445.2015.1104503 32. Gong J, Liu J, Chen X, Jiang Z, Wen X, Mijowska E, et al. Converting realworld mixed waste plastics into porous carbon nanosheets with excellent performance in the adsorption of an organic dye from wastewater. J Mater
Chem A. 2015;4:7313–7321. https://doi.org/10.1039/b000000x 33. Anisuzzaman SM, Joseph CG, Taufiq-Yap YH, Krishnaiah D, Tay VV. Modification of commercial activated carbon for the removal of 2,4-dichlorophenol from simulated wastewater. J King Saud Univ Sci. 2015;27(4):318–330. https:// doi.org/10.1016/j.jksus.2015.01.002 34. Yin CY, Aroua MK, Daud WMAW. Impregnation of palm shell activated carbon with polyethyleneimine and its effects on Cd2+ adsorption. Colloid Surfaces A. 2007;307:128–136. https://doi.org/10.1016/j.colsurfa.2007.05.012 35. Al-Degs YS, El-Barghouthi MI, El-Sheikh AH, Walker GM. Effect of solution pH, ionic strength, and temperature on adsorption behavior of reactive dyes on activated carbon. Dyes Pigm. 2008;77(1):16–23. https://doi.org/10.1016/j. dyepig.2007.03.001 36. Rivera-Utrilla J, Bautista-Toledo I, Ferro-García MA, Moreno-Castilla C.
Activated carbon surface modifications by adsorption of bacteria and their effect on aqueous lead adsorption. J King Saud Univ Sci. 2001;76:1209–1215. https://doi.org/10.1002/jctb.506 37. Al-Malack MH, Basaleh AA. Adsorption of heavy metals using activated carbon produced from municipal organic solid waste. Desalin Water Treat. 2016;57:24519–24531. https://doi.org/10.1080/19443994.2016.1144536 38. Fahmi AH, Jol H, Singh D. Physical modification of biochar to expose the inner pores and their functional groups to enhance lead adsorption. RSC Adv. 2018;8:38270–38280. https://doi.org/10.1039/c8ra06867d 39. Li Y, Zhang X, Yang R, Li G, Hu C. The role of H3PO4 in the preparation of activated carbon from NaOH-treated rice husk residue. RSC Adv. 2015;5:32626–32636. https://doi.org/10.1039/C5RA04634C 40. Shu Y, Tang C, Hu X, Jiang L, Hu X, Zhao Y. H3PO4-activated cattail carbon production and application in chromium removal from aqueous solution: process optimization and removal mechanism. Water. 2018;10:754. https:// doi.org/10.3390/w10060754 41. Shrestha LK, Thapa M, Shrestha RG, Maji S, Pradhananga RR, Ariga K. Rice husk-derived high surface area nanoporous carbon materials with excellent iodine and methylene blue adsorption properties. Carbon. 2019;5:1–13. https://doi.org/10.3390/c5010010 42. Gómez-Cápiro O, Hinkle A, Delgado AM, Fernández C, Jiménez R, Arteaga-
Pérez LE. Carbon aerogel-supported nickel and iron for gasification gas cleaning. Part I: Ammonia adsorption. Catalysts. 2018;8:3926–3935. https:// doi.org/10.1039/c8cy00461g 43. Kalderis D, Bethanis S, Paraskeva P, Diamadopoulos E. Production of activated carbon from bagasse and rice husk by a single-stage chemical activation method at low retention times. Bioresour Technol. 2008;99:6809–6816. https://doi.org/10.1016/j.biortech.2008.01.041 44. Castro JB, Bonelli PR, Cerrella EG, Cukierman AL. Phosphoric activation of agricultural residues and bagasse from sugar cane: influence of the experimental conditions on adsorption characteristics of activated carbons.
Ind Eng Chem Res. 2000;3:4166–4172. 45. Shang H, Lu Y, Zhao F, Chao C, Zhang B, Zhang H. Preparing high surface area porous carbon from biomass by carbonization in a molten salt medium. RSC
Adv. 2015;5:75728–75734. https://doi.org/10.1039/c5ra12406a 46. Prahas D, Yoga Kartika A, Indraswati N, Ismadji S. Activated carbon from jackfruit peel waste by H3PO4 chemical activation: Pore structure and surface chemistry characterization. Chem Eng J. 2007;140:32–42. https://doi. org/10.1016/j.cej.2007.08.032 47. Guijarro-Aldaco A, Hernández-Montoya V, Bonilla-Petriciolet A, Montes-
Morán MA, Mendoza-Castillo DI. Improving the adsorption of heavy metals from water using commercial carbons modified with egg shell wastes. Ind
Eng Chem Res. 2011;50:9354–9362. 48. Ioannidou O, Zabaniotou A. Agricultural residues as precursors for activated carbon production – A review. Renew Sustain Energy Rev. 2007;11(9):1966–2005. https://doi.org/10.1016/j.rser.2006.03.013 49. Mussatto SI, Fernandes M, Rocha GJ, Órfão JJ, Teixeira JA, Roberto IC.
Production, characterization and application of activated carbon from brewer’s spent grain lignin. Bioresour Technol. 2010;101:2450–2457. https://doi.org/10.1016/j.biortech.2009.11.025 50. Haimour NM, Emeish S. Utilization of date stones for production of activated carbon using phosphoric acid. Waste Manag. 2006;26:651–660. https://doi. org/10.1016/j.wasman.2005.08.004s 51. Chen J, Zhang L, Yang G, Wang Q, Li R, Lucia LA. Preparation and characterization of activated carbon from hydrochar by phosphoric acid activation and its adsorption performance in prehydrolysis liquor. Bioresour Technol. 2017;12:5928–5941. https://doi.org/10.15376/biores.12.3.5928-5941 52. Al Bahri M, Calvo L, Gilarranz MA, Rodríguez JJ. Activated carbon from grape seeds upon chemical activation with phosphoric acid: Application to the adsorption of diuron from water. Chem Eng J. 2012;203:348–356. https:// doi.org/10.1016/j.cej.2012.07.053 53. Yefremova S, Zharmenov A, Sukharnikov Y, Bunchuk L, Kablanbekov A,
Anarbekov K, et al. Rice husk hydrolytic lignin transformation in carbonization process. Molecules. 2019;24:1–18. https://doi.org/10.3390/ma14154119 54. Hayashi JI, Kazehaya A, Muroyama K, Watkinson AP. Preparation of activated carbon from lignin by chemical activation. Carbon. 2000;38:1873–1878. https://doi.org/10.1016/S0008-6223(00)00027-0 55. Wu Y, Jin X, Zhang J. Characterization of nitrogen-enriched activated carbons prepared from waste medium density fiberboard by H3PO4 activation. Wood
Res. 2013;58:395–404. https://doi.org/10.1007/s10086-012-1312-4 56. Olorundare OF, Msagati TAM, Krause RWM, Okonkwo JO, Mamba BB.
Activated carbon from lignocellulosic waste residues: Effect of activating agent on porosity characteristics and use as adsorbents for organic species.
Water Air Soil Pollut. 2014;225:1–14. https://doi.org/10.1007/s11270-0141876-2
57. Yorgun S, Yıldız D. Preparation and characterization of activated carbons from paulownia wood by chemical activation with H3PO4. J Taiwan Institute of Chem
Engineers. 2015;53:122–131. https://doi.org/10.1016/j.jtice.2015.02.032 58. Aygün A, Yenisoy-Karakaş S, Duman I. Production of granular activated carbon from fruit stones and nutshells and evaluation of their physical, chemical and adsorption properties. J Microporous Mesoporous Mater. 2003;66:189–195. https://doi.org/10.1016/j.micromeso.2003.08.028 59. Mopoung S, Preechachan P. Chemical and surface properties of charcoal and activated carbon prepared from soybean milk residue. NU Sci J. 2010;6: 135–146.
60. Wibowo D, Setyadhi L, Ismadji S. Modification of the surface chemistry of activated carbon and its influence on methylene blue adsorption. J Ternik Kim
Indones. 2006;5:374–384. https://doi.org/10.3390/nano11113140


